Estimated zip code population in 2022: 39,948 Zip code population in 2010: 34,882 Zip code population in 2000: 37,452
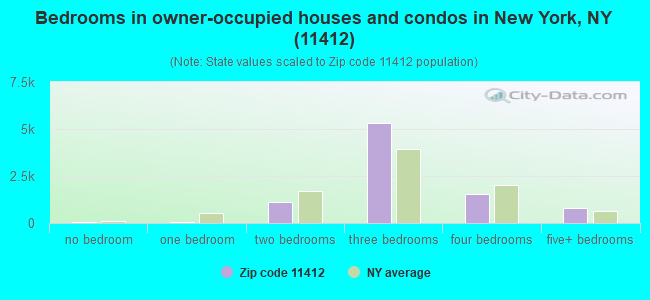
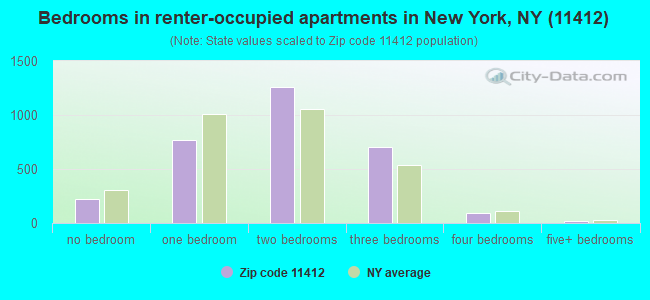
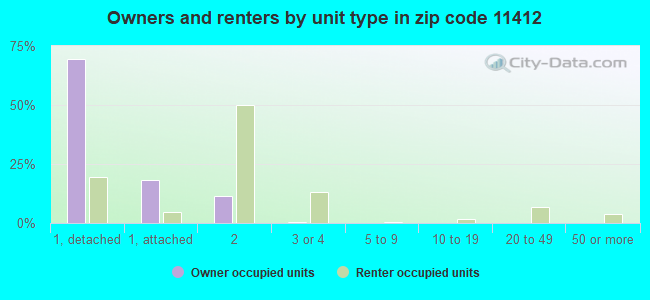
Houses and condos: 12,647 Renter-occupied apartments: 3,065
% of renters here:
26%
State:
46%
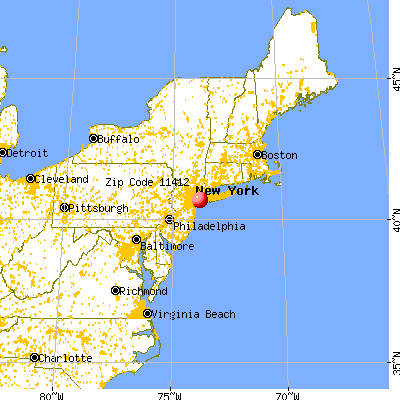
March 2022 cost of living index in zip code 11412: 146.5 (very high, U.S. average is 100)
Land area: 1.6 sq. mi. Water area: 0.0 sq. mi.
Population density: 24,263 people per square mile
(very high).
OSM Map
General Map
Google Map
MSN Map
OSM Map
General Map
Google Map
MSN Map
OSM Map
General Map
Google Map
MSN Map
OSM Map
General Map
Google Map
MSN Map
Please wait while loading the map...
Real estate property taxes paid for housing units in 2022:
This zip code:
0.7% ($4,305)
New York:
1.5% ($6,180)
Median real estate property taxes paid for housing units with mortgages in 2022: $4,330 (0.7%) Median real estate property taxes paid for housing units with no mortgage in 2022: $4,269 (0.7%)
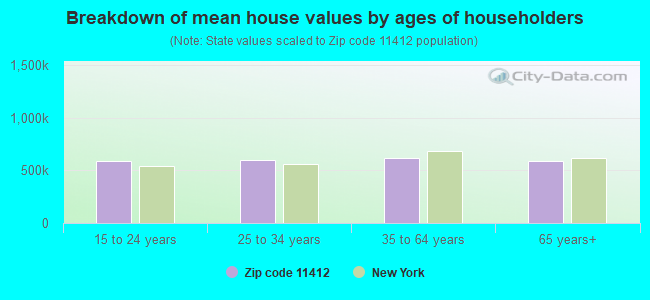
Estimated median house/condo value in 2022: $622,856
11412:
$622,856
New York:
$400,400
According to our research of New York and other state lists, there were 41 registered sex offenders living in 11412 zip code as of May 21, 2024. The ratio of all residents to sex offenders in zip code 11412 is 935 to 1. The ratio of registered sex offenders to all residents in this zip code is near the state average.
Median resident age:
This zip code:
41.2 years
New York median age:
40.0 years
Average household size:
This zip code:
3.3 people
New York:
2.5 people
Averages for the 2020 tax year for zip code 11412, filed in 2021:
Average Adjusted Gross Income (AGI) in 2020: $48,848 (Individual Income Tax Returns)
Here:
$48,848
State:
$90,930
Salary/wage: $47,351 (reported on 84.4% of returns)
Here:
$47,351
State:
$72,104
(% of AGI for various income ranges: 1025.6% for AGIs below $25k, 3712.3% for AGIs $25k-50k, 6879.0% for AGIs $50k-75k, 10085.7% for AGIs $75k-100k, 17254.6% for AGIs $100k-200k, 56151.3% for AGIs over 200k)
Taxable interest for individuals: $245 (reported on 20.7% of returns)
This zip code:
$245
New York:
$3,075
(% of AGI for various income ranges: 3.9% for AGIs below $25k, 3.4% for AGIs $25k-50k, 8.2% for AGIs $50k-75k, 13.4% for AGIs $75k-100k, 19.4% for AGIs $100k-200k, 40.0% for AGIs over 200k)
Ordinary dividends: $887 (reported on 6.5% of returns)
Here:
$887
State:
$11,095
(% of AGI for various income ranges: 2.8% for AGIs below $25k, 3.5% for AGIs $25k-50k, 8.3% for AGIs $50k-75k, 16.0% for AGIs $75k-100k, 29.9% for AGIs $100k-200k, 82.5% for AGIs over 200k)
Net capital gain/loss in AGI: +$1,912 (reported on 6.8% of returns)
Here:
+$1,912
State:
+$44,925
(% of AGI for various income ranges: 2.5% for AGIs below $25k, 2.2% for AGIs $25k-50k, 9.3% for AGIs $50k-75k, 29.9% for AGIs $75k-100k, 86.2% for AGIs $100k-200k, 886.3% for AGIs over 200k)
Profit/loss from business: +$3,802 (reported on 16.7% of returns)
Here:
+$3,802
State:
+$14,940
(% of AGI for various income ranges: 147.8% for AGIs below $25k, 47.4% for AGIs $25k-50k, 8.6% for AGIs $50k-75k, 86.8% for AGIs $75k-100k, 95.4% for AGIs $100k-200k, 1132.5% for AGIs over 200k)
Taxable individual retirement arrangement distribution: $11,410 (reported on 2.4% of returns)
11412:
$11,410
New York:
$19,609
(% of AGI for various income ranges: 12.0% for AGIs below $25k, 22.1% for AGIs $25k-50k, 33.9% for AGIs $50k-75k, 82.7% for AGIs $75k-100k, 150.4% for AGIs $100k-200k)
Total itemized deductions: $26,940 (reported on 15.4% of returns)
Here:
$26,940
State:
$39,326
(% of AGI for various income ranges: 72.4% for AGIs below $25k, 208.9% for AGIs $25k-50k, 708.3% for AGIs $50k-75k, 1334.2% for AGIs $75k-100k, 2276.6% for AGIs $100k-200k, 7088.8% for AGIs over 200k)
Charity contributions: $5,530 (reported on 12.4% of returns)
Here:
$5,530
State:
$15,420
(% of AGI for various income ranges: 5.2% for AGIs below $25k, 24.6% for AGIs $25k-50k, 100.1% for AGIs $50k-75k, 210.5% for AGIs $75k-100k, 462.0% for AGIs $100k-200k, 1700.0% for AGIs over 200k)
Taxes paid: $8,591 (reported on 15.4% of returns)
11412:
$8,591
State:
$9,183
(% of AGI for various income ranges: 19.2% for AGIs below $25k, 59.3% for AGIs $25k-50k, 228.5% for AGIs $50k-75k, 452.7% for AGIs $75k-100k, 774.1% for AGIs $100k-200k, 1683.7% for AGIs over 200k)
Earned income credit: $1,928 (reported on 18.6% of returns)
Here:
$1,928
State:
$2,138
(% of AGI for various income ranges: 90.7% for AGIs below $25k, 58.1% for AGIs $25k-50k, 0.4% for AGIs $50k-75k)
Percentage of individuals using paid preparers for their 2020 taxes: 93.9%
Here:
94%
State:
95%
(% for various income ranges: 91.8% for AGIs below $25k, 95.5% for AGIs $25k-50k, 94.3% for AGIs $50k-75k, 95.1% for AGIs $75k-100k, 94.3% for AGIs $100k-200k, 95.5% for AGIs over 200k)
Averages for the 2012 tax year for zip code 11412, filed in 2013:
Average Adjusted Gross Income (AGI) in 2012: $40,066 (Individual Income Tax Returns)
Here:
$40,066
State:
$77,088
Salary/wage: $39,307 (reported on 85.9% of returns)
Here:
$39,307
State:
$60,593
(% of AGI for various income ranges: 74.0% for AGIs below $25k, 88.9% for AGIs $25k-50k, 85.9% for AGIs $50k-75k, 87.1% for AGIs $75k-100k, 83.3% for AGIs $100k-200k, 63.5% for AGIs over 200k)
Taxable interest for individuals: $342 (reported on 22.4% of returns)
This zip code:
$342
New York:
$3,125
(% of AGI for various income ranges: 0.3% for AGIs below $25k, 0.1% for AGIs $25k-50k, 0.2% for AGIs $50k-75k, 0.1% for AGIs $75k-100k, 0.2% for AGIs $100k-200k)
Ordinary dividends: $843 (reported on 6.4% of returns)
Here:
$843
State:
$10,299
(% of AGI for various income ranges: 0.2% for AGIs below $25k, 0.1% for AGIs $25k-50k, 0.1% for AGIs $50k-75k, 0.1% for AGIs $75k-100k, 0.1% for AGIs $100k-200k)
Net capital gain/loss in AGI: +$610 (reported on 3.8% of returns)
Here:
+$610
State:
+$42,474
(% of AGI for various income ranges: 0.5% for AGIs $100k-200k)
Profit/loss from business: +$5,528 (reported on 13.8% of returns)
Here:
+$5,528
State:
+$16,168
(% of AGI for various income ranges: 11.2% for AGIs below $25k, 0.6% for AGIs $25k-50k, 0.6% for AGIs $50k-75k, 0.5% for AGIs $100k-200k)
Taxable individual retirement arrangement distribution: $10,215 (reported on 3.4% of returns)
11412:
$10,215
New York:
$17,621
(% of AGI for various income ranges: 0.7% for AGIs below $25k, 0.8% for AGIs $25k-50k, 0.7% for AGIs $50k-75k, 0.7% for AGIs $75k-100k, 1.6% for AGIs $100k-200k)
Total itemized deductions: $21,625 (33% of AGI, reported on 38.8% of returns)
Here:
$21,625
State:
$34,985
Here:
32.7% of AGI
State:
21.3% of AGI
(% of AGI for various income ranges: 9.8% for AGIs below $25k, 18.4% for AGIs $25k-50k, 24.8% for AGIs $50k-75k, 25.6% for AGIs $75k-100k, 24.0% for AGIs $100k-200k, 18.8% for AGIs over 200k)
Charity contributions: $3,539 (reported on 33.4% of returns)
Here:
$3,539
State:
$5,572
(% of AGI for various income ranges: 1.1% for AGIs below $25k, 2.6% for AGIs $25k-50k, 3.6% for AGIs $50k-75k, 3.6% for AGIs $75k-100k, 3.5% for AGIs $100k-200k, 2.5% for AGIs over 200k)
Taxes paid: $7,099 (reported on 38.7% of returns)
11412:
$7,099
State:
$18,656
(% of AGI for various income ranges: 1.8% for AGIs below $25k, 4.8% for AGIs $25k-50k, 7.9% for AGIs $50k-75k, 9.4% for AGIs $75k-100k, 9.5% for AGIs $100k-200k, 9.4% for AGIs over 200k)
Earned income credit: $2,112 (reported on 26.1% of returns)
Here:
$2,112
State:
$2,230
(% of AGI for various income ranges: 8.2% for AGIs below $25k, 1.1% for AGIs $25k-50k)
Percentage of individuals using paid preparers for their 2012 taxes: 72.3%
Here:
72%
State:
66%
(% for various income ranges: 69.8% for AGIs below $25k, 72.9% for AGIs $25k-50k, 74.3% for AGIs $50k-75k, 76.4% for AGIs $75k-100k, 75.5% for AGIs $100k-200k, 83.3% for AGIs over 200k)
Averages for the 2004 tax year for zip code 11412, filed in 2005:
Average Adjusted Gross Income (AGI) in 2004: $34,823 (Individual Income Tax Returns)
Here:
$34,823
State:
$59,519
Salary/wage: $34,691 (reported on 87.2% of returns)
Here:
$34,691
State:
$50,673
(% of AGI for various income ranges: 88.8% for AGIs below $10k, 80.2% for AGIs $10k-25k, 91.1% for AGIs $25k-50k, 88.3% for AGIs $50k-75k, 87.8% for AGIs $75k-100k, 77.6% for AGIs over 100k)
Taxable interest for individuals: $444 (reported on 34.6% of returns)
This zip code:
$444
New York:
$2,377
(% of AGI for various income ranges: 1.6% for AGIs below $10k, 0.6% for AGIs $10k-25k, 0.4% for AGIs $25k-50k, 0.4% for AGIs $50k-75k, 0.4% for AGIs $75k-100k, 0.4% for AGIs over 100k)
Taxable dividends: $519 (reported on 9.8% of returns)
Here:
$519
State:
$5,394
(% of AGI for various income ranges: 0.3% for AGIs below $10k, 0.2% for AGIs $10k-25k, 0.1% for AGIs $25k-50k, 0.1% for AGIs $50k-75k, 0.2% for AGIs $75k-100k, 0.2% for AGIs over 100k)
Net capital gain/loss: +$3,763 (reported on 5.1% of returns)
Here:
+$3,763
State:
+$23,581
(% of AGI for various income ranges: -0.4% for AGIs below $10k, -0.1% for AGIs $10k-25k, -0.0% for AGIs $25k-50k, 0.0% for AGIs $50k-75k, 0.0% for AGIs $75k-100k, 4.8% for AGIs over 100k)
Profit/loss from business: +$4,952 (reported on 10.6% of returns)
Here:
+$4,952
State:
+$13,809
(% of AGI for various income ranges: 17.5% for AGIs below $10k, 5.1% for AGIs $10k-25k, 0.6% for AGIs $25k-50k, 0.5% for AGIs $50k-75k, 0.1% for AGIs $75k-100k, 0.9% for AGIs over 100k)
IRA payment deduction: $1,994 (reported on 1.1% of returns)
11412:
$1,994
New York:
$3,115
(% of AGI for various income ranges: 0.1% for AGIs $10k-25k, 0.1% for AGIs $25k-50k, 0.0% for AGIs $50k-75k, 0.1% for AGIs $75k-100k)
Total itemized deductions: $19,951 (38% of AGI, reported on 45.3% of returns)
Here:
$19,951
State:
$25,864
Here:
38.0% of AGI
State:
21.9% of AGI
(% of AGI for various income ranges: 12.6% for AGIs below $10k, 15.8% for AGIs $10k-25k, 26.3% for AGIs $25k-50k, 30.9% for AGIs $50k-75k, 29.2% for AGIs $75k-100k, 24.5% for AGIs over 100k)
Charity contributions deductions: $3,601 (7% of AGI, reported on 41.6% of returns)
Here:
$3,601
State:
$4,439
Here:
6.7% of AGI
State:
3.6% of AGI
(% of AGI for various income ranges: 0.8% for AGIs below $10k, 2.2% for AGIs $10k-25k, 4.4% for AGIs $25k-50k, 5.3% for AGIs $50k-75k, 4.9% for AGIs $75k-100k, 4.2% for AGIs over 100k)
Total tax: $3,482 (reported on 67.9% of returns)
11412:
$3,482
State:
$11,730
(% of AGI for various income ranges: 3.5% for AGIs below $10k, 3.0% for AGIs $10k-25k, 4.9% for AGIs $25k-50k, 7.5% for AGIs $50k-75k, 9.5% for AGIs $75k-100k, 12.8% for AGIs over 100k)
Earned income credit: $1,677 (reported on 23.3% of returns)
Here:
$1,677
State:
$1,757
Percentage of individuals using paid preparers for their 2004 taxes: 72.1%
Here:
72%
State:
67%
(% for various income ranges: 65.5% for AGIs below $10k, 73.9% for AGIs $10k-25k, 72.6% for AGIs $25k-50k, 73.1% for AGIs $50k-75k, 76.9% for AGIs $75k-100k, 74.8% for AGIs over 100k)
Likely homosexual households (counted as self-reported same-sex unmarried-partner households)
Lesbian couples: 0.3% of all households
Gay men: 0.0% of all households
Household received Food Stamps/SNAP in the past 12 months: 2,235 Household did not receive Food Stamps/SNAP in the past 12 months: 9,812
Women who had a birth in the past 12 months: 372 (207 now married, 167 unmarried) Women who did not have a birth in the past 12 months: 10,038 (2,648 now married, 7,438 unmarried)
Housing units in zip code 11412 with a mortgage: 6,886 (614 second mortgage, 47 home equity loan, 292 both second mortgage and home equity loan) Houses without a mortgage: 64
Median monthly owner costs for units with a mortgage: $2,859 Median monthly owner costs for units without a mortgage: $1,039
Residents with income below the poverty level in 2022:
This zip code:
9.9%
Whole state:
14.3%
Residents with income below 50% of the poverty level in 2022:
This zip code:
4.3%
Whole state:
6.8%
Median number of rooms in houses and condos:
Here:
6.0
State:
6.3
Median number of rooms in apartments:
Here:
4.0
State:
3.8
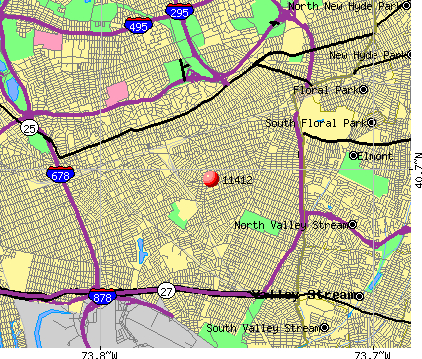
Notable locations in this zip code not listed on our city pages
Notable locations in zip code 11412: Saint Albans Branch Queens Borough Public Library (A), Fire Department New York Engine 317 Ladder 165 Battalion 54 (B), New York Ladder Company 165 (C). Display/hide their locations on the map
Churches in zip code 11412 include: English Lutheran Church (A), Saint Matthews African Methodist Episcopal Church (B), Saint Catherine of Sienna Church (C), Saint Albans Baptist Church (D), Presbyterian Church of Saint Albans (E), Lutheran Church of the Resurrection (F), Grace United Methodist Church (G), First Church of Christ (H), Christ Memorial Baptist Church (I). Display/hide their locations on the map
2,431 married couples with children.
2,137 single-parent households (386 men, 1,751 women).
83.1% of residents of 11412 zip code speak English at home.
5.2% of residents speak Spanish at home (65% very well, 16% well, 14% not well, 5% not at all).
8.7% of residents speak other Indo-European language at home (46% very well, 31% well, 19% not well, 4% not at all).
0.5% of residents speak Asian or Pacific Island language at home (41% very well, 37% well, 22% not well).
2.1% of residents speak other language at home (61% very well, 29% well, 8% not well, 3% not at all).
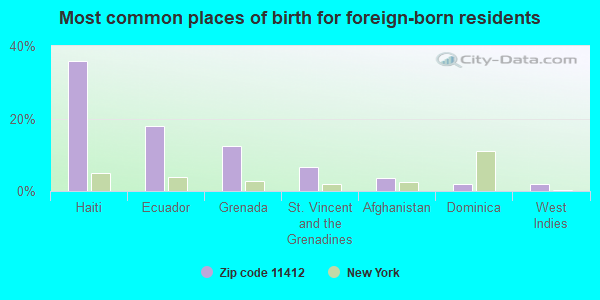
Foreign born population: 16,753 (41.9%) (76.3% of them are naturalized citizens)
This zip code:
41.9%
Whole state:
22.7%
36%Haiti
18%Ecuador
12%Grenada
7%St. Vincent and the Grenadines
3%Afghanistan
2%Dominica
2%West Indies
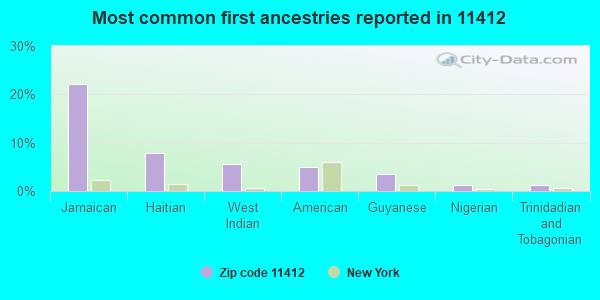
22%Jamaican
8%Haitian
6%West Indian
5%American
3%Guyanese
1%Nigerian
1%Trinidadian and Tobagonian
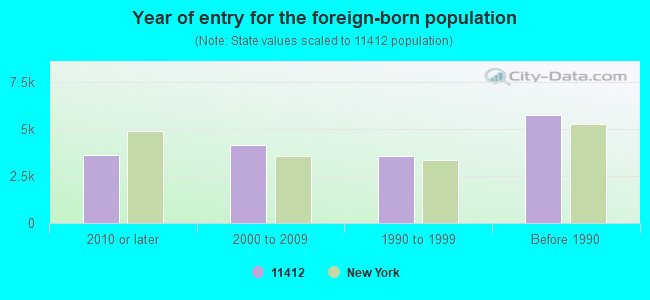
Year of entry for the foreign-born population
3,6252010 or later
4,1512000 to 2009
3,5361990 to 1999
5,729Before 1990
Public high school in in zip code 11412 not listed on the city page:
PATHWAYS COLLEGE PREPARATORY SCHOOL: A COLLEGE BO (Location: 109-89 204TH ST, Grades: 6-12)
Public elementary/middle schools in in zip code 11412 not listed on the city page:
IS 192 THE LINDEN(Students: 747, Location: 109-89 204TH ST, Grades: 6-8)
Facilities with environmental interests located in this zip code:
HOLLIS FRENCH CLEANERS OF YOUNG (204-09 HOLLIS AVENUE in JAMAICA, NY)
AIR MINOR (AIRS/AFS) STATE MASTER (New York facility tracking) - AIR PROGRAM Conditionally Exempt Small Quantity Generators, less than 100 kg/month of hazardous waste (Resource Conservation and Recovery Act (tracking hazardous waste)) - notification Business SIC classification: DRYCLEANING PLANTS, EXCEPT RUG CLEANING Business NAICS classification: DRYCLEANING AND LAUNDRY SERVICES (EXCEPT COIN-OPERATED). Organizations: NY DREAMS CORP (CONTACT/OWNER)
, HOLLIS FRENCH CLEANERS OF YOUNG INC (LEGALLY RESPONSIBLE PARTY)
Alternative names: HOLLIS CLEANERS
HARLEN SERVICE CENTER INC (122-05 MERRICK BLVD in SAINT ALBANS, NY)
(Integrated Compliance Information System) - ICIS-02-2000-7907, FORMAL ENFORCEMENT ACTION (Resource Conservation and Recovery Act (tracking hazardous waste)) Business SIC classification: GASOLINE SERVICE STATIONS Organizations: HARLEN SVC CENTER INC (CONTACT/OWNER)
IS 192 RENAISSANCE SCHOOL ( in ST. ALBANS, NY)
(National Center for Education Statistics) - STATE ID-342900010192 Organizations: NEW YORK CITY PUBLIC SCHOOLS (SCHOOL DISTRICT)
CON EDISON - MH 3083 (174TH STREET AND 111 AVE in JAMAICA, NY)
Large Quantity Generators, more that 1000 kg of hazardous waste/month (Resource Conservation and Recovery Act (tracking hazardous waste)) Organizations: CONSOLIDATED EDISON COMPANY OF NY, INC. (CONTACT/OPERATOR)
CON ED - LEFFERTS S/S (115-19 LEFFERTS in RICHMOND HILL, NY)
HAZARDOUS WASTE BIENNIAL REPORTER (Resource Conservation and Recovery Act (tracking hazardous waste)) (Resource Conservation and Recovery Act (tracking hazardous waste))
CON ED - V 900 (J F K CENTRAL in JAMAICA, NY)
HAZARDOUS WASTE BIENNIAL REPORTER (Resource Conservation and Recovery Act (tracking hazardous waste)) (Resource Conservation and Recovery Act (tracking hazardous waste))
AMOCO SERVICE STATION #4318 (113-40 MERRICK BLVD in ST ALBANS, NY)
(Resource Conservation and Recovery Act (tracking hazardous waste))
HARDCO FEDERAL LINE INC (104-20 DUNKIRK ST in JAMAICA, NY)
(Resource Conservation and Recovery Act (tracking hazardous waste))
INDEPENDENT OIL SERVICE (195-07 120TH AVE in ST ALBANS, NY)
TRANSPORTER (Resource Conservation and Recovery Act (tracking hazardous waste)) - notification Organizations: HERMAN JOHNSON (CONTACT/OWNER)
Housing units lacking complete plumbing facilities: 0.3% Housing units lacking complete kitchen facilities: 1.1%
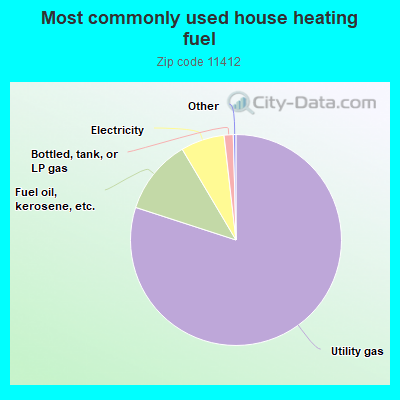
80.0%Utility gas
11.5%Fuel oil, kerosene, etc.
6.7%Electricity
1.4%Bottled, tank, or LP gas
Population in 1990: 32,003. Population change in the 1990s: +5,449 (+17.0%).
Place of birth for U.S.-born residents:
This state: 20,025
Northeast: 238
Midwest: 133
South: 2,065
West: 202
73% of the 11412 zip code residents lived in the same house 5 years ago. Out of people who lived in different houses, 65% lived in this county. Out of people who lived in different counties, 50% lived in New York.
95% of the 11412 zip code residents lived in the same house 1 year ago. Out of people who lived in different houses, 60% moved from this county. Out of people who lived in different houses, 25% moved from different county within same state. Out of people who lived in different houses, 7% moved from different state. Out of people who lived in different houses, 7% moved from abroad.
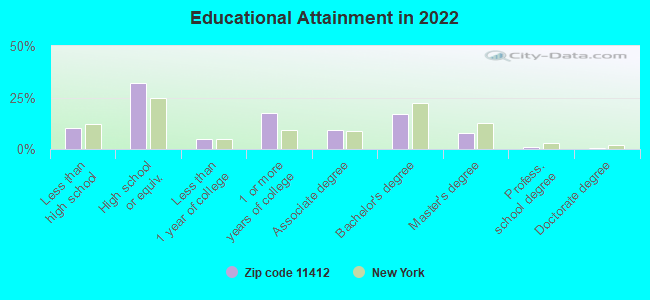
Private vs. public school enrollment:
Students in private schools in grades 1 to 8 (elementary and middle school): 436
Here:
13.5%
New York:
15.6%
Students in private schools in grades 9 to 12 (high school): 281
Here:
12.1%
New York:
15.0%
Students in private undergraduate colleges: 418
Here:
18.5%
New York:
39.2%
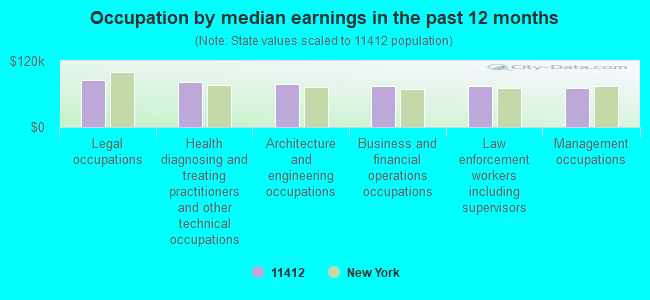
Occupation by median earnings in the past 12 months ($)
85,268Legal occupations
81,146Health diagnosing and treating practitioners and other technical occupations
78,133Architecture and engineering occupations
74,598Business and financial operations occupations
74,470Law enforcement workers including supervisors
71,133Management occupations
Companies with federal contracts located in this zip code:
SIRO'S FASHION IN DESIGN (12033 195TH ST in JAMAICA, NY; small business)
$50,140 with Defense Logistics Agency for Textile Fabrics. Taking place in CT. Signed on 2004-08-12. Completion date: 2004-12-07.
Top industries in this zip code by the number of employees in 2005:
Health Care and Social Assistance: Child Day Care Services (20-49 employees: 5 establishments, 10-19 employees: 3 establishments, 5-9 employees: 1 establishment, 1-4 employees: 10 establishments)
Health Care and Social Assistance: Services for the Elderly and Persons with Disabilities (100-249: 1, 1-4: 1)
Health Care and Social Assistance: Other Residential Care Facilities (20-49: 3)
Other Services (except Public Administration): Religious Organizations (10-19: 2, 5-9: 4, 1-4: 13)
Health Care and Social Assistance: Residential Mental Retardation Facilities (20-49: 1, 10-19: 3)
Health Care and Social Assistance: Offices of Physicians (except Mental Health Specialists) (20-49: 1, 10-19: 1, 5-9: 2, 1-4: 5)
Health Care and Social Assistance: Child and Youth Services (20-49: 1, 10-19: 2, 1-4: 1)
Educational Services: Sports and Recreation Instruction (20-49: 1, 5-9: 1)
People in group quarters in 2010:
92 people in other noninstitutional facilities
29 people in group homes intended for adults
29 people in workers' group living quarters and job corps centers
20 people in group homes for juveniles (non-correctional)
13 people in emergency and transitional shelters (with sleeping facilities) for people experiencing homelessness
4 people in residential treatment centers for adults
People in group quarters in 2000:
475 people in nursing homes
22 people in residential treatment centers for emotionally disturbed children
12 people in homes for the mentally retarded
10 people in other noninstitutional group quarters
8 people in schools, hospitals, or wards for the intellectually disabled
4 people in religious group quarters
3 people in other group homes
2 people in mental (psychiatric) hospitals or wards
Fatal accident statistics in 2014:
Fatal accident count: 2
Vehicles involved in fatal accidents: 5
Fatal accidents caused by drunken drivers: 2
Fatalities: 2
Persons involved in fatal accidents: 5
Pedestrians involved in fatal accidents: 1
Fatal accident statistics in 2013:
Fatal accident count: 1
Vehicles involved in fatal accidents: 3
Fatal accidents caused by drunken drivers: 0
Fatalities: 1
Persons involved in fatal accidents: 4
Pedestrians involved in fatal accidents: 0
Home Mortgage Disclosure Act Aggregated Statistics For Year 2009 (Based on 20 full and 12 partial tracts)
A) FHA, FSA/RHS & VA Home Purchase Loans
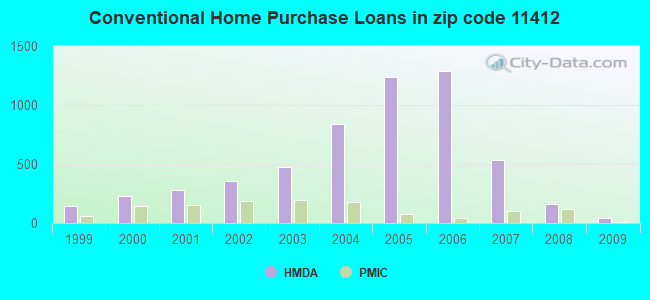
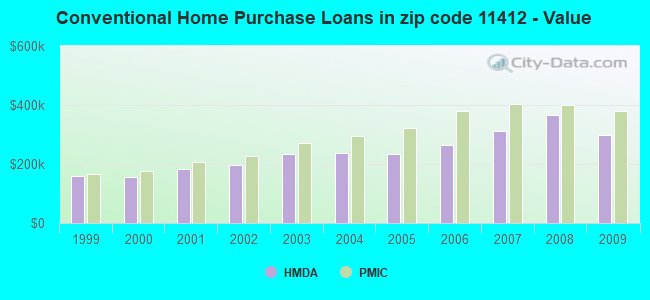
B) Conventional Home Purchase Loans
C) Refinancings
D) Home Improvement Loans
E) Loans on Dwellings For 5+ Families
F) Non-occupant Loans on < 5 Family Dwellings (A B C & D)
G) Loans On Manufactured Home Dwelling (A B C & D)
Number
Average Value
Number
Average Value
Number
Average Value
Number
Average Value
Number
Average Value
Number
Average Value
Number
Average Value
LOANS ORIGINATED
149
$348,005
40
$297,070
323
$275,831
20
$119,896
4
$354,108
14
$246,214
1
$306,000
APPLICATIONS APPROVED, NOT ACCEPTED
12
$322,592
15
$272,015
66
$264,573
23
$25,387
0
$0
4
$145,600
1
$9,000
APPLICATIONS DENIED
53
$370,081
34
$316,561
369
$305,856
64
$62,469
0
$0
9
$248,168
1
$269,970
APPLICATIONS WITHDRAWN
48
$368,023
11
$299,123
151
$300,256
11
$296,105
3
$463,553
13
$241,672
0
$0
FILES CLOSED FOR INCOMPLETENESS
8
$386,620
7
$231,923
66
$308,786
4
$264,298
0
$0
2
$79,775
0
$0
Aggregated Statistics For Year 2008 (Based on 20 full and 12 partial tracts)
A) FHA, FSA/RHS & VA Home Purchase Loans
B) Conventional Home Purchase Loans
C) Refinancings
D) Home Improvement Loans
F) Non-occupant Loans on < 5 Family Dwellings (A B C & D)
Number
Average Value
Number
Average Value
Number
Average Value
Number
Average Value
Number
Average Value
LOANS ORIGINATED
79
$383,243
158
$366,455
365
$286,036
100
$80,067
40
$277,862
APPLICATIONS APPROVED, NOT ACCEPTED
8
$383,408
60
$367,809
107
$306,031
52
$56,196
11
$256,248
APPLICATIONS DENIED
34
$394,942
179
$405,850
595
$332,211
218
$75,102
53
$303,092
APPLICATIONS WITHDRAWN
38
$407,971
49
$352,560
218
$333,812
15
$193,125
7
$268,261
FILES CLOSED FOR INCOMPLETENESS
5
$390,080
26
$351,098
71
$360,771
15
$236,586
7
$365,553
Aggregated Statistics For Year 2007 (Based on 20 full and 12 partial tracts)
A) FHA, FSA/RHS & VA Home Purchase Loans
B) Conventional Home Purchase Loans
C) Refinancings
D) Home Improvement Loans
E) Loans on Dwellings For 5+ Families
F) Non-occupant Loans on < 5 Family Dwellings (A B C & D)
G) Loans On Manufactured Home Dwelling (A B C & D)
Number
Average Value
Number
Average Value
Number
Average Value
Number
Average Value
Number
Average Value
Number
Average Value
Number
Average Value
LOANS ORIGINATED
11
$324,046
533
$311,361
1,063
$293,251
223
$125,289
3
$343,333
89
$303,114
2
$410,745
APPLICATIONS APPROVED, NOT ACCEPTED
4
$293,718
165
$308,056
294
$315,439
100
$82,063
0
$0
16
$353,069
0
$0
APPLICATIONS DENIED
2
$306,000
623
$346,059
1,235
$328,454
295
$108,388
3
$304,333
105
$318,616
4
$308,512
APPLICATIONS WITHDRAWN
6
$338,712
172
$319,441
373
$326,118
49
$229,247
2
$405,000
44
$315,998
0
$0
FILES CLOSED FOR INCOMPLETENESS
0
$0
58
$325,934
169
$319,744
10
$199,703
0
$0
9
$300,957
0
$0
Aggregated Statistics For Year 2006 (Based on 20 full and 12 partial tracts)
A) FHA, FSA/RHS & VA Home Purchase Loans
B) Conventional Home Purchase Loans
C) Refinancings
D) Home Improvement Loans
E) Loans on Dwellings For 5+ Families
F) Non-occupant Loans on < 5 Family Dwellings (A B C & D)
G) Loans On Manufactured Home Dwelling (A B C & D)
Number
Average Value
Number
Average Value
Number
Average Value
Number
Average Value
Number
Average Value
Number
Average Value
Number
Average Value
LOANS ORIGINATED
4
$381,662
1,289
$263,932
1,533
$286,620
215
$145,205
1
$784,140
159
$300,938
3
$303,750
APPLICATIONS APPROVED, NOT ACCEPTED
0
$0
259
$260,712
383
$259,647
62
$91,736
0
$0
33
$330,149
1
$125,000
APPLICATIONS DENIED
2
$401,605
949
$285,497
1,195
$296,285
285
$131,121
3
$521,667
137
$315,122
5
$123,100
APPLICATIONS WITHDRAWN
3
$358,090
460
$266,800
696
$282,273
57
$195,587
0
$0
85
$254,803
2
$282,050
FILES CLOSED FOR INCOMPLETENESS
4
$339,018
71
$280,971
217
$299,887
4
$257,502
0
$0
13
$324,033
0
$0
Aggregated Statistics For Year 2005 (Based on 20 full and 12 partial tracts)
A) FHA, FSA/RHS & VA Home Purchase Loans
B) Conventional Home Purchase Loans
C) Refinancings
D) Home Improvement Loans
E) Loans on Dwellings For 5+ Families
F) Non-occupant Loans on < 5 Family Dwellings (A B C & D)
G) Loans On Manufactured Home Dwelling (A B C & D)
Number
Average Value
Number
Average Value
Number
Average Value
Number
Average Value
Number
Average Value
Number
Average Value
Number
Average Value
LOANS ORIGINATED
14
$306,071
1,236
$235,555
1,727
$257,910
264
$139,961
5
$808,438
194
$252,745
0
$0
APPLICATIONS APPROVED, NOT ACCEPTED
1
$235,000
234
$236,366
359
$255,928
47
$69,835
0
$0
33
$245,245
0
$0
APPLICATIONS DENIED
2
$318,105
571
$263,189
1,188
$264,107
315
$100,709
2
$276,280
92
$271,352
7
$255,276
APPLICATIONS WITHDRAWN
7
$326,006
458
$256,146
917
$244,627
112
$221,813
1
$1,500,000
107
$268,441
0
$0
FILES CLOSED FOR INCOMPLETENESS
1
$387,000
108
$249,045
376
$259,607
11
$129,199
0
$0
9
$250,726
0
$0
Aggregated Statistics For Year 2004 (Based on 20 full and 12 partial tracts)
A) FHA, FSA/RHS & VA Home Purchase Loans
B) Conventional Home Purchase Loans
C) Refinancings
D) Home Improvement Loans
E) Loans on Dwellings For 5+ Families
F) Non-occupant Loans on < 5 Family Dwellings (A B C & D)
G) Loans On Manufactured Home Dwelling (A B C & D)
Number
Average Value
Number
Average Value
Number
Average Value
Number
Average Value
Number
Average Value
Number
Average Value
Number
Average Value
LOANS ORIGINATED
65
$274,401
836
$235,914
1,697
$219,838
235
$113,661
3
$126,990
117
$211,537
6
$20,568
APPLICATIONS APPROVED, NOT ACCEPTED
4
$261,410
208
$250,575
398
$218,923
49
$79,812
0
$0
31
$240,995
0
$0
APPLICATIONS DENIED
10
$272,970
287
$254,964
1,148
$213,181
297
$67,637
1
$284,410
76
$199,508
0
$0
APPLICATIONS WITHDRAWN
19
$280,045
236
$235,477
938
$219,014
102
$129,144
2
$186,970
45
$237,032
1
$293,000
FILES CLOSED FOR INCOMPLETENESS
3
$261,383
58
$265,085
225
$235,486
19
$124,752
0
$0
7
$191,116
0
$0
Aggregated Statistics For Year 2003 (Based on 20 full and 12 partial tracts)
A) FHA, FSA/RHS & VA Home Purchase Loans
B) Conventional Home Purchase Loans
C) Refinancings
D) Home Improvement Loans
E) Loans on Dwellings For 5+ Families
F) Non-occupant Loans on < 5 Family Dwellings (A B C & D)
Number
Average Value
Number
Average Value
Number
Average Value
Number
Average Value
Number
Average Value
Number
Average Value
LOANS ORIGINATED
219
$249,114
475
$232,284
1,869
$180,063
96
$37,008
4
$1,192,120
131
$175,695
APPLICATIONS APPROVED, NOT ACCEPTED
3
$248,040
117
$242,758
454
$187,525
46
$33,598
0
$0
28
$201,172
APPLICATIONS DENIED
18
$243,491
218
$219,772
1,112
$187,421
209
$37,060
0
$0
68
$180,737
APPLICATIONS WITHDRAWN
44
$267,277
135
$218,852
875
$185,128
64
$53,459
0
$0
51
$193,806
FILES CLOSED FOR INCOMPLETENESS
8
$272,114
14
$267,793
107
$183,203
6
$33,822
0
$0
3
$184,783
Aggregated Statistics For Year 2002 (Based on 20 full and 12 partial tracts)
A) FHA, FSA/RHS & VA Home Purchase Loans
B) Conventional Home Purchase Loans
C) Refinancings
D) Home Improvement Loans
E) Loans on Dwellings For 5+ Families
F) Non-occupant Loans on < 5 Family Dwellings (A B C & D)
Number
Average Value
Number
Average Value
Number
Average Value
Number
Average Value
Number
Average Value
Number
Average Value
LOANS ORIGINATED
193
$332,300
355
$197,456
1,224
$162,825
111
$27,725
6
$98,315
75
$156,075
APPLICATIONS APPROVED, NOT ACCEPTED
24
$229,406
81
$194,221
327
$153,675
60
$28,439
0
$0
15
$155,767
APPLICATIONS DENIED
23
$227,340
154
$198,786
822
$182,695
245
$26,936
5
$148,790
41
$140,616
APPLICATIONS WITHDRAWN
51
$1,156,093
100
$208,761
560
$155,000
98
$46,612
3
$419,927
12
$174,312
FILES CLOSED FOR INCOMPLETENESS
7
$239,111
14
$155,706
219
$140,987
11
$22,958
0
$0
14
$133,997
Aggregated Statistics For Year 2001 (Based on 20 full and 12 partial tracts)
A) FHA, FSA/RHS & VA Home Purchase Loans
B) Conventional Home Purchase Loans
C) Refinancings
D) Home Improvement Loans
E) Loans on Dwellings For 5+ Families
F) Non-occupant Loans on < 5 Family Dwellings (A B C & D)
Number
Average Value
Number
Average Value
Number
Average Value
Number
Average Value
Number
Average Value
Number
Average Value
LOANS ORIGINATED
272
$207,994
283
$182,388
914
$141,859
124
$35,122
4
$144,755
63
$132,093
APPLICATIONS APPROVED, NOT ACCEPTED
15
$187,949
49
$168,190
373
$126,999
44
$35,061
0
$0
14
$180,774
APPLICATIONS DENIED
53
$207,923
92
$177,392
812
$131,203
244
$24,408
4
$246,975
53
$121,282
APPLICATIONS WITHDRAWN
97
$215,149
69
$193,548
657
$131,151
67
$30,878
2
$289,790
15
$142,441
FILES CLOSED FOR INCOMPLETENESS
5
$205,154
4
$208,270
131
$141,837
8
$13,081
0
$0
3
$52,783
Aggregated Statistics For Year 2000 (Based on 20 full and 12 partial tracts)
A) FHA, FSA/RHS & VA Home Purchase Loans
B) Conventional Home Purchase Loans
C) Refinancings
D) Home Improvement Loans
E) Loans on Dwellings For 5+ Families
F) Non-occupant Loans on < 5 Family Dwellings (A B C & D)
Number
Average Value
Number
Average Value
Number
Average Value
Number
Average Value
Number
Average Value
Number
Average Value
LOANS ORIGINATED
311
$191,797
227
$156,659
445
$110,411
140
$22,058
0
$0
39
$104,845
APPLICATIONS APPROVED, NOT ACCEPTED
20
$199,076
46
$165,127
149
$113,646
123
$29,630
0
$0
11
$81,598
APPLICATIONS DENIED
49
$199,449
148
$403,077
745
$101,918
373
$23,562
2
$111,460
32
$126,436
APPLICATIONS WITHDRAWN
108
$197,338
61
$482,269
681
$101,231
45
$32,588
0
$0
24
$95,612
FILES CLOSED FOR INCOMPLETENESS
15
$175,134
25
$128,178
140
$141,442
7
$29,297
0
$0
7
$136,007
Aggregated Statistics For Year 1999 (Based on 12 full and 13 partial tracts)
A) FHA, FSA/RHS & VA Home Purchase Loans
B) Conventional Home Purchase Loans
C) Refinancings
D) Home Improvement Loans
E) Loans on Dwellings For 5+ Families
F) Non-occupant Loans on < 5 Family Dwellings (A B C & D)
2007 - 2018 National Fire Incident Reporting System (NFIRS) incidents
According to the data from the years 2007 - 2018 the average number of fire incidents per year is 170. The highest number of reported fires - 222 took place in 2015, and the least - 107 in 2007. The data has an increasing trend.
When looking into fire subcategories, the most reports belonged to: Structure Fires (77.1%), and Outside Fires (12.1%).
Fire incident types reported to NFIRS in Zip Code 11412


 Nearest zip codes: 11423, 11411, 11429, 11413, 11434, 11433.


 (Location: 109-89 204TH ST, Grades: 6-12)


 According to the data from the years 2007 - 2018 the average number of fire incidents per year is 170. The highest number of reported fires - 222 took place in 2015, and the least - 107 in 2007. The data has an increasing trend.
 When looking into fire subcategories, the most reports belonged to: Structure Fires (77.1%), and Outside Fires (12.1%).