Estimated zip code population in 2022: 44,120 Zip code population in 2010: 38,912 Zip code population in 2000: 39,827
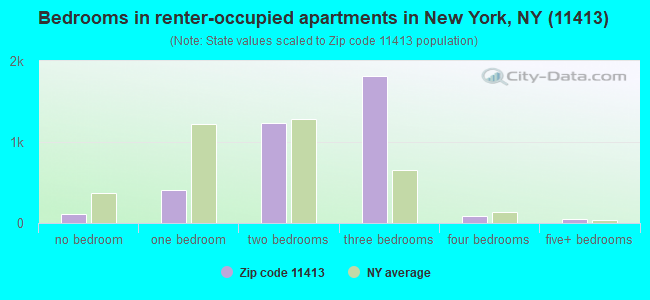
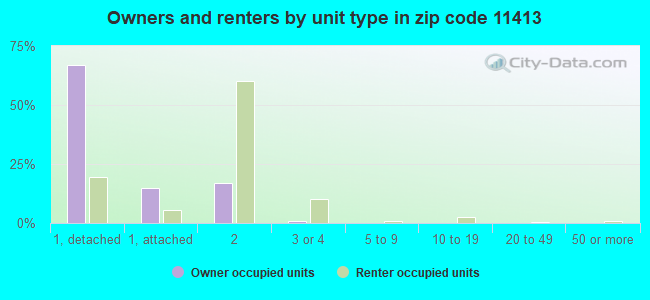
Houses and condos: 14,381 Renter-occupied apartments: 3,723
% of renters here:
27%
State:
46%
March 2022 cost of living index in zip code 11413: 146.9 (very high, U.S. average is 100)
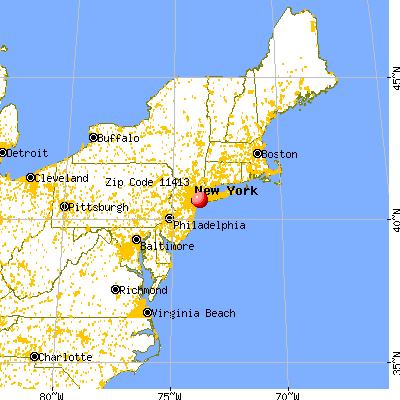
Land area: 3.1 sq. mi. Water area: 0.0 sq. mi.
Population density: 14,233 people per square mile
(very high).
OSM Map
General Map
Google Map
MSN Map
OSM Map
General Map
Google Map
MSN Map
OSM Map
General Map
Google Map
MSN Map
OSM Map
General Map
Google Map
MSN Map
Please wait while loading the map...
Real estate property taxes paid for housing units in 2022:
This zip code:
0.8% ($4,874)
New York:
1.5% ($6,180)
Median real estate property taxes paid for housing units with mortgages in 2022: $4,887 (0.7%) Median real estate property taxes paid for housing units with no mortgage in 2022: $4,890 (0.8%)
Business Search- 14 Million verified businesses
Males: 19,829
(44.9%)
Females: 24,290
(55.1%)
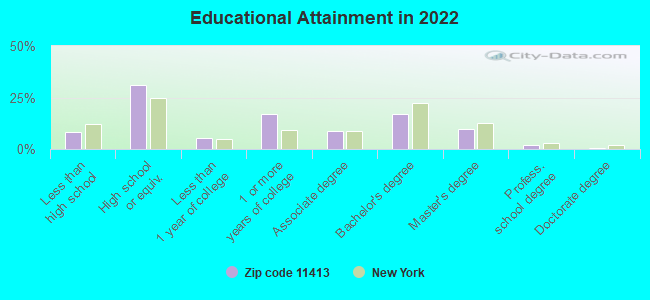
For population 25 years and over in 11413:
High school or higher: 91.1%
Bachelor's degree or higher: 29.5%
Graduate or professional degree: 12.5%
Unemployed: 4.2%
Mean travel time to work (commute): 47.1 minutes
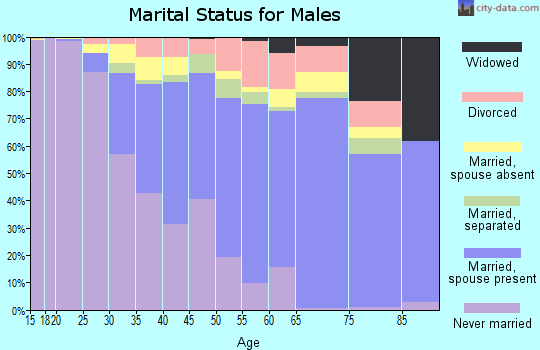
For population 15 years and over in 11413:
Never married: 43.8%
Now married: 37.8%
Separated: 3.4%
Widowed: 5.7%
Divorced: 9.3%
Zip code 11413 compared to state average:
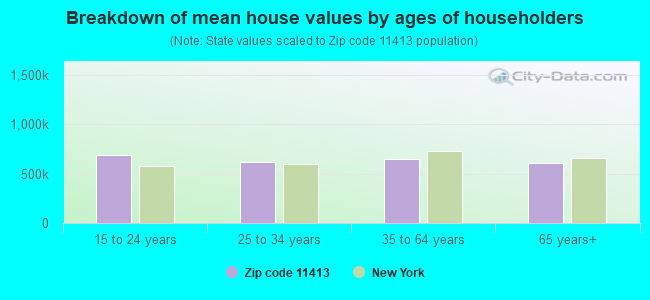
Median house value above state average.
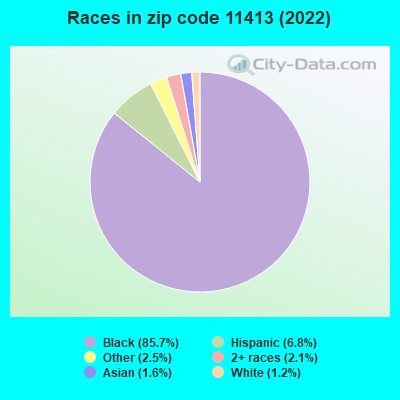
Black race population percentage significantly above state average.
Hispanic race population percentage below state average.
Foreign-born population percentage above state average.
Renting percentage below state average.
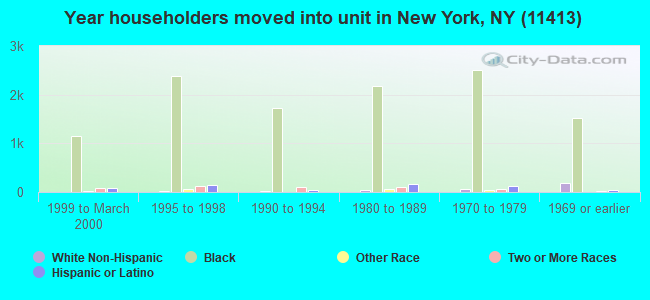
Length of stay since moving in significantly above state average.
Estimated median house/condo value in 2022: $638,701
11413:
$638,701
New York:
$400,400
According to our research of New York and other state lists, there were 32 registered sex offenders living in 11413 zip code as of May 16, 2024. The ratio of all residents to sex offenders in zip code 11413 is 1,353 to 1. The ratio of registered sex offenders to all residents in this zip code is lower than the state average.
Median resident age:
This zip code:
41.0 years
New York median age:
40.0 years
Average household size:
This zip code:
3.2 people
New York:
2.5 people
Averages for the 2020 tax year for zip code 11413, filed in 2021:
Average Adjusted Gross Income (AGI) in 2020: $53,744 (Individual Income Tax Returns)
Here:
$53,744
State:
$90,930
Salary/wage: $51,523 (reported on 83.3% of returns)
Here:
$51,523
State:
$72,104
(% of AGI for various income ranges: 1077.4% for AGIs below $25k, 3722.9% for AGIs $25k-50k, 6748.2% for AGIs $50k-75k, 9949.1% for AGIs $75k-100k, 17323.3% for AGIs $100k-200k, 68549.1% for AGIs over 200k)
Taxable interest for individuals: $397 (reported on 24.0% of returns)
This zip code:
$397
New York:
$3,075
(% of AGI for various income ranges: 4.8% for AGIs below $25k, 5.2% for AGIs $25k-50k, 11.0% for AGIs $50k-75k, 20.9% for AGIs $75k-100k, 46.6% for AGIs $100k-200k, 196.4% for AGIs over 200k)
Ordinary dividends: $1,451 (reported on 8.3% of returns)
Here:
$1,451
State:
$11,095
(% of AGI for various income ranges: 3.9% for AGIs below $25k, 4.5% for AGIs $25k-50k, 13.1% for AGIs $50k-75k, 23.3% for AGIs $75k-100k, 70.1% for AGIs $100k-200k, 350.9% for AGIs over 200k)
Net capital gain/loss in AGI: +$3,662 (reported on 8.1% of returns)
Here:
+$3,662
State:
+$44,925
(% of AGI for various income ranges: 1.8% for AGIs below $25k, 2.1% for AGIs $25k-50k, 23.7% for AGIs $50k-75k, 27.1% for AGIs $75k-100k, 102.6% for AGIs $100k-200k, 3310.9% for AGIs over 200k)
Profit/loss from business: +$3,323 (reported on 17.2% of returns)
Here:
+$3,323
State:
+$14,940
(% of AGI for various income ranges: 151.0% for AGIs below $25k, 38.3% for AGIs $25k-50k, 5.1% for AGIs $50k-75k, 40.4% for AGIs $75k-100k, 120.2% for AGIs $100k-200k, 545.5% for AGIs over 200k)
Taxable individual retirement arrangement distribution: $13,155 (reported on 3.5% of returns)
11413:
$13,155
New York:
$19,609
(% of AGI for various income ranges: 19.0% for AGIs below $25k, 26.1% for AGIs $25k-50k, 51.3% for AGIs $50k-75k, 87.6% for AGIs $75k-100k, 205.4% for AGIs $100k-200k, 1499.1% for AGIs over 200k)
Total itemized deductions: $27,168 (reported on 17.1% of returns)
Here:
$27,168
State:
$39,326
(% of AGI for various income ranges: 73.7% for AGIs below $25k, 218.4% for AGIs $25k-50k, 740.3% for AGIs $50k-75k, 1419.9% for AGIs $75k-100k, 2331.6% for AGIs $100k-200k, 6300.9% for AGIs over 200k)
Charity contributions: $5,978 (reported on 14.0% of returns)
Here:
$5,978
State:
$15,420
(% of AGI for various income ranges: 6.4% for AGIs below $25k, 28.3% for AGIs $25k-50k, 110.4% for AGIs $50k-75k, 259.1% for AGIs $75k-100k, 470.1% for AGIs $100k-200k, 1767.3% for AGIs over 200k)
Taxes paid: $8,613 (reported on 17.1% of returns)
11413:
$8,613
State:
$9,183
(% of AGI for various income ranges: 20.0% for AGIs below $25k, 63.3% for AGIs $25k-50k, 233.7% for AGIs $50k-75k, 467.2% for AGIs $75k-100k, 772.5% for AGIs $100k-200k, 1638.2% for AGIs over 200k)
Earned income credit: $1,948 (reported on 17.1% of returns)
Here:
$1,948
State:
$2,138
(% of AGI for various income ranges: 91.8% for AGIs below $25k, 56.0% for AGIs $25k-50k)
Percentage of individuals using paid preparers for their 2020 taxes: 93.8%
Here:
94%
State:
95%
(% for various income ranges: 91.9% for AGIs below $25k, 95.6% for AGIs $25k-50k, 94.2% for AGIs $50k-75k, 93.8% for AGIs $75k-100k, 94.0% for AGIs $100k-200k, 94.6% for AGIs over 200k)
Averages for the 2012 tax year for zip code 11413, filed in 2013:
Average Adjusted Gross Income (AGI) in 2012: $44,569 (Individual Income Tax Returns)
Here:
$44,569
State:
$77,088
Salary/wage: $43,540 (reported on 84.7% of returns)
Here:
$43,540
State:
$60,593
(% of AGI for various income ranges: 72.4% for AGIs below $25k, 86.4% for AGIs $25k-50k, 84.8% for AGIs $50k-75k, 86.1% for AGIs $75k-100k, 81.3% for AGIs $100k-200k, 73.3% for AGIs over 200k)
Taxable interest for individuals: $394 (reported on 25.6% of returns)
This zip code:
$394
New York:
$3,125
(% of AGI for various income ranges: 0.3% for AGIs below $25k, 0.2% for AGIs $25k-50k, 0.2% for AGIs $50k-75k, 0.2% for AGIs $75k-100k, 0.2% for AGIs $100k-200k, 0.3% for AGIs over 200k)
Ordinary dividends: $1,589 (reported on 8.6% of returns)
Here:
$1,589
State:
$10,299
(% of AGI for various income ranges: 0.3% for AGIs below $25k, 0.6% for AGIs $25k-50k, 0.2% for AGIs $50k-75k, 0.2% for AGIs $75k-100k, 0.3% for AGIs $100k-200k, 0.3% for AGIs over 200k)
Net capital gain/loss in AGI: +$747 (reported on 5.8% of returns)
Here:
+$747
State:
+$42,474
(% of AGI for various income ranges: 2.4% for AGIs over 200k)
Profit/loss from business: +$5,451 (reported on 13.8% of returns)
Here:
+$5,451
State:
+$16,168
(% of AGI for various income ranges: 11.8% for AGIs below $25k, 0.7% for AGIs $25k-50k, 0.5% for AGIs $50k-75k, 0.4% for AGIs $100k-200k)
Taxable individual retirement arrangement distribution: $10,955 (reported on 4.3% of returns)
11413:
$10,955
New York:
$17,621
(% of AGI for various income ranges: 1.1% for AGIs below $25k, 0.8% for AGIs $25k-50k, 0.8% for AGIs $50k-75k, 1.1% for AGIs $75k-100k, 1.7% for AGIs $100k-200k)
Total itemized deductions: $22,513 (32% of AGI, reported on 42.6% of returns)
Here:
$22,513
State:
$34,985
Here:
31.6% of AGI
State:
21.3% of AGI
(% of AGI for various income ranges: 10.3% for AGIs below $25k, 18.5% for AGIs $25k-50k, 24.3% for AGIs $50k-75k, 25.6% for AGIs $75k-100k, 24.1% for AGIs $100k-200k, 20.9% for AGIs over 200k)
Charity contributions: $3,835 (reported on 37.4% of returns)
Here:
$3,835
State:
$5,572
(% of AGI for various income ranges: 1.2% for AGIs below $25k, 2.9% for AGIs $25k-50k, 3.7% for AGIs $50k-75k, 3.7% for AGIs $75k-100k, 3.6% for AGIs $100k-200k, 3.3% for AGIs over 200k)
Taxes paid: $7,707 (reported on 42.5% of returns)
11413:
$7,707
State:
$18,656
(% of AGI for various income ranges: 2.1% for AGIs below $25k, 4.8% for AGIs $25k-50k, 8.0% for AGIs $50k-75k, 9.5% for AGIs $75k-100k, 9.7% for AGIs $100k-200k, 9.3% for AGIs over 200k)
Earned income credit: $2,178 (reported on 23.4% of returns)
Here:
$2,178
State:
$2,230
(% of AGI for various income ranges: 8.3% for AGIs below $25k, 1.0% for AGIs $25k-50k)
Percentage of individuals using paid preparers for their 2012 taxes: 70.7%
Here:
71%
State:
66%
(% for various income ranges: 68.2% for AGIs below $25k, 70.3% for AGIs $25k-50k, 73.5% for AGIs $50k-75k, 73.4% for AGIs $75k-100k, 74.8% for AGIs $100k-200k, 76.9% for AGIs over 200k)
Averages for the 2004 tax year for zip code 11413, filed in 2005:
Average Adjusted Gross Income (AGI) in 2004: $39,320 (Individual Income Tax Returns)
Here:
$39,320
State:
$59,519
Salary/wage: $38,803 (reported on 87.5% of returns)
Here:
$38,803
State:
$50,673
(% of AGI for various income ranges: 84.5% for AGIs below $10k, 80.4% for AGIs $10k-25k, 90.2% for AGIs $25k-50k, 88.0% for AGIs $50k-75k, 86.6% for AGIs $75k-100k, 81.0% for AGIs over 100k)
Taxable interest for individuals: $536 (reported on 39.2% of returns)
This zip code:
$536
New York:
$2,377
(% of AGI for various income ranges: 1.9% for AGIs below $10k, 0.7% for AGIs $10k-25k, 0.4% for AGIs $25k-50k, 0.5% for AGIs $50k-75k, 0.6% for AGIs $75k-100k, 0.5% for AGIs over 100k)
Taxable dividends: $650 (reported on 11.6% of returns)
Here:
$650
State:
$5,394
(% of AGI for various income ranges: 0.4% for AGIs below $10k, 0.3% for AGIs $10k-25k, 0.1% for AGIs $25k-50k, 0.2% for AGIs $50k-75k, 0.2% for AGIs $75k-100k, 0.3% for AGIs over 100k)
Net capital gain/loss: +$4,016 (reported on 6.8% of returns)
Here:
+$4,016
State:
+$23,581
(% of AGI for various income ranges: -0.6% for AGIs below $10k, -0.1% for AGIs $10k-25k, 0.0% for AGIs $25k-50k, 0.2% for AGIs $50k-75k, 0.3% for AGIs $75k-100k, 3.6% for AGIs over 100k)
Profit/loss from business: +$4,869 (reported on 11.5% of returns)
Here:
+$4,869
State:
+$13,809
(% of AGI for various income ranges: 20.2% for AGIs below $10k, 6.1% for AGIs $10k-25k, 0.6% for AGIs $25k-50k, 0.5% for AGIs $50k-75k, 0.3% for AGIs $75k-100k, 0.4% for AGIs over 100k)
IRA payment deduction: $2,154 (reported on 1.4% of returns)
11413:
$2,154
New York:
$3,115
(% of AGI for various income ranges: 0.2% for AGIs $10k-25k, 0.1% for AGIs $25k-50k, 0.0% for AGIs $50k-75k, 0.1% for AGIs $75k-100k, 0.1% for AGIs over 100k)
Total itemized deductions: $20,713 (36% of AGI, reported on 49.6% of returns)
Here:
$20,713
State:
$25,864
Here:
36.0% of AGI
State:
21.9% of AGI
(% of AGI for various income ranges: 15.7% for AGIs below $10k, 17.3% for AGIs $10k-25k, 25.8% for AGIs $25k-50k, 30.7% for AGIs $50k-75k, 28.6% for AGIs $75k-100k, 24.3% for AGIs over 100k)
Charity contributions deductions: $3,833 (6% of AGI, reported on 46.0% of returns)
Here:
$3,833
State:
$4,439
Here:
6.5% of AGI
State:
3.6% of AGI
(% of AGI for various income ranges: 1.0% for AGIs below $10k, 2.4% for AGIs $10k-25k, 4.5% for AGIs $25k-50k, 5.3% for AGIs $50k-75k, 5.0% for AGIs $75k-100k, 4.4% for AGIs over 100k)
Total tax: $4,173 (reported on 71.7% of returns)
11413:
$4,173
State:
$11,730
(% of AGI for various income ranges: 3.6% for AGIs below $10k, 3.2% for AGIs $10k-25k, 5.0% for AGIs $25k-50k, 7.8% for AGIs $50k-75k, 9.5% for AGIs $75k-100k, 13.3% for AGIs over 100k)
Earned income credit: $1,692 (reported on 20.2% of returns)
Here:
$1,692
State:
$1,757
Percentage of individuals using paid preparers for their 2004 taxes: 69.6%
Here:
70%
State:
67%
(% for various income ranges: 62.9% for AGIs below $10k, 71.2% for AGIs $10k-25k, 70.3% for AGIs $25k-50k, 70.9% for AGIs $50k-75k, 70.3% for AGIs $75k-100k, 72.7% for AGIs over 100k)
Likely homosexual households (counted as self-reported same-sex unmarried-partner households)
Lesbian couples: 0.0% of all households
Gay men: 0.2% of all households
Household received Food Stamps/SNAP in the past 12 months: 1,817 Household did not receive Food Stamps/SNAP in the past 12 months: 11,945
Women who had a birth in the past 12 months: 282 (154 now married, 130 unmarried) Women who did not have a birth in the past 12 months: 10,945 (2,945 now married, 8,049 unmarried)
Housing units in zip code 11413 with a mortgage: 7,217 (729 second mortgage, 20 home equity loan, 481 both second mortgage and home equity loan) Houses without a mortgage: 107
Median monthly owner costs for units with a mortgage: $2,872 Median monthly owner costs for units without a mortgage: $1,002
Residents with income below the poverty level in 2022:
This zip code:
6.4%
Whole state:
14.3%
Residents with income below 50% of the poverty level in 2022:
This zip code:
2.6%
Whole state:
6.8%
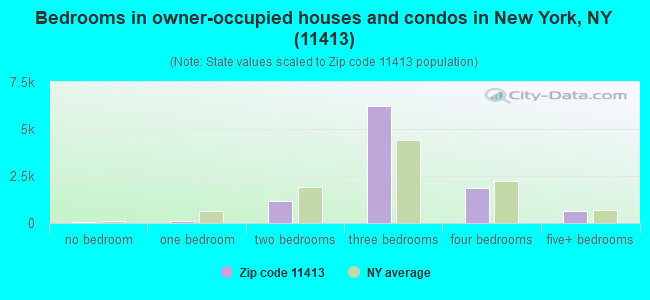
Median number of rooms in houses and condos:
Here:
5.8
State:
6.3
Median number of rooms in apartments:
Here:
4.7
State:
3.8
Notable locations in this zip code not listed on our city pages
Notable locations in zip code 11413: Laurelton Branch Queens Borough Public Library (A), Fire Department New York Engine 311 Ladder 158 (B), New York Ladder Company 158 (C), Fire Department New York Engine 314 (D). Display/hide their locations on the map
Churches in zip code 11413 include: Saint Luke Baptist Church (A), Linden Seventh Day Adventist Church (B), Lebanon Seventh Day Adventist Church (C), Epiphany Lutheran Church (D), Saint Mary Magdalenes Catholic Church (E), Grace Moravian Church (F), First Presbyterian Church (G), Springfield Cemetery Chapel (H), Winners Church (I). Display/hide their locations on the map
Parks in zip code 11413 include: Springfield Park (1), Locust Manor Playground (2), Montauk Memorial Triangle (3), Montbellier Park (4), Junior High School 231 Playground (5), Mentone Playground (6), Brookville Park (7). Display/hide their locations on the map
3,454 married couples with children.
2,953 single-parent households (489 men, 2,464 women).
85.7% of residents of 11413 zip code speak English at home.
4.2% of residents speak Spanish at home (64% very well, 25% well, 9% not well, 2% not at all).
7.1% of residents speak other Indo-European language at home (53% very well, 29% well, 15% not well, 3% not at all).
0.3% of residents speak Asian or Pacific Island language at home (55% very well, 32% well, 13% not well).
2.4% of residents speak other language at home (77% very well, 18% well, 5% not well).
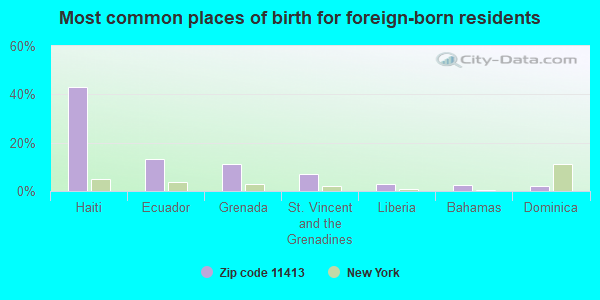
Foreign born population: 17,402 (39.4%) (77.3% of them are naturalized citizens)
This zip code:
39.4%
Whole state:
22.7%
43%Haiti
13%Ecuador
11%Grenada
7%St. Vincent and the Grenadines
3%Liberia
3%Bahamas
2%Dominica
25%Jamaican
7%Haitian
6%West Indian
4%American
4%Guyanese
2%Nigerian
2%Trinidadian and Tobagonian
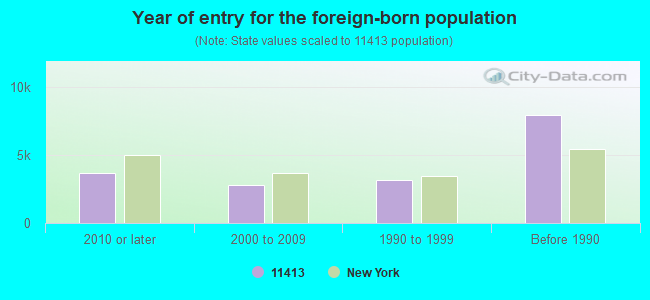
Year of entry for the foreign-born population
3,6642010 or later
2,8312000 to 2009
3,1571990 to 1999
7,961Before 1990
Major facilities with environmental interests located in this zip code:
CROSS COUNTY RECYCLING (12252 MONTAUK STREET in SPRINGFIELD GARDENS, NY)
(Integrated Compliance Information System) - ICIS-02-2000-7902, FORMAL ENFORCEMENT ACTION (Resource Conservation and Recovery Act (tracking hazardous waste)) Business SIC classification: REFUSE SYSTEMS
BETTER BODY AUTO-123-40 MERRICK BLVD (123-40 MERRICK BLVD in SPRINGFIELD GARDENS, NY)
STATE MASTER (New York facility tracking) - AIR PROGRAM Conditionally Exempt Small Quantity Generators, less than 100 kg/month of hazardous waste (Resource Conservation and Recovery Act (tracking hazardous waste)) - notification Organizations: BETTER BODY AUTO COLLISION INC (CONTACT/OWNER)
Alternative names: BETTER BODY AUTO COLLISION INC
IS 59 SPRINGFIELD GARDENS SCHOOL ( in SPRINGFIELD GARDENS, NY)
(National Center for Education Statistics) - STATE ID-342900010059 Organizations: NEW YORK CITY PUBLIC SCHOOLS (SCHOOL DISTRICT)
IS 231 TRI-COMMUNITY SCHOOL ( in SPRINGFIELD GARDENS, NY)
(National Center for Education Statistics) - STATE ID-342900010231 Organizations: NEW YORK CITY PUBLIC SCHOOLS (SCHOOL DISTRICT)
ARANYA AUTOMOTIVE SERVICE (224-01 N CONDUIT AVE in LAURELTON, NY)
(Integrated Compliance Information System) - ICIS-02-1999-7916, FORMAL ENFORCEMENT ACTION Business SIC classification: GASOLINE SERVICE STATIONS
BERTIES SERVICE STATION (131-35 SPRINGFIELD BLVD in SPRINGFIELD GARDENS, NY)
(Integrated Compliance Information System) - ICIS-02-2002-7916, FORMAL ENFORCEMENT ACTION Business SIC classification: GASOLINE SERVICE STATIONS
CON EDISION - TM6010 (127 AVE. S 56 W. MERRICK BLVD. in SPRINGFIELD GARDENS, NY)
HAZARDOUS WASTE BIENNIAL REPORTER (Resource Conservation and Recovery Act (tracking hazardous waste)) Large Quantity Generators, more that 1000 kg of hazardous waste/month (Resource Conservation and Recovery Act (tracking hazardous waste)) Business NAICS classification: ELECTRIC POWER DISTRIBUTION.
CON EDISION - TRF 7146 (198 ST W36N MURDOCK ST 198 ST in SPRINGFIELD GARDENS, NY)
HAZARDOUS WASTE BIENNIAL REPORTER (Resource Conservation and Recovery Act (tracking hazardous waste)) Large Quantity Generators, more that 1000 kg of hazardous waste/month (Resource Conservation and Recovery Act (tracking hazardous waste)) Business NAICS classification: ELECTRIC POWER DISTRIBUTION.
CON EDISION - V8040 (FARMS BLVD. E 90 N 113 RD. FAR in SPRINGFIELD GARDENS, NY)
HAZARDOUS WASTE BIENNIAL REPORTER (Resource Conservation and Recovery Act (tracking hazardous waste)) Large Quantity Generators, more that 1000 kg of hazardous waste/month (Resource Conservation and Recovery Act (tracking hazardous waste)) Business NAICS classification: ELECTRIC POWER DISTRIBUTION.
CON EDISION - VS 2240 (213 ST E43N 86 AVE 213 ST E43N in SPRINGFIELD GARDENS, NY)
HAZARDOUS WASTE BIENNIAL REPORTER (Resource Conservation and Recovery Act (tracking hazardous waste)) Large Quantity Generators, more that 1000 kg of hazardous waste/month (Resource Conservation and Recovery Act (tracking hazardous waste)) Business NAICS classification: ELECTRIC POWER DISTRIBUTION.
CON EDISION - VS 9219 (222 ST W20N 97 AVE 222 ST W20N in SPRINGFIELD GARDENS, NY)
HAZARDOUS WASTE BIENNIAL REPORTER (Resource Conservation and Recovery Act (tracking hazardous waste)) Large Quantity Generators, more that 1000 kg of hazardous waste/month (Resource Conservation and Recovery Act (tracking hazardous waste)) Business NAICS classification: ELECTRIC POWER DISTRIBUTION.
CON ED - V 1805 (F/O 135-02 SPRINGFIELD BLVD in JAMAICA, NY)
HAZARDOUS WASTE BIENNIAL REPORTER (Resource Conservation and Recovery Act (tracking hazardous waste)) (Resource Conservation and Recovery Act (tracking hazardous waste))
GETTY PETROLEUM CORP (211-02 JAMAICA AVE in SPRINGFIELD GARDENS, NY)
(Resource Conservation and Recovery Act (tracking hazardous waste))
Housing units lacking complete plumbing facilities: 0.8% Housing units lacking complete kitchen facilities: 1.1%
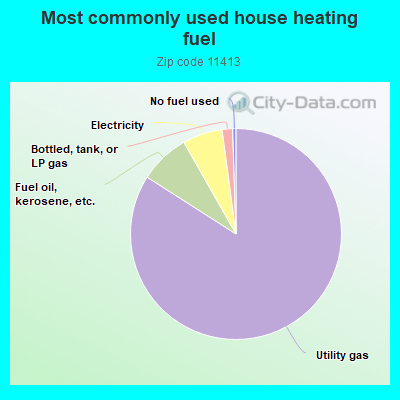
83.9%Utility gas
7.7%Fuel oil, kerosene, etc.
6.1%Electricity
1.6%Bottled, tank, or LP gas
0.5%No fuel used
Population in 1990: 36,679. Population change in the 1990s: +3,148 (+8.6%).
Place of birth for U.S.-born residents:
This state: 22,994
Northeast: 415
Midwest: 135
South: 2,496
West: 178
75% of the 11413 zip code residents lived in the same house 5 years ago. Out of people who lived in different houses, 60% lived in this county. Out of people who lived in different counties, 50% lived in New York.
95% of the 11413 zip code residents lived in the same house 1 year ago. Out of people who lived in different houses, 45% moved from this county. Out of people who lived in different houses, 40% moved from different county within same state. Out of people who lived in different houses, 4% moved from different state. Out of people who lived in different houses, 11% moved from abroad.
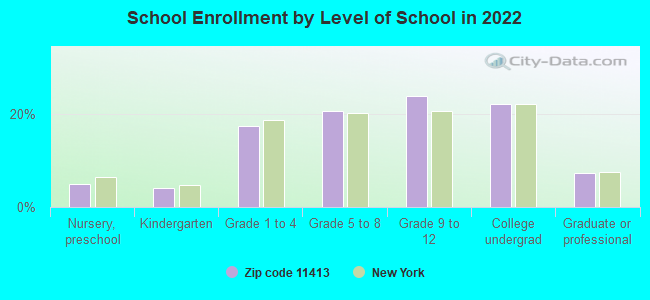
Private vs. public school enrollment:
Students in private schools in grades 1 to 8 (elementary and middle school): 560
Here:
13.9%
New York:
15.6%
Students in private schools in grades 9 to 12 (high school): 404
Here:
16.1%
New York:
15.0%
Students in private undergraduate colleges: 486
Here:
21.1%
New York:
39.2%
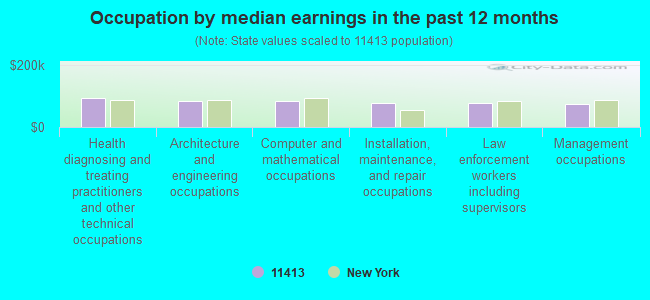
Occupation by median earnings in the past 12 months ($)
95,160Health diagnosing and treating practitioners and other technical occupations
85,474Architecture and engineering occupations
82,925Computer and mathematical occupations
79,431Installation, maintenance, and repair occupations
76,653Law enforcement workers including supervisors
74,489Management occupations
Top industries in this zip code by the number of employees in 2005:
Health Care and Social Assistance: Home Health Care Services (500-999 employees: 1 establishment, 100-249 employees: 1 establishment)
Wholesale Trade: Motor Vehicle Supplies and New Parts Merchant Wholesalers (250-499: 1)
Educational Services: Elementary and Secondary Schools (100-249: 1, 10-19: 2)
Administrative and Support and Waste Management and Remediation Services: Security Guards and Patrol Services (100-249: 1, 1-4: 1)
2007 - 2018 National Fire Incident Reporting System (NFIRS) incidents
According to the data from the years 2007 - 2018 the average number of fire incidents per year is 210. The highest number of reported fires - 260 took place in 2017, and the least - 103 in 2007. The data has an increasing trend.
When looking into fire subcategories, the most reports belonged to: Structure Fires (72.6%), and Mobile Property/Vehicle Fires (12.6%).
Fire incident types reported to NFIRS in Zip Code 11413


 Nearest zip codes: 11422, 11434, 11412, 11411, 11429, 11430.


 According to the data from the years 2007 - 2018 the average number of fire incidents per year is 210. The highest number of reported fires - 260 took place in 2017, and the least - 103 in 2007. The data has an increasing trend.
 When looking into fire subcategories, the most reports belonged to: Structure Fires (72.6%), and Mobile Property/Vehicle Fires (12.6%).