Estimated zip code population in 2022: 38,140
Zip code population in 2010: 37,280
Zip code population in 2000: 39,582
Houses and condos: 18,405
Renter-occupied apartments: 5,972
% of renters here:
37%State:
46%
March 2022 cost of living index in zip code 11561: 151.4
(very high, U.S. average is 100)
Land area: 3.9
sq. mi.
Water area: 0.4
sq. mi.
Population density: 9,780 people per square mile (high).
OSM Map
General Map
Google Map
MSN Map
OSM Map
General Map
Google Map
MSN Map
OSM Map
General Map
Google Map
MSN Map
OSM Map
General Map
Google Map
MSN Map
Please wait while loading the map...
Real estate property taxes paid for housing units in 2022:
This zip code:
1.5% ($9,805)New York:
1.5% ($6,180)
Median real estate property taxes paid for housing units with mortgages in 2022: $9,858 (1.4%)
Median real estate property taxes paid for housing units with no mortgage in 2022: $9,755 (1.5%)
Profiles of local businesses
Business Search - 14 Million verified businesses
Males: 19,534 Females: 18,605
For population 25 years and over in 11561:
High school or higher: 96.7%Bachelor's degree or higher: 53.8%Graduate or professional degree: 25.0%Unemployed: 3.4%Mean travel time to work (commute): 40.9 minutes
For population 15 years and over in 11561:
Never married: 34.9%Now married: 45.7%Separated: 2.0%Widowed: 6.3%Divorced: 11.1%
Zip code 11561 compared to state average:
Median household income above state average. Median house value above state average. Black race population percentage significantly below state average. Median age above state average. Foreign-born population percentage below state average. Length of stay since moving in significantly above state average. Percentage of population with a bachelor's degree or higher above state average. 28,234 74.0% White 5,339 14.0% Hispanic or Latino 1,675 4.4% Black 1,607 4.2% Asian 1,001 2.6% Two or more races 238 0.6% Some other race 38 0.10% American Indian 3 0.01% Native Hawaiian and Other
Data:
Median household income ($)
Median household income (% change since 2000)
Household income diversity
Ratio of average income to average house value (%)
Ratio of average income to average rent
Median household income ($) - White
Median household income ($) - Black or African American
Median household income ($) - Asian
Median household income ($) - Hispanic or Latino
Median household income ($) - American Indian and Alaska Native
Median household income ($) - Multirace
Median household income ($) - Other Race
Median household income for houses/condos with a mortgage ($)
Median household income for apartments without a mortgage ($)
Races - White alone (%)
Races - White alone (% change since 2000)
Races - Black alone (%)
Races - Black alone (% change since 2000)
Races - American Indian alone (%)
Races - American Indian alone (% change since 2000)
Races - Asian alone (%)
Races - Asian alone (% change since 2000)
Races - Hispanic (%)
Races - Hispanic (% change since 2000)
Races - Native Hawaiian and Other Pacific Islander alone (%)
Races - Native Hawaiian and Other Pacific Islander alone (% change since 2000)
Races - Two or more races (%)
Races - Two or more races (% change since 2000)
Races - Other race alone (%)
Races - Other race alone (% change since 2000)
Racial diversity
Unemployment (%)
Unemployment (% change since 2000)
Unemployment (%) - White
Unemployment (%) - Black or African American
Unemployment (%) - Asian
Unemployment (%) - Hispanic or Latino
Unemployment (%) - American Indian and Alaska Native
Unemployment (%) - Multirace
Unemployment (%) - Other Race
Population density (people per square mile)
Population - Males (%)
Population - Females (%)
Population - Males (%) - White
Population - Males (%) - Black or African American
Population - Males (%) - Asian
Population - Males (%) - Hispanic or Latino
Population - Males (%) - American Indian and Alaska Native
Population - Males (%) - Multirace
Population - Males (%) - Other Race
Population - Females (%) - White
Population - Females (%) - Black or African American
Population - Females (%) - Asian
Population - Females (%) - Hispanic or Latino
Population - Females (%) - American Indian and Alaska Native
Population - Females (%) - Multirace
Population - Females (%) - Other Race
Coronavirus confirmed cases (May 15, 2024)
Deaths caused by coronavirus (May 15, 2024)
Coronavirus confirmed cases (per 100k population) (May 15, 2024)
Deaths caused by coronavirus (per 100k population) (May 15, 2024)
Daily increase in number of cases (May 15, 2024)
Weekly increase in number of cases (May 15, 2024)
Cases doubled (in days) (May 15, 2024)
Hospitalized patients (Apr 18, 2022)
Negative test results (Apr 18, 2022)
Total test results (Apr 18, 2022)
COVID Vaccine doses distributed (per 100k population) (Sep 19, 2023)
COVID Vaccine doses administered (per 100k population) (Sep 19, 2023)
COVID Vaccine doses distributed (Sep 19, 2023)
COVID Vaccine doses administered (Sep 19, 2023)
Likely homosexual households (%)
Likely homosexual households (% change since 2000)
Likely homosexual households - Lesbian couples (%)
Likely homosexual households - Lesbian couples (% change since 2000)
Likely homosexual households - Gay men (%)
Likely homosexual households - Gay men (% change since 2000)
Cost of living index
Median gross rent ($)
Median contract rent ($)
Median monthly housing costs ($)
Median house or condo value ($)
Median house or condo value ($ change since 2000)
Mean house or condo value by units in structure - 1, detached ($)
Mean house or condo value by units in structure - 1, attached ($)
Mean house or condo value by units in structure - 2 ($)
Mean house or condo value by units in structure by units in structure - 3 or 4 ($)
Mean house or condo value by units in structure - 5 or more ($)
Mean house or condo value by units in structure - Boat, RV, van, etc. ($)
Mean house or condo value by units in structure - Mobile home ($)
Median house or condo value ($) - White
Median house or condo value ($) - Black or African American
Median house or condo value ($) - Asian
Median house or condo value ($) - Hispanic or Latino
Median house or condo value ($) - American Indian and Alaska Native
Median house or condo value ($) - Multirace
Median house or condo value ($) - Other Race
Median resident age
Resident age diversity
Median resident age - Males
Median resident age - Females
Median resident age - White
Median resident age - Black or African American
Median resident age - Asian
Median resident age - Hispanic or Latino
Median resident age - American Indian and Alaska Native
Median resident age - Multirace
Median resident age - Other Race
Median resident age - Males - White
Median resident age - Males - Black or African American
Median resident age - Males - Asian
Median resident age - Males - Hispanic or Latino
Median resident age - Males - American Indian and Alaska Native
Median resident age - Males - Multirace
Median resident age - Males - Other Race
Median resident age - Females - White
Median resident age - Females - Black or African American
Median resident age - Females - Asian
Median resident age - Females - Hispanic or Latino
Median resident age - Females - American Indian and Alaska Native
Median resident age - Females - Multirace
Median resident age - Females - Other Race
Commute - mean travel time to work (minutes)
Travel time to work - Less than 5 minutes (%)
Travel time to work - Less than 5 minutes (% change since 2000)
Travel time to work - 5 to 9 minutes (%)
Travel time to work - 5 to 9 minutes (% change since 2000)
Travel time to work - 10 to 19 minutes (%)
Travel time to work - 10 to 19 minutes (% change since 2000)
Travel time to work - 20 to 29 minutes (%)
Travel time to work - 20 to 29 minutes (% change since 2000)
Travel time to work - 30 to 39 minutes (%)
Travel time to work - 30 to 39 minutes (% change since 2000)
Travel time to work - 40 to 59 minutes (%)
Travel time to work - 40 to 59 minutes (% change since 2000)
Travel time to work - 60 to 89 minutes (%)
Travel time to work - 60 to 89 minutes (% change since 2000)
Travel time to work - 90 or more minutes (%)
Travel time to work - 90 or more minutes (% change since 2000)
Marital status - Never married (%)
Marital status - Now married (%)
Marital status - Separated (%)
Marital status - Widowed (%)
Marital status - Divorced (%)
Median family income ($)
Median family income (% change since 2000)
Median non-family income ($)
Median non-family income (% change since 2000)
Median per capita income ($)
Median per capita income (% change since 2000)
Median family income ($) - White
Median family income ($) - Black or African American
Median family income ($) - Asian
Median family income ($) - Hispanic or Latino
Median family income ($) - American Indian and Alaska Native
Median family income ($) - Multirace
Median family income ($) - Other Race
Median year house/condo built
Median year apartment built
Year house built - Built 2005 or later (%)
Year house built - Built 2000 to 2004 (%)
Year house built - Built 1990 to 1999 (%)
Year house built - Built 1980 to 1989 (%)
Year house built - Built 1970 to 1979 (%)
Year house built - Built 1960 to 1969 (%)
Year house built - Built 1950 to 1959 (%)
Year house built - Built 1940 to 1949 (%)
Year house built - Built 1939 or earlier (%)
Average household size
Household density (households per square mile)
Average household size - White
Average household size - Black or African American
Average household size - Asian
Average household size - Hispanic or Latino
Average household size - American Indian and Alaska Native
Average household size - Multirace
Average household size - Other Race
Occupied housing units (%)
Vacant housing units (%)
Owner occupied housing units (%)
Renter occupied housing units (%)
Vacancy status - For rent (%)
Vacancy status - For sale only (%)
Vacancy status - Rented or sold, not occupied (%)
Vacancy status - For seasonal, recreational, or occasional use (%)
Vacancy status - For migrant workers (%)
Vacancy status - Other vacant (%)
Residents with income below the poverty level (%)
Residents with income below 50% of the poverty level (%)
Children below poverty level (%)
Poor families by family type - Married-couple family (%)
Poor families by family type - Male, no wife present (%)
Poor families by family type - Female, no husband present (%)
Poverty status for native-born residents (%)
Poverty status for foreign-born residents (%)
Poverty among high school graduates not in families (%)
Poverty among people who did not graduate high school not in families (%)
Residents with income below the poverty level (%) - White
Residents with income below the poverty level (%) - Black or African American
Residents with income below the poverty level (%) - Asian
Residents with income below the poverty level (%) - Hispanic or Latino
Residents with income below the poverty level (%) - American Indian and Alaska Native
Residents with income below the poverty level (%) - Multirace
Residents with income below the poverty level (%) - Other Race
Air pollution - Air Quality Index (AQI)
Air pollution - CO
Air pollution - NO2
Air pollution - SO2
Air pollution - Ozone
Air pollution - PM10
Air pollution - PM25
Air pollution - Pb
Crime - Murders per 100,000 population
Crime - Rapes per 100,000 population
Crime - Robberies per 100,000 population
Crime - Assaults per 100,000 population
Crime - Burglaries per 100,000 population
Crime - Thefts per 100,000 population
Crime - Auto thefts per 100,000 population
Crime - Arson per 100,000 population
Crime - City-data.com crime index
Crime - Violent crime index
Crime - Property crime index
Crime - Murders per 100,000 population (5 year average)
Crime - Rapes per 100,000 population (5 year average)
Crime - Robberies per 100,000 population (5 year average)
Crime - Assaults per 100,000 population (5 year average)
Crime - Burglaries per 100,000 population (5 year average)
Crime - Thefts per 100,000 population (5 year average)
Crime - Auto thefts per 100,000 population (5 year average)
Crime - Arson per 100,000 population (5 year average)
Crime - City-data.com crime index (5 year average)
Crime - Violent crime index (5 year average)
Crime - Property crime index (5 year average)
1996 Presidential Elections Results (%) - Democratic Party (Clinton)
1996 Presidential Elections Results (%) - Republican Party (Dole)
1996 Presidential Elections Results (%) - Other
2000 Presidential Elections Results (%) - Democratic Party (Gore)
2000 Presidential Elections Results (%) - Republican Party (Bush)
2000 Presidential Elections Results (%) - Other
2004 Presidential Elections Results (%) - Democratic Party (Kerry)
2004 Presidential Elections Results (%) - Republican Party (Bush)
2004 Presidential Elections Results (%) - Other
2008 Presidential Elections Results (%) - Democratic Party (Obama)
2008 Presidential Elections Results (%) - Republican Party (McCain)
2008 Presidential Elections Results (%) - Other
2012 Presidential Elections Results (%) - Democratic Party (Obama)
2012 Presidential Elections Results (%) - Republican Party (Romney)
2012 Presidential Elections Results (%) - Other
2016 Presidential Elections Results (%) - Democratic Party (Clinton)
2016 Presidential Elections Results (%) - Republican Party (Trump)
2016 Presidential Elections Results (%) - Other
2020 Presidential Elections Results (%) - Democratic Party (Biden)
2020 Presidential Elections Results (%) - Republican Party (Trump)
2020 Presidential Elections Results (%) - Other
Ancestries Reported - Arab (%)
Ancestries Reported - Czech (%)
Ancestries Reported - Danish (%)
Ancestries Reported - Dutch (%)
Ancestries Reported - English (%)
Ancestries Reported - French (%)
Ancestries Reported - French Canadian (%)
Ancestries Reported - German (%)
Ancestries Reported - Greek (%)
Ancestries Reported - Hungarian (%)
Ancestries Reported - Irish (%)
Ancestries Reported - Italian (%)
Ancestries Reported - Lithuanian (%)
Ancestries Reported - Norwegian (%)
Ancestries Reported - Polish (%)
Ancestries Reported - Portuguese (%)
Ancestries Reported - Russian (%)
Ancestries Reported - Scotch-Irish (%)
Ancestries Reported - Scottish (%)
Ancestries Reported - Slovak (%)
Ancestries Reported - Subsaharan African (%)
Ancestries Reported - Swedish (%)
Ancestries Reported - Swiss (%)
Ancestries Reported - Ukrainian (%)
Ancestries Reported - United States (%)
Ancestries Reported - Welsh (%)
Ancestries Reported - West Indian (%)
Ancestries Reported - Other (%)
Educational Attainment - No schooling completed (%)
Educational Attainment - Less than high school (%)
Educational Attainment - High school or equivalent (%)
Educational Attainment - Less than 1 year of college (%)
Educational Attainment - 1 or more years of college (%)
Educational Attainment - Associate degree (%)
Educational Attainment - Bachelor's degree (%)
Educational Attainment - Master's degree (%)
Educational Attainment - Professional school degree (%)
Educational Attainment - Doctorate degree (%)
School Enrollment - Nursery, preschool (%)
School Enrollment - Kindergarten (%)
School Enrollment - Grade 1 to 4 (%)
School Enrollment - Grade 5 to 8 (%)
School Enrollment - Grade 9 to 12 (%)
School Enrollment - College undergrad (%)
School Enrollment - Graduate or professional (%)
School Enrollment - Not enrolled in school (%)
School enrollment - Public schools (%)
School enrollment - Private schools (%)
School enrollment - Not enrolled (%)
Median number of rooms in houses and condos
Median number of rooms in apartments
Housing units lacking complete plumbing facilities (%)
Housing units lacking complete kitchen facilities (%)
Density of houses
Urban houses (%)
Rural houses (%)
Households with people 60 years and over (%)
Households with people 65 years and over (%)
Households with people 75 years and over (%)
Households with one or more nonrelatives (%)
Households with no nonrelatives (%)
Population in households (%)
Family households (%)
Nonfamily households (%)
Population in families (%)
Family households with own children (%)
Median number of bedrooms in owner occupied houses
Mean number of bedrooms in owner occupied houses
Median number of bedrooms in renter occupied houses
Mean number of bedrooms in renter occupied houses
Median number of vehichles in owner occupied houses
Mean number of vehichles in owner occupied houses
Median number of vehichles in renter occupied houses
Mean number of vehichles in renter occupied houses
Mortgage status - with mortgage (%)
Mortgage status - with second mortgage (%)
Mortgage status - with home equity loan (%)
Mortgage status - with both second mortgage and home equity loan (%)
Mortgage status - without a mortgage (%)
Average family size
Average family size - White
Average family size - Black or African American
Average family size - Asian
Average family size - Hispanic or Latino
Average family size - American Indian and Alaska Native
Average family size - Multirace
Average family size - Other Race
Geographical mobility - Same house 1 year ago (%)
Geographical mobility - Moved within same county (%)
Geographical mobility - Moved from different county within same state (%)
Geographical mobility - Moved from different state (%)
Geographical mobility - Moved from abroad (%)
Place of birth - Born in state of residence (%)
Place of birth - Born in other state (%)
Place of birth - Native, outside of US (%)
Place of birth - Foreign born (%)
Housing units in structures - 1, detached (%)
Housing units in structures - 1, attached (%)
Housing units in structures - 2 (%)
Housing units in structures - 3 or 4 (%)
Housing units in structures - 5 to 9 (%)
Housing units in structures - 10 to 19 (%)
Housing units in structures - 20 to 49 (%)
Housing units in structures - 50 or more (%)
Housing units in structures - Mobile home (%)
Housing units in structures - Boat, RV, van, etc. (%)
House/condo owner moved in on average (years ago)
Renter moved in on average (years ago)
Year householder moved into unit - Moved in 1999 to March 2000 (%)
Year householder moved into unit - Moved in 1995 to 1998 (%)
Year householder moved into unit - Moved in 1990 to 1994 (%)
Year householder moved into unit - Moved in 1980 to 1989 (%)
Year householder moved into unit - Moved in 1970 to 1979 (%)
Year householder moved into unit - Moved in 1969 or earlier (%)
Means of transportation to work - Drove car alone (%)
Means of transportation to work - Carpooled (%)
Means of transportation to work - Public transportation (%)
Means of transportation to work - Bus or trolley bus (%)
Means of transportation to work - Streetcar or trolley car (%)
Means of transportation to work - Subway or elevated (%)
Means of transportation to work - Railroad (%)
Means of transportation to work - Ferryboat (%)
Means of transportation to work - Taxicab (%)
Means of transportation to work - Motorcycle (%)
Means of transportation to work - Bicycle (%)
Means of transportation to work - Walked (%)
Means of transportation to work - Other means (%)
Working at home (%)
Industry diversity
Most Common Industries - Agriculture, forestry, fishing and hunting, and mining (%)
Most Common Industries - Agriculture, forestry, fishing and hunting (%)
Most Common Industries - Mining, quarrying, and oil and gas extraction (%)
Most Common Industries - Construction (%)
Most Common Industries - Manufacturing (%)
Most Common Industries - Wholesale trade (%)
Most Common Industries - Retail trade (%)
Most Common Industries - Transportation and warehousing, and utilities (%)
Most Common Industries - Transportation and warehousing (%)
Most Common Industries - Utilities (%)
Most Common Industries - Information (%)
Most Common Industries - Finance and insurance, and real estate and rental and leasing (%)
Most Common Industries - Finance and insurance (%)
Most Common Industries - Real estate and rental and leasing (%)
Most Common Industries - Professional, scientific, and management, and administrative and waste management services (%)
Most Common Industries - Professional, scientific, and technical services (%)
Most Common Industries - Management of companies and enterprises (%)
Most Common Industries - Administrative and support and waste management services (%)
Most Common Industries - Educational services, and health care and social assistance (%)
Most Common Industries - Educational services (%)
Most Common Industries - Health care and social assistance (%)
Most Common Industries - Arts, entertainment, and recreation, and accommodation and food services (%)
Most Common Industries - Arts, entertainment, and recreation (%)
Most Common Industries - Accommodation and food services (%)
Most Common Industries - Other services, except public administration (%)
Most Common Industries - Public administration (%)
Occupation diversity
Most Common Occupations - Management, business, science, and arts occupations (%)
Most Common Occupations - Management, business, and financial occupations (%)
Most Common Occupations - Management occupations (%)
Most Common Occupations - Business and financial operations occupations (%)
Most Common Occupations - Computer, engineering, and science occupations (%)
Most Common Occupations - Computer and mathematical occupations (%)
Most Common Occupations - Architecture and engineering occupations (%)
Most Common Occupations - Life, physical, and social science occupations (%)
Most Common Occupations - Education, legal, community service, arts, and media occupations (%)
Most Common Occupations - Community and social service occupations (%)
Most Common Occupations - Legal occupations (%)
Most Common Occupations - Education, training, and library occupations (%)
Most Common Occupations - Arts, design, entertainment, sports, and media occupations (%)
Most Common Occupations - Healthcare practitioners and technical occupations (%)
Most Common Occupations - Health diagnosing and treating practitioners and other technical occupations (%)
Most Common Occupations - Health technologists and technicians (%)
Most Common Occupations - Service occupations (%)
Most Common Occupations - Healthcare support occupations (%)
Most Common Occupations - Protective service occupations (%)
Most Common Occupations - Fire fighting and prevention, and other protective service workers including supervisors (%)
Most Common Occupations - Law enforcement workers including supervisors (%)
Most Common Occupations - Food preparation and serving related occupations (%)
Most Common Occupations - Building and grounds cleaning and maintenance occupations (%)
Most Common Occupations - Personal care and service occupations (%)
Most Common Occupations - Sales and office occupations (%)
Most Common Occupations - Sales and related occupations (%)
Most Common Occupations - Office and administrative support occupations (%)
Most Common Occupations - Natural resources, construction, and maintenance occupations (%)
Most Common Occupations - Farming, fishing, and forestry occupations (%)
Most Common Occupations - Construction and extraction occupations (%)
Most Common Occupations - Installation, maintenance, and repair occupations (%)
Most Common Occupations - Production, transportation, and material moving occupations (%)
Most Common Occupations - Production occupations (%)
Most Common Occupations - Transportation occupations (%)
Most Common Occupations - Material moving occupations (%)
People in Group quarters - Institutionalized population (%)
People in Group quarters - Correctional institutions (%)
People in Group quarters - Federal prisons and detention centers (%)
People in Group quarters - Halfway houses (%)
People in Group quarters - Local jails and other confinement facilities (including police lockups) (%)
People in Group quarters - Military disciplinary barracks (%)
People in Group quarters - State prisons (%)
People in Group quarters - Other types of correctional institutions (%)
People in Group quarters - Nursing homes (%)
People in Group quarters - Hospitals/wards, hospices, and schools for the handicapped (%)
People in Group quarters - Hospitals/wards and hospices for chronically ill (%)
People in Group quarters - Hospices or homes for chronically ill (%)
People in Group quarters - Military hospitals or wards for chronically ill (%)
People in Group quarters - Other hospitals or wards for chronically ill (%)
People in Group quarters - Hospitals or wards for drug/alcohol abuse (%)
People in Group quarters - Mental (Psychiatric) hospitals or wards (%)
People in Group quarters - Schools, hospitals, or wards for the mentally retarded (%)
People in Group quarters - Schools, hospitals, or wards for the physically handicapped (%)
People in Group quarters - Institutions for the deaf (%)
People in Group quarters - Institutions for the blind (%)
People in Group quarters - Orthopedic wards and institutions for the physically handicapped (%)
People in Group quarters - Wards in general hospitals for patients who have no usual home elsewhere (%)
People in Group quarters - Wards in military hospitals for patients who have no usual home elsewhere (%)
People in Group quarters - Juvenile institutions (%)
People in Group quarters - Long-term care (%)
People in Group quarters - Homes for abused, dependent, and neglected children (%)
People in Group quarters - Residential treatment centers for emotionally disturbed children (%)
People in Group quarters - Training schools for juvenile delinquents (%)
People in Group quarters - Short-term care, detention or diagnostic centers for delinquent children (%)
People in Group quarters - Type of juvenile institution unknown (%)
People in Group quarters - Noninstitutionalized population (%)
People in Group quarters - College dormitories (includes college quarters off campus) (%)
People in Group quarters - Military quarters (%)
People in Group quarters - On base (%)
People in Group quarters - Barracks, unaccompanied personnel housing (UPH), (Enlisted/Officer), ;and similar group living quarters for military personnel (%)
People in Group quarters - Transient quarters for temporary residents (%)
People in Group quarters - Military ships (%)
People in Group quarters - Group homes (%)
People in Group quarters - Homes or halfway houses for drug/alcohol abuse (%)
People in Group quarters - Homes for the mentally ill (%)
People in Group quarters - Homes for the mentally retarded (%)
People in Group quarters - Homes for the physically handicapped (%)
People in Group quarters - Other group homes (%)
People in Group quarters - Religious group quarters (%)
People in Group quarters - Dormitories (%)
People in Group quarters - Agriculture workers' dormitories on farms (%)
People in Group quarters - Job Corps and vocational training facilities (%)
People in Group quarters - Other workers' dormitories (%)
People in Group quarters - Crews of maritime vessels (%)
People in Group quarters - Other nonhousehold living situations (%)
People in Group quarters - Other noninstitutional group quarters (%)
Residents speaking English at home (%)
Residents speaking English at home - Born in the United States (%)
Residents speaking English at home - Native, born elsewhere (%)
Residents speaking English at home - Foreign born (%)
Residents speaking Spanish at home (%)
Residents speaking Spanish at home - Born in the United States (%)
Residents speaking Spanish at home - Native, born elsewhere (%)
Residents speaking Spanish at home - Foreign born (%)
Residents speaking other language at home (%)
Residents speaking other language at home - Born in the United States (%)
Residents speaking other language at home - Native, born elsewhere (%)
Residents speaking other language at home - Foreign born (%)
Class of Workers - Employee of private company (%)
Class of Workers - Self-employed in own incorporated business (%)
Class of Workers - Private not-for-profit wage and salary workers (%)
Class of Workers - Local government workers (%)
Class of Workers - State government workers (%)
Class of Workers - Federal government workers (%)
Class of Workers - Self-employed workers in own not incorporated business and Unpaid family workers (%)
House heating fuel used in houses and condos - Utility gas (%)
House heating fuel used in houses and condos - Bottled, tank, or LP gas (%)
House heating fuel used in houses and condos - Electricity (%)
House heating fuel used in houses and condos - Fuel oil, kerosene, etc. (%)
House heating fuel used in houses and condos - Coal or coke (%)
House heating fuel used in houses and condos - Wood (%)
House heating fuel used in houses and condos - Solar energy (%)
House heating fuel used in houses and condos - Other fuel (%)
House heating fuel used in houses and condos - No fuel used (%)
House heating fuel used in apartments - Utility gas (%)
House heating fuel used in apartments - Bottled, tank, or LP gas (%)
House heating fuel used in apartments - Electricity (%)
House heating fuel used in apartments - Fuel oil, kerosene, etc. (%)
House heating fuel used in apartments - Coal or coke (%)
House heating fuel used in apartments - Wood (%)
House heating fuel used in apartments - Solar energy (%)
House heating fuel used in apartments - Other fuel (%)
House heating fuel used in apartments - No fuel used (%)
Armed forces status - In Armed Forces (%)
Armed forces status - Civilian (%)
Armed forces status - Civilian - Veteran (%)
Armed forces status - Civilian - Nonveteran (%)
Fatal accidents locations in years 2005-2021
Fatal accidents locations in 2005
Fatal accidents locations in 2006
Fatal accidents locations in 2007
Fatal accidents locations in 2008
Fatal accidents locations in 2009
Fatal accidents locations in 2010
Fatal accidents locations in 2011
Fatal accidents locations in 2012
Fatal accidents locations in 2013
Fatal accidents locations in 2014
Fatal accidents locations in 2015
Fatal accidents locations in 2016
Fatal accidents locations in 2017
Fatal accidents locations in 2018
Fatal accidents locations in 2019
Fatal accidents locations in 2020
Fatal accidents locations in 2021
Alcohol use - People drinking some alcohol every month (%)
Alcohol use - People not drinking at all (%)
Alcohol use - Average days/month drinking alcohol
Alcohol use - Average drinks/week
Alcohol use - Average days/year people drink much
Audiometry - Average condition of hearing (%)
Audiometry - People that can hear a whisper from across a quiet room (%)
Audiometry - People that can hear normal voice from across a quiet room (%)
Audiometry - Ears ringing, roaring, buzzing (%)
Audiometry - Had a job exposure to loud noise (%)
Audiometry - Had off-work exposure to loud noise (%)
Blood Pressure & Cholesterol - Has high blood pressure (%)
Blood Pressure & Cholesterol - Checking blood pressure at home (%)
Blood Pressure & Cholesterol - Frequently checking blood cholesterol (%)
Blood Pressure & Cholesterol - Has high cholesterol level (%)
Consumer Behavior - Money monthly spent on food at supermarket/grocery store
Consumer Behavior - Money monthly spent on food at other stores
Consumer Behavior - Money monthly spent on eating out
Consumer Behavior - Money monthly spent on carryout/delivered foods
Consumer Behavior - Income spent on food at supermarket/grocery store (%)
Consumer Behavior - Income spent on food at other stores (%)
Consumer Behavior - Income spent on eating out (%)
Consumer Behavior - Income spent on carryout/delivered foods (%)
Current Health Status - General health condition (%)
Current Health Status - Blood donors (%)
Current Health Status - Has blood ever tested for HIV virus (%)
Current Health Status - Left-handed people (%)
Dermatology - People using sunscreen (%)
Diabetes - Diabetics (%)
Diabetes - Had a blood test for high blood sugar (%)
Diabetes - People taking insulin (%)
Diet Behavior & Nutrition - Diet health (%)
Diet Behavior & Nutrition - Milk product consumption (# of products/month)
Diet Behavior & Nutrition - Meals not home prepared (#/week)
Diet Behavior & Nutrition - Meals from fast food or pizza place (#/week)
Diet Behavior & Nutrition - Ready-to-eat foods (#/month)
Diet Behavior & Nutrition - Frozen meals/pizza (#/month)
Drug Use - People that ever used marijuana or hashish (%)
Drug Use - Ever used hard drugs (%)
Drug Use - Ever used any form of cocaine (%)
Drug Use - Ever used heroin (%)
Drug Use - Ever used methamphetamine (%)
Health Insurance - People covered by health insurance (%)
Kidney Conditions-Urology - Avg. # of times urinating at night
Medical Conditions - People with asthma (%)
Medical Conditions - People with anemia (%)
Medical Conditions - People with psoriasis (%)
Medical Conditions - People with overweight (%)
Medical Conditions - Elderly people having difficulties in thinking or remembering (%)
Medical Conditions - People who ever received blood transfusion (%)
Medical Conditions - People having trouble seeing even with glass/contacts (%)
Medical Conditions - People with arthritis (%)
Medical Conditions - People with gout (%)
Medical Conditions - People with congestive heart failure (%)
Medical Conditions - People with coronary heart disease (%)
Medical Conditions - People with angina pectoris (%)
Medical Conditions - People who ever had heart attack (%)
Medical Conditions - People who ever had stroke (%)
Medical Conditions - People with emphysema (%)
Medical Conditions - People with thyroid problem (%)
Medical Conditions - People with chronic bronchitis (%)
Medical Conditions - People with any liver condition (%)
Medical Conditions - People who ever had cancer or malignancy (%)
Mental Health - People who have little interest in doing things (%)
Mental Health - People feeling down, depressed, or hopeless (%)
Mental Health - People who have trouble sleeping or sleeping too much (%)
Mental Health - People feeling tired or having little energy (%)
Mental Health - People with poor appetite or overeating (%)
Mental Health - People feeling bad about themself (%)
Mental Health - People who have trouble concentrating on things (%)
Mental Health - People moving or speaking slowly or too fast (%)
Mental Health - People having thoughts they would be better off dead (%)
Oral Health - Average years since last visit a dentist
Oral Health - People embarrassed because of mouth (%)
Oral Health - People with gum disease (%)
Oral Health - General health of teeth and gums (%)
Oral Health - Average days a week using dental floss/device
Oral Health - Average days a week using mouthwash for dental problem
Oral Health - Average number of teeth
Pesticide Use - Households using pesticides to control insects (%)
Pesticide Use - Households using pesticides to kill weeds (%)
Physical Activity - People doing vigorous-intensity work activities (%)
Physical Activity - People doing moderate-intensity work activities (%)
Physical Activity - People walking or bicycling (%)
Physical Activity - People doing vigorous-intensity recreational activities (%)
Physical Activity - People doing moderate-intensity recreational activities (%)
Physical Activity - Average hours a day doing sedentary activities
Physical Activity - Average hours a day watching TV or videos
Physical Activity - Average hours a day using computer
Physical Functioning - People having limitations keeping them from working (%)
Physical Functioning - People limited in amount of work they can do (%)
Physical Functioning - People that need special equipment to walk (%)
Physical Functioning - People experiencing confusion/memory problems (%)
Physical Functioning - People requiring special healthcare equipment (%)
Prescription Medications - Average number of prescription medicines taking
Preventive Aspirin Use - Adults 40+ taking low-dose aspirin (%)
Reproductive Health - Vaginal deliveries (%)
Reproductive Health - Cesarean deliveries (%)
Reproductive Health - Deliveries resulted in a live birth (%)
Reproductive Health - Pregnancies resulted in a delivery (%)
Reproductive Health - Women breastfeeding newborns (%)
Reproductive Health - Women that had a hysterectomy (%)
Reproductive Health - Women that had both ovaries removed (%)
Reproductive Health - Women that have ever taken birth control pills (%)
Reproductive Health - Women taking birth control pills (%)
Reproductive Health - Women that have ever used Depo-Provera or injectables (%)
Reproductive Health - Women that have ever used female hormones (%)
Sexual Behavior - People 18+ that ever had sex (vaginal, anal, or oral) (%)
Sexual Behavior - Males 18+ that ever had vaginal sex with a woman (%)
Sexual Behavior - Males 18+ that ever performed oral sex on a woman (%)
Sexual Behavior - Males 18+ that ever had anal sex with a woman (%)
Sexual Behavior - Males 18+ that ever had any sex with a man (%)
Sexual Behavior - Females 18+ that ever had vaginal sex with a man (%)
Sexual Behavior - Females 18+ that ever performed oral sex on a man (%)
Sexual Behavior - Females 18+ that ever had anal sex with a man (%)
Sexual Behavior - Females 18+ that ever had any kind of sex with a woman (%)
Sexual Behavior - Average age people first had sex
Sexual Behavior - Average number of female sex partners in lifetime (males 18+)
Sexual Behavior - Average number of female vaginal sex partners in lifetime (males 18+)
Sexual Behavior - Average age people first performed oral sex on a woman (18+)
Sexual Behavior - Average number of woman performed oral sex on in lifetime (18+)
Sexual Behavior - Average number of male sex partners in lifetime (males 18+)
Sexual Behavior - Average number of male anal sex partners in lifetime (males 18+)
Sexual Behavior - Average age people first performed oral sex on a man (18+)
Sexual Behavior - Average number of male oral sex partners in lifetime (18+)
Sexual Behavior - People using protection when performing oral sex (%)
Sexual Behavior - Average number of times people have vaginal or anal sex a year
Sexual Behavior - People having sex without condom (%)
Sexual Behavior - Average number of male sex partners in lifetime (females 18+)
Sexual Behavior - Average number of male vaginal sex partners in lifetime (females 18+)
Sexual Behavior - Average number of female sex partners in lifetime (females 18+)
Sexual Behavior - Circumcised males 18+ (%)
Sleep Disorders - Average hours sleeping at night
Sleep Disorders - People that has trouble sleeping (%)
Smoking-Cigarette Use - People smoking cigarettes (%)
Taste & Smell - People 40+ having problems with smell (%)
Taste & Smell - People 40+ having problems with taste (%)
Taste & Smell - People 40+ that ever had wisdom teeth removed (%)
Taste & Smell - People 40+ that ever had tonsils teeth removed (%)
Taste & Smell - People 40+ that ever had a loss of consciousness because of a head injury (%)
Taste & Smell - People 40+ that ever had a broken nose or other serious injury to face or skull (%)
Taste & Smell - People 40+ that ever had two or more sinus infections (%)
Weight - Average height (inches)
Weight - Average weight (pounds)
Weight - Average BMI
Weight - People that are obese (%)
Weight - People that ever were obese (%)
Weight - People trying to lose weight (%)
100%
urban population.
Estimated median house/condo value in 2022: $671,329
11561:
$671,329New York:
$400,400
According to our research of New York and other state lists, there were 5 registered sex offenders living in 11561 zip code as of May 15, 2024 . The ratio of all residents to sex offenders in zip code 11561 is 7,616 to 1.The ratio of registered sex offenders to all residents in this zip code is much lower than the state average.
Median resident age: This zip code:
46.4 yearsNew York median age:
40.0 years
Average household size: This zip code:
2.3 peopleNew York:
2.5 people
Averages for the 2020 tax year for zip code 11561, filed in 2021:
Average Adjusted Gross Income (AGI) in 2020: $111,724 (Individual Income Tax Returns) Here:
$111,724State:
$90,930
Salary/wage: $91,301 (reported on 79.6% of returns )Here:
$91,301State:
$72,104
(% of AGI for various income ranges: 1187.8% for AGIs below $25k , 3559.6% for AGIs $25k-50k , 6842.6% for AGIs $50k-75k , 9905.1% for AGIs $75k-100k , 17832.2% for AGIs $100k-200k , 81183.4% for AGIs over 200k ) Taxable interest for individuals: $2,722 (reported on 47.0% of returns )This zip code:
$2,722New York:
$3,075
(% of AGI for various income ranges: 33.9% for AGIs below $25k , 47.1% for AGIs $25k-50k , 65.2% for AGIs $50k-75k , 98.0% for AGIs $75k-100k , 207.0% for AGIs $100k-200k , 2110.1% for AGIs over 200k ) Ordinary dividends: $8,385 (reported on 33.2% of returns )(% of AGI for various income ranges: 66.5% for AGIs below $25k , 103.3% for AGIs $25k-50k , 175.1% for AGIs $50k-75k , 257.4% for AGIs $75k-100k , 482.3% for AGIs $100k-200k , 4311.2% for AGIs over 200k ) Net capital gain/loss in AGI: +$28,964 (reported on 30.7% of returns )Here:
+$28,964State:
+$44,925
(% of AGI for various income ranges: 22.3% for AGIs below $25k , 74.7% for AGIs $25k-50k , 142.6% for AGIs $50k-75k , 245.1% for AGIs $75k-100k , 518.7% for AGIs $100k-200k , 21126.3% for AGIs over 200k ) Profit/loss from business: +$19,979 (reported on 15.2% of returns )Here:
+$19,979State:
+$14,940
(% of AGI for various income ranges: 182.8% for AGIs below $25k , 205.6% for AGIs $25k-50k , 268.9% for AGIs $50k-75k , 253.9% for AGIs $75k-100k , 527.2% for AGIs $100k-200k , 3902.1% for AGIs over 200k ) Taxable individual retirement arrangement distribution: $21,143 (reported on 10.0% of returns )11561:
$21,143New York:
$19,609
(% of AGI for various income ranges: 60.4% for AGIs below $25k , 119.6% for AGIs $25k-50k , 222.2% for AGIs $50k-75k , 295.3% for AGIs $75k-100k , 592.1% for AGIs $100k-200k , 1897.0% for AGIs over 200k ) Self-employed (Keogh) retirement plans: $31,061 (reported on 1.2% of returns )11561:
$31,061New York:
$32,497
(% of AGI for various income ranges: 18.7% for AGIs $25k-50k , 18.0% for AGIs $75k-100k , 40.1% for AGIs $100k-200k , 744.4% for AGIs over 200k ) Total itemized deductions: $28,751 (reported on 21.4% of returns )Here:
$28,751State:
$39,326
(% of AGI for various income ranges: 190.2% for AGIs below $25k , 321.9% for AGIs $25k-50k , 528.1% for AGIs $50k-75k , 845.6% for AGIs $75k-100k , 1627.6% for AGIs $100k-200k , 6236.0% for AGIs over 200k ) Charity contributions: $4,926 (reported on 19.4% of returns )(% of AGI for various income ranges: 10.4% for AGIs below $25k , 23.7% for AGIs $25k-50k , 47.2% for AGIs $50k-75k , 98.5% for AGIs $75k-100k , 192.2% for AGIs $100k-200k , 1477.8% for AGIs over 200k ) Taxes paid: $9,323 (reported on 21.4% of returns )(% of AGI for various income ranges: 65.3% for AGIs below $25k , 103.1% for AGIs $25k-50k , 184.9% for AGIs $50k-75k , 320.7% for AGIs $75k-100k , 595.4% for AGIs $100k-200k , 1633.2% for AGIs over 200k ) Earned income credit: $1,644 (reported on 7.2% of returns )(% of AGI for various income ranges: 60.8% for AGIs below $25k , 35.9% for AGIs $25k-50k ) Percentage of individuals using paid preparers for their 2020 taxes: 95.1%(% for various income ranges: 92.5% for AGIs below $25k , 95.0% for AGIs $25k-50k , 95.9% for AGIs $50k-75k , 95.4% for AGIs $75k-100k , 96.3% for AGIs $100k-200k , 97.0% for AGIs over 200k )
Averages for the 2012 tax year for zip code 11561, filed in 2013:
Average Adjusted Gross Income (AGI) in 2012: $86,680 (Individual Income Tax Returns) Here:
$86,680State:
$77,088
Salary/wage: $73,623 (reported on 81.0% of returns )Here:
$73,623State:
$60,593
(% of AGI for various income ranges: 66.8% for AGIs below $25k , 74.8% for AGIs $25k-50k , 76.0% for AGIs $50k-75k , 75.9% for AGIs $75k-100k , 77.1% for AGIs $100k-200k , 56.0% for AGIs over 200k ) Taxable interest for individuals: $2,079 (reported on 50.3% of returns )This zip code:
$2,079New York:
$3,125
(% of AGI for various income ranges: 2.5% for AGIs below $25k , 1.4% for AGIs $25k-50k , 1.1% for AGIs $50k-75k , 1.0% for AGIs $75k-100k , 0.7% for AGIs $100k-200k , 1.5% for AGIs over 200k ) Ordinary dividends: $6,769 (reported on 30.8% of returns )(% of AGI for various income ranges: 3.8% for AGIs below $25k , 2.2% for AGIs $25k-50k , 1.9% for AGIs $50k-75k , 1.8% for AGIs $75k-100k , 1.4% for AGIs $100k-200k , 3.5% for AGIs over 200k ) Net capital gain/loss in AGI: +$9,059 (reported on 26.4% of returns )Here:
+$9,059State:
+$42,474
(% of AGI for various income ranges: 0.2% for AGIs $50k-75k , 0.3% for AGIs $75k-100k , 0.3% for AGIs $100k-200k , 7.5% for AGIs over 200k ) Profit/loss from business: +$20,006 (reported on 16.1% of returns )Here:
+$20,006State:
+$16,168
(% of AGI for various income ranges: 11.8% for AGIs below $25k , 4.9% for AGIs $25k-50k , 3.4% for AGIs $50k-75k , 2.4% for AGIs $75k-100k , 2.8% for AGIs $100k-200k , 4.0% for AGIs over 200k ) Taxable individual retirement arrangement distribution: $16,611 (reported on 11.8% of returns )11561:
$16,611New York:
$17,621
(% of AGI for various income ranges: 4.0% for AGIs below $25k , 2.9% for AGIs $25k-50k , 2.6% for AGIs $50k-75k , 2.6% for AGIs $75k-100k , 2.3% for AGIs $100k-200k , 1.7% for AGIs over 200k ) Self-employment retirement plans: $24,442 (reported on 1.3% of returns )11561:
$24,442New York:
$27,330
(% of AGI for various income ranges: 0.3% for AGIs $25k-50k , 0.2% for AGIs $50k-75k , 0.2% for AGIs $75k-100k , 0.3% for AGIs $100k-200k , 0.6% for AGIs over 200k ) Total itemized deductions: $40,059 (31% of AGI, reported on 55.4% of returns )Here:
$40,059State:
$34,985
Here:
30.5% of AGIState:
21.3% of AGI
(% of AGI for various income ranges: 31.2% for AGIs below $25k , 26.4% for AGIs $25k-50k , 26.2% for AGIs $50k-75k , 29.2% for AGIs $75k-100k , 28.4% for AGIs $100k-200k , 21.1% for AGIs over 200k ) Charity contributions: $3,059 (reported on 49.2% of returns )(% of AGI for various income ranges: 1.1% for AGIs below $25k , 1.5% for AGIs $25k-50k , 1.5% for AGIs $50k-75k , 1.7% for AGIs $75k-100k , 1.5% for AGIs $100k-200k , 2.1% for AGIs over 200k ) Taxes paid: $15,080 (reported on 55.4% of returns )11561:
$15,080State:
$18,656
(% of AGI for various income ranges: 8.9% for AGIs below $25k , 7.1% for AGIs $25k-50k , 7.6% for AGIs $50k-75k , 8.9% for AGIs $75k-100k , 9.9% for AGIs $100k-200k , 10.9% for AGIs over 200k ) Earned income credit: $1,910 (reported on 9.0% of returns )(% of AGI for various income ranges: 4.5% for AGIs below $25k , 0.4% for AGIs $25k-50k ) Percentage of individuals using paid preparers for their 2012 taxes: 75.7%(% for various income ranges: 69.5% for AGIs below $25k , 73.6% for AGIs $25k-50k , 74.3% for AGIs $50k-75k , 79.3% for AGIs $75k-100k , 81.8% for AGIs $100k-200k , 85.7% for AGIs over 200k )
Averages for the 2004 tax year for zip code 11561, filed in 2005:
Average Adjusted Gross Income (AGI) in 2004: $69,429 (Individual Income Tax Returns) Here:
$69,429State:
$59,519
Salary/wage: $61,100 (reported on 81.2% of returns )Here:
$61,100State:
$50,673
(% of AGI for various income ranges: 180.7% for AGIs below $10k , 68.5% for AGIs $10k-25k , 79.9% for AGIs $25k-50k , 80.1% for AGIs $50k-75k , 79.3% for AGIs $75k-100k , 64.7% for AGIs over 100k ) Taxable interest for individuals: $2,386 (reported on 62.2% of returns )This zip code:
$2,386New York:
$2,377
(% of AGI for various income ranges: 24.9% for AGIs below $10k , 4.5% for AGIs $10k-25k , 2.3% for AGIs $25k-50k , 1.7% for AGIs $50k-75k , 1.6% for AGIs $75k-100k , 2.0% for AGIs over 100k ) Taxable dividends: $3,786 (reported on 35.5% of returns )(% of AGI for various income ranges: 17.4% for AGIs below $10k , 3.3% for AGIs $10k-25k , 2.0% for AGIs $25k-50k , 1.5% for AGIs $50k-75k , 1.5% for AGIs $75k-100k , 1.9% for AGIs over 100k ) Net capital gain/loss: +$10,573 (reported on 31.2% of returns )Here:
+$10,573State:
+$23,581
(% of AGI for various income ranges: -11.1% for AGIs below $10k , -0.3% for AGIs $10k-25k , -0.7% for AGIs $25k-50k , 0.1% for AGIs $50k-75k , 0.7% for AGIs $75k-100k , 8.7% for AGIs over 100k ) Profit/loss from business: +$17,743 (reported on 15.5% of returns )Here:
+$17,743State:
+$13,809
(% of AGI for various income ranges: 18.8% for AGIs below $10k , 9.3% for AGIs $10k-25k , 4.3% for AGIs $25k-50k , 2.9% for AGIs $50k-75k , 2.9% for AGIs $75k-100k , 4.0% for AGIs over 100k ) IRA payment deduction: $3,433 (reported on 3.8% of returns )11561:
$3,433New York:
$3,115
(% of AGI for various income ranges: 0.7% for AGIs below $10k , 0.4% for AGIs $10k-25k , 0.4% for AGIs $25k-50k , 0.3% for AGIs $50k-75k , 0.2% for AGIs $75k-100k , 0.1% for AGIs over 100k ) Self-employed pension: $16,448 (reported on 1.7% of returns )Here:
$16,448New York:
$19,016
(% of AGI for various income ranges: 0.2% for AGIs $10k-25k , 0.1% for AGIs $25k-50k , 0.2% for AGIs $50k-75k , 0.3% for AGIs $75k-100k , 0.5% for AGIs over 100k ) Total itemized deductions: $23,546 (23% of AGI, reported on 55.6% of returns )Here:
$23,546State:
$25,864
Here:
22.5% of AGIState:
21.9% of AGI
(% of AGI for various income ranges: 52.2% for AGIs below $10k , 21.5% for AGIs $10k-25k , 20.6% for AGIs $25k-50k , 21.8% for AGIs $50k-75k , 21.9% for AGIs $75k-100k , 16.5% for AGIs over 100k ) Charity contributions deductions: $2,881 (3% of AGI, reported on 52.6% of returns )Here:
2.7% of AGIState:
3.6% of AGI
(% of AGI for various income ranges: 2.4% for AGIs below $10k , 1.8% for AGIs $10k-25k , 2.2% for AGIs $25k-50k , 2.4% for AGIs $50k-75k , 2.3% for AGIs $75k-100k , 2.1% for AGIs over 100k ) Total tax: $12,969 (reported on 81.9% of returns )11561:
$12,969State:
$11,730
(% of AGI for various income ranges: 7.9% for AGIs below $10k , 4.4% for AGIs $10k-25k , 7.9% for AGIs $25k-50k , 11.0% for AGIs $50k-75k , 12.0% for AGIs $75k-100k , 19.7% for AGIs over 100k ) Earned income credit: $1,464 (reported on 8.5% of returns )Percentage of individuals using paid preparers for their 2004 taxes: 75.4%(% for various income ranges: 67.2% for AGIs below $10k , 73.5% for AGIs $10k-25k , 72.8% for AGIs $25k-50k , 77.6% for AGIs $50k-75k , 79.4% for AGIs $75k-100k , 83.2% for AGIs over 100k )
Estimated median household income in 2022: This zip code:
$127,123New York:
$79,557
Nearest zip codes: 11558 ,
11572 ,
11518 ,
11557 ,
11569 ,
11559 .
Lido Beach Zip Code Map
Percentage of family households: This zip code:
35.0%New York:
41.3%
Percentage of households with unmarried partners: This zip code:
6.0%New York:
42.3%
Likely homosexual households (counted as self-reported same-sex unmarried-partner households)
Lesbian couples: 0.2% of all households Gay men: 0.0% of all households
Household received Food Stamps/SNAP in the past 12 months: 669Household did not receive Food Stamps/SNAP in the past 12 months: 15,458
Women who had a birth in the past 12 months: 413 (336 now married , 74 unmarried) Women who did not have a birth in the past 12 months: 7,732 (2,722 now married , 5,013 unmarried)
Housing units in zip code 11561 with a mortgage: 6,353 (681
second mortgage , 12
home equity loan , 645
both second mortgage and home equity loan )
Houses without a mortgage: 84
Median monthly owner costs for units with a mortgage: $3,301
Median monthly owner costs for units without a mortgage: $1,487
Residents with income below the poverty level in 2022:
This zip code:
6.1%Whole state:
14.3%
Residents with income below 50% of the poverty level in 2022:
This zip code:
2.7%Whole state:
6.8%
Median number of rooms in houses and condos: Median number of rooms in apartments: Notable locations in this zip code not listed on our city pages
Click to draw/clear zip code borders Notable locations in zip code 11561: (A) , Long Beach Sewage Disposal Plant (B) , Park Place Water Treatment Plant (C) , Lido Golf Club (D) , Long Beach Station (E) , Long Beach City Hall (F) , West End Library (G) , Long Beach Fire Department Station Number 3 (H) , Long Beach Fire House Number 2 (I) , Sonabend Family Library (J) , Kennedy House (K) , Laurel Theatre (L) , Seaview Terrace (M) , The Tides Nursing Home (N) , Jewish War Veterans Memorial Building (O) , Long Beach Public Library (P) , Beach Terrace Care Center (Q) , Grandell Rehabilitation and Nursing Center (R) , Hoffmann Manor of Long Beach Assisted Living Facility (S) , Komanoff Center for Geriatric and Rehabilitative Medicine (T) . Display/hide their locations on the map
Churches in zip code 11561 include: (A) , Sephardic Congregation of Long Beach (B) , West End Synagogue (C) , Temple Emanu-El (D) , Saint Mary of the Isle Roman Catholic Church (E) , Christian Lighthouse Missionary Baptist Church (F) , Temple Beth El of Long Beach (G) , Church of Saint Ignatius Martyr (H) , People's Church of Long Beach (I) . Display/hide their locations on the map
Parks in zip code 11561 include: (1) , Lido West Town Park (2) . Display/hide their locations on the map
Beaches: (A) , East Atlantic Beach (B) , Lido Beach (C) . Display/hide their locations on the map
Year house built (houses)
57 2020 or later716 2010 to 2019760 2000 to 2009757 1990 to 19991,675 1980 to 19891,241 1970 to 19793,381 1960 to 19693,784 1950 to 19591,798 1940 to 19494,075 1939 or earlier
Zip code 11561 household income distribution in 2022 427 Less than $10,000322 $10,000 to $14,999207 $15,000 to $19,999353 $20,000 to $24,999494 $25,000 to $29,999404 $30,000 to $34,999344 $35,000 to $39,999161 $40,000 to $44,999317 $45,000 to $49,999444 $50,000 to $59,9991,269 $60,000 to $74,9991,684 $75,000 to $99,9991,546 $100,000 to $124,9991,513 $125,000 to $149,9992,215 $150,000 to $199,9994,501 $200,000 or moreEstimate of home value of owner-occupied houses/condos in 2022 in zip code 11561 148 Less than $10,00020 $30,000 to $34,99916 $40,000 to $49,99938 $50,000 to $59,9993 $60,000 to $69,99922 $80,000 to $89,99915 $100,000 to $124,99918 $125,000 to $149,999125 $200,000 to $249,999282 $250,000 to $299,999833 $300,000 to $399,9991,464 $400,000 to $499,9994,078 $500,000 to $749,9992,673 $750,000 to $999,999822 $1,000,000 to $1,499,999169 $1,500,000 to $1,999,999100 $2,000,000 or moreRent paid by renters in 2022 in zip code 11561 19 $200 to $249106 $250 to $29914 $450 to $49950 $650 to $69912 $700 to $74933 $800 to $89950 $900 to $999203 $1,000 to $1,249359 $1,250 to $1,4991,510 $1,500 to $1,9991,456 $2,000 to $2,499814 $2,500 to $2,999650 $3,000 to $3,499435 $3,500 or more143 No cash rent
Median gross rent in 2022: $2,349.
Median price asked for vacant for-sale houses and condos in 2022: $1,086,720.
Estimated median house (or condo) value in 2022 for: White Non-Hispanic householders: $707,633Black or African American householders: $560,928Asian householders: $1,029,014Some other race householders: $516,887Two or more races householders: $657,045Hispanic or Latino householders: $643,059Estimated median house or condo value in 2022: $671,329
11561:
$671,329New York:
$400,400
Lower value quartile - upper value quartile: $505,116 - $868,761
Mean price in 2022: Detached houses: $811,434Here:
$811,434State:
$476,719
Townhouses or other attached units: $608,963Here:
$608,963State:
$699,270
In 2-unit structures: $693,851Here:
$693,851State:
$713,077
In 3-to-4-unit structures: $714,177Here:
$714,177State:
$764,568
In 5-or-more-unit structures: $443,374Here:
$443,374State:
$912,009
Housing units in structures:
One, detached: 7,832One, attached: 477Two: 2,9883 or 4: 6665 to 9: 39410 to 19: 44620 to 49: 1,46750 or more: 3,973Mobile homes: 107Unemployment : 3.4%
Means of transportation to work in zip code 11561 57.7% 12,524 Drove a car alone3.1% 676 Carpooled2.1% 449 Bus or trolley bus2.5% 533 Streetcar or trolley car8.8% 1,917 Subway or elevated0.4% 91 Railroad0.0% 6 Ferryboat0.4% 76 Taxi0.8% 169 Bicycle3.1% 677 Walked1.5% 321 Other means19.5% 4,238 Worked at homeTravel time to work (commute) in zip code 11561 424 Less than 5 minutes1,337 5 to 9 minutes1,222 10 to 14 minutes926 15 to 19 minutes1,096 20 to 24 minutes675 25 to 29 minutes2,663 30 to 34 minutes885 35 to 39 minutes815 40 to 44 minutes2,691 45 to 59 minutes2,955 60 to 89 minutes2,008 90 or more minutes
Percentage of zip code residents living and working in this county: 67.0%
Household type by relationship:
Households: 38,140
Male householders: 8,169 (2,423 living alone ), Female householders: 8,182 (3,070 living alone )6,807 spouses (6,739 opposite-sex spouses ), 1,826 unmarried partners , (1,413 opposite-sex unmarried partners ), 8,100 children (7,814 natural , 112 adopted , 176 stepchildren ), 1,048 grandchildren , 204 brothers or sisters , 569 parents , 0 foster children , 687 other relatives , 1,536 non-relatives In group quarters: 1,253 (-1 institutionalized population )
Size of family households: 4,084 2-persons , 2,405 3-persons , 1,339 4-persons , 653 5-persons , 276 6-persons , 175 7-or-more-persons
Size of nonfamily households: 5,494 1-person , 1,607 2-persons , 343 3-persons , 62 4-persons
3,085 married couples with children. single-parent households (181 men , 981 women ).
82.1% of residents of 11561 zip code speak English at home. of residents speak Spanish at home (67% very well, 19% well, 12% not well, 2% not at all ).of residents speak other Indo-European language at home (64% very well, 26% well, 7% not well, 3% not at all ).of residents speak Asian or Pacific Island language at home (59% very well, 36% well, 5% not well ).of residents speak other language at home (89% very well, 8% well, 3% not well ).
Foreign born population: 5,776 (15.1%)
(70.9%
of them are naturalized citizens )
This zip code:
15.1%Whole state:
22.7%
12% Malaysia 8% Bolivia 7% Costa Rica 6% Dominica 6% Peru 5% Chile 3% Colombia 18% Irish 14% Italian 5% American 3% Polish 3% European 3% Eastern European 3% German
Year of entry for the foreign-born population
1,035 2010 or later 946 2000 to 2009 1,342 1990 to 1999 2,902 Before 1990
There are
81 Pharmacists 371 Other Medical Specialists in Zip Code 11561.
Facilities with environmental interests located in this zip code:
HEMPSTEAD TOWN OF PARKS & RECREATION (630 LIDO BLVD in LIDO BEACH, NY)
(Resource Conservation and Recovery Act (tracking hazardous waste)) Organizations: TOWN OF HEMPSTEAD (CONTACT/OWNER)
ABLE FORD SALES INC (550 LONG BEACH BLVD in LONG BEACH, NY)
(Resource Conservation and Recovery Act (tracking hazardous waste))
HANG BOK CLEANERS INC (49 LONG BEACH PLZ in LONG BEACH, NY)
(Resource Conservation and Recovery Act (tracking hazardous waste))
HEBREW ACADEMY OF LONG BEACH (530 WEST BROADWAY in LONG BEACH, NY)
COMPLIANCE ACTIVITY (Tracking inspections of insecticide, fungicide, and rodenticide, and toxic substances)
Housing units lacking complete plumbing facilities: 0.6%
Housing units lacking complete kitchen facilities: 1.0%
72.4% Utility gas 13.4% Electricity 9.9% Fuel oil, kerosene, etc. 2.7% Bottled, tank, or LP gas 0.9% No fuel used
Population in 1990: 39,066. Population change in the 1990s: +516 (+1.3%).
Place of birth for U.S.-born residents:
This state: 28,651Northeast: 1,145Midwest: 576South: 888West: 442
59% of the 11561 zip code residents lived in the same house 5 years ago.
Out of people who lived in different houses, 67% lived in this county.
Out of people who lived in different counties, 50% lived in New York.
91% of the 11561 zip code residents lived in the same house 1 year ago.
Out of people who lived in different houses, 68% moved from this county.
Out of people who lived in different houses, 22% moved from different county within same state.
Out of people who lived in different houses, 7% moved from different state.
Out of people who lived in different houses, 1% moved from abroad.
Private vs. public school enrollment:
Students in private schools in grades 1 to 8 (elementary and middle school): 224
Students in private schools in grades 9 to 12 (high school): 245
Students in private undergraduate colleges: 636
Occupation by median earnings in the past 12 months ($)
114,793 Life, physical, and social science occupations 105,830 Computer and mathematical occupations 100,498 Management occupations 99,042 Legal occupations 95,810 Law enforcement workers including supervisors 94,858 Fire fighting and prevention, and other protective service workers including supervisors
Companies with federal contracts located in this zip code:
AT LAST ELECTRONICS CORPORATIO (315 E HARRISON ST in LONG BEACH, NY; small business)
$2,460 with Navy for Electrical Insulators and Insulating Materials. Signed on 2004-11-23. Completion date: 2004-11-24.
Top industries in this zip code by the number of employees in 2005:
Health Care and Social Assistance: Nursing Care Facilities (250-499 employees: 1 establishment, 100-249 employees: 3 establishments)Health Care and Social Assistance: General Medical and Surgical Hospitals (500-999: 1)Accommodation and Food Services: Full-Service Restaurants (50-99: 2, 20-49: 2, 10-19: 9, 5-9: 5, 1-4: 20)Administrative and Support and Waste Management and Remediation Services: Security Guards and Patrol Services (100-249: 1, 50-99: 1, 20-49: 1)Health Care and Social Assistance: Offices of Physicians (except Mental Health Specialists) (20-49: 1, 10-19: 4, 5-9: 13, 1-4: 32)Accommodation and Food Services: Limited-Service Restaurants (20-49: 3, 10-19: 4, 5-9: 1, 1-4: 13)Finance and Insurance: Direct Property and Casualty Insurance Carriers (100-249: 1, 1-4: 2)Arts, Entertainment, and Recreation: Fitness and Recreational Sports Centers (50-99: 1, 20-49: 1, 10-19: 1, 5-9: 4, 1-4: 4)
People in group quarters in 2010:
822 people in nursing facilities/skilled-nursing facilities
126 people in college/university student housing
96 people in residential schools for people with disabilities
48 people in other noninstitutional facilities
18 people in residential treatment centers for juveniles (non-correctional)
2 people in mental (psychiatric) hospitals and psychiatric units in other hospitals
People in group quarters in 2000:
814 people in nursing homes
288 people in homes for the mentally retarded
174 people in homes for the physically handicapped
170 people in other noninstitutional group quarters
91 people in other group homes
86 people in homes for abused, dependent, and neglected children
76 people in college dormitories (includes college quarters off campus)
15 people in religious group quarters
Fatal accident statistics in 2014:
Fatal accident count: 1Vehicles involved in fatal accidents: 1Fatal accidents caused by drunken drivers: 0Fatalities: 1Persons involved in fatal accidents: 1Pedestrians involved in fatal accidents: 1
Fatal accident statistics in 2013:
Fatal accident count: 1Vehicles involved in fatal accidents: 1Fatal accidents caused by drunken drivers: 0Fatalities: 1Persons involved in fatal accidents: 1Pedestrians involved in fatal accidents: 1
Home Mortgage Disclosure Act Aggregated Statistics For Year 2009(Based on 4 full and 8 partial tracts) A) FHA, FSA/RHS & VA B) Conventional C) Refinancings D) Home Improvement Loans E) Loans on Dwellings For 5+ Families F) Non-occupant Loans on G) Loans On Manufactured Number Average Value Number Average Value Number Average Value Number Average Value Number Average Value Number Average Value Number Average Value
LOANS ORIGINATED 69 $440,420 420 $288,937 810 $274,989 43 $195,077 5 $863,366 138 $255,427 2 $326,500 APPLICATIONS APPROVED, NOT ACCEPTED 5 $532,608 31 $301,323 119 $297,697 7 $279,876 0 $0 17 $371,068 0 $0 APPLICATIONS DENIED 25 $433,032 114 $365,440 436 $338,596 46 $84,676 4 $100,000 51 $299,583 2 $9,220 APPLICATIONS WITHDRAWN 14 $401,161 68 $292,897 272 $329,432 11 $296,809 0 $0 46 $285,098 0 $0 FILES CLOSED FOR INCOMPLETENESS 2 $377,825 8 $226,950 78 $338,257 0 $0 0 $0 12 $292,652 0 $0
Aggregated Statistics For Year 2008(Based on 4 full and 8 partial tracts) A) FHA, FSA/RHS & VA B) Conventional C) Refinancings D) Home Improvement Loans E) Loans on Dwellings For 5+ Families F) Non-occupant Loans on Number Average Value Number Average Value Number Average Value Number Average Value Number Average Value Number Average Value
LOANS ORIGINATED 32 $465,862 616 $307,564 429 $290,127 77 $113,363 13 $2,790,200 140 $306,534 APPLICATIONS APPROVED, NOT ACCEPTED 2 $364,800 103 $372,602 121 $326,153 20 $115,036 0 $0 36 $269,493 APPLICATIONS DENIED 6 $289,035 241 $354,633 301 $334,645 75 $101,989 0 $0 74 $265,960 APPLICATIONS WITHDRAWN 6 $541,398 78 $314,158 141 $349,544 17 $143,173 0 $0 20 $301,733 FILES CLOSED FOR INCOMPLETENESS 0 $0 27 $326,604 50 $370,062 15 $238,724 0 $0 7 $416,904
Aggregated Statistics For Year 2007(Based on 4 full and 8 partial tracts) B) Conventional C) Refinancings D) Home Improvement Loans E) Loans on Dwellings For 5+ Families F) Non-occupant Loans on G) Loans On Manufactured Number Average Value Number Average Value Number Average Value Number Average Value Number Average Value Number Average Value
LOANS ORIGINATED 904 $323,670 658 $311,196 113 $170,346 2 $564,120 214 $344,012 0 $0 APPLICATIONS APPROVED, NOT ACCEPTED 138 $307,954 159 $305,260 35 $128,383 0 $0 26 $305,303 0 $0 APPLICATIONS DENIED 217 $345,967 432 $345,908 105 $141,824 0 $0 89 $313,801 2 $16,595 APPLICATIONS WITHDRAWN 93 $362,316 151 $311,618 30 $294,190 0 $0 31 $271,684 0 $0 FILES CLOSED FOR INCOMPLETENESS 44 $325,068 74 $390,704 7 $173,206 0 $0 18 $344,800 0 $0
Aggregated Statistics For Year 2006(Based on 4 full and 8 partial tracts) A) FHA, FSA/RHS & VA B) Conventional C) Refinancings D) Home Improvement Loans E) Loans on Dwellings For 5+ Families F) Non-occupant Loans on G) Loans On Manufactured Number Average Value Number Average Value Number Average Value Number Average Value Number Average Value Number Average Value Number Average Value
LOANS ORIGINATED 3 $343,197 1,054 $305,717 887 $297,576 144 $136,622 24 $5,675,298 230 $325,336 0 $0 APPLICATIONS APPROVED, NOT ACCEPTED 2 $274,710 133 $326,343 155 $293,658 16 $138,860 0 $0 34 $292,116 0 $0 APPLICATIONS DENIED 0 $0 286 $376,378 437 $335,571 103 $122,877 2 $587,250 72 $295,650 3 $261,140 APPLICATIONS WITHDRAWN 0 $0 131 $323,654 323 $287,672 18 $140,712 5 $376,914 29 $282,948 0 $0 FILES CLOSED FOR INCOMPLETENESS 0 $0 70 $347,834 82 $303,206 7 $239,663 0 $0 22 $361,003 0 $0
Aggregated Statistics For Year 2005(Based on 4 full and 8 partial tracts) B) Conventional C) Refinancings D) Home Improvement Loans E) Loans on Dwellings For 5+ Families F) Non-occupant Loans on G) Loans On Manufactured Number Average Value Number Average Value Number Average Value Number Average Value Number Average Value Number Average Value
LOANS ORIGINATED 1,215 $308,104 1,005 $278,985 156 $151,517 11 $2,054,441 254 $292,816 2 $157,985 APPLICATIONS APPROVED, NOT ACCEPTED 144 $314,121 149 $256,333 41 $98,784 0 $0 25 $358,153 0 $0 APPLICATIONS DENIED 264 $330,385 451 $315,740 115 $156,742 4 $741,215 57 $308,226 5 $423,424 APPLICATIONS WITHDRAWN 207 $338,783 468 $274,357 44 $178,253 2 $38,550 51 $324,774 2 $208,385 FILES CLOSED FOR INCOMPLETENESS 80 $301,273 212 $301,913 14 $197,508 0 $0 10 $274,455 0 $0
Aggregated Statistics For Year 2004(Based on 4 full and 8 partial tracts) A) FHA, FSA/RHS & VA B) Conventional C) Refinancings D) Home Improvement Loans E) Loans on Dwellings For 5+ Families F) Non-occupant Loans on G) Loans On Manufactured Number Average Value Number Average Value Number Average Value Number Average Value Number Average Value Number Average Value Number Average Value
LOANS ORIGINATED 2 $154,000 1,234 $278,468 1,301 $245,272 144 $162,470 29 $1,443,990 296 $285,394 2 $169,235 APPLICATIONS APPROVED, NOT ACCEPTED 0 $0 164 $289,263 244 $242,009 76 $86,926 2 $228,630 45 $254,796 0 $0 APPLICATIONS DENIED 2 $299,620 210 $325,326 422 $275,069 111 $82,727 2 $103,885 91 $350,312 0 $0 APPLICATIONS WITHDRAWN 0 $0 156 $293,347 431 $252,745 27 $112,107 5 $497,022 36 $248,121 2 $169,290 FILES CLOSED FOR INCOMPLETENESS 0 $0 62 $307,832 91 $254,278 11 $58,723 0 $0 4 $256,248 0 $0
Aggregated Statistics For Year 2003(Based on 4 full and 8 partial tracts) A) FHA, FSA/RHS & VA B) Conventional C) Refinancings D) Home Improvement Loans E) Loans on Dwellings For 5+ Families F) Non-occupant Loans on Number Average Value Number Average Value Number Average Value Number Average Value Number Average Value Number Average Value
LOANS ORIGINATED 5 $389,000 1,173 $253,091 3,030 $200,914 60 $117,988 9 $3,643,480 382 $242,265 APPLICATIONS APPROVED, NOT ACCEPTED 0 $0 150 $282,063 510 $210,755 41 $65,562 0 $0 44 $235,019 APPLICATIONS DENIED 0 $0 197 $280,581 850 $232,006 68 $61,191 0 $0 102 $227,615 APPLICATIONS WITHDRAWN 2 $118,865 116 $259,846 594 $223,082 27 $94,879 2 $317,805 53 $249,920 FILES CLOSED FOR INCOMPLETENESS 0 $0 44 $234,301 180 $215,854 4 $69,600 0 $0 10 $252,265
Aggregated Statistics For Year 2002(Based on 4 full and 8 partial tracts) A) FHA, FSA/RHS & VA B) Conventional C) Refinancings D) Home Improvement Loans E) Loans on Dwellings For 5+ Families F) Non-occupant Loans on Number Average Value Number Average Value Number Average Value Number Average Value Number Average Value Number Average Value
LOANS ORIGINATED 20 $214,918 1,195 $213,296 2,010 $189,059 131 $62,456 15 $892,208 250 $224,214 APPLICATIONS APPROVED, NOT ACCEPTED 0 $0 122 $234,570 317 $186,448 43 $62,353 2 $2,256,480 24 $174,176 APPLICATIONS DENIED 6 $273,930 196 $230,369 579 $180,349 72 $54,237 2 $1,923,750 60 $162,056 APPLICATIONS WITHDRAWN 3 $250,857 127 $229,459 386 $182,025 37 $66,322 2 $789,915 39 $175,327 FILES CLOSED FOR INCOMPLETENESS 0 $0 46 $198,460 148 $192,756 9 $68,038 0 $0 16 $173,927
Aggregated Statistics For Year 2001(Based on 4 full and 8 partial tracts) A) FHA, FSA/RHS & VA B) Conventional C) Refinancings D) Home Improvement Loans E) Loans on Dwellings For 5+ Families F) Non-occupant Loans on Number Average Value Number Average Value Number Average Value Number Average Value Number Average Value Number Average Value
LOANS ORIGINATED 24 $191,139 1,158 $178,568 1,307 $172,084 116 $74,085 12 $430,017 183 $191,672 APPLICATIONS APPROVED, NOT ACCEPTED 3 $233,500 83 $180,565 200 $174,336 58 $47,757 0 $0 23 $209,911 APPLICATIONS DENIED 2 $138,425 203 $181,439 460 $140,449 90 $43,908 0 $0 37 $165,521 APPLICATIONS WITHDRAWN 12 $182,856 134 $153,733 332 $143,010 63 $45,841 0 $0 22 $155,833 FILES CLOSED FOR INCOMPLETENESS 2 $122,625 35 $176,430 74 $177,541 9 $26,066 0 $0 3 $112,460
Aggregated Statistics For Year 2000(Based on 4 full and 8 partial tracts) A) FHA, FSA/RHS & VA B) Conventional C) Refinancings D) Home Improvement Loans E) Loans on Dwellings For 5+ Families F) Non-occupant Loans on Number Average Value Number Average Value Number Average Value Number Average Value Number Average Value Number Average Value
LOANS ORIGINATED 25 $162,794 1,085 $157,084 364 $133,106 129 $42,796 6 $488,333 129 $167,193 APPLICATIONS APPROVED, NOT ACCEPTED 0 $0 124 $167,596 106 $111,574 40 $50,914 0 $0 7 $141,393 APPLICATIONS DENIED 6 $160,167 240 $154,390 320 $121,054 97 $53,429 2 $394,960 45 $170,024 APPLICATIONS WITHDRAWN 10 $158,434 119 $152,538 253 $99,544 37 $55,164 2 $4,000,000 29 $159,654 FILES CLOSED FOR INCOMPLETENESS 2 $138,425 31 $172,509 62 $136,451 7 $20,003 0 $0 2 $215,000
Aggregated Statistics For Year 1999(Based on 1 full and 5 partial tracts) A) FHA, FSA/RHS & VA B) Conventional C) Refinancings D) Home Improvement Loans E) Loans on Dwellings For 5+ Families F) Non-occupant Loans on Number Average Value Number Average Value Number Average Value Number Average Value Number Average Value Number Average Value
LOANS ORIGINATED 20 $183,626 573 $148,329 395 $128,671 98 $28,207 6 $560,003 90 $134,243 APPLICATIONS APPROVED, NOT ACCEPTED 2 $119,960 53 $162,226 105 $136,463 24 $30,819 1 $7,740 13 $102,304 APPLICATIONS DENIED 3 $208,523 104 $141,375 197 $129,609 57 $42,321 2 $2,220,435 26 $108,630 APPLICATIONS WITHDRAWN 4 $173,135 46 $153,004 159 $114,037 22 $85,280 4 $900,738 14 $139,598 FILES CLOSED FOR INCOMPLETENESS 2 $101,005 22 $137,852 46 $159,193 3 $36,977 0 $0 4 $150,430
Private Mortgage Insurance Companies Aggregated Statistics For Year 2009(Based on 4 full and 8 partial tracts) A) Conventional B) Refinancings Number Average Value Number Average Value
LOANS ORIGINATED 44 $282,218 12 $359,377 APPLICATIONS APPROVED, NOT ACCEPTED 10 $354,000 8 $372,276 APPLICATIONS DENIED 21 $356,693 5 $395,978 APPLICATIONS WITHDRAWN 24 $252,612 0 $0 FILES CLOSED FOR INCOMPLETENESS 8 $329,704 0 $0
Aggregated Statistics For Year 2008(Based on 4 full and 8 partial tracts) A) Conventional B) Refinancings C) Non-occupant Loans on Number Average Value Number Average Value Number Average Value
LOANS ORIGINATED 138 $335,261 15 $332,699 5 $278,614 APPLICATIONS APPROVED, NOT ACCEPTED 57 $300,645 9 $429,614 9 $285,960 APPLICATIONS DENIED 42 $295,816 3 $507,127 5 $283,184 APPLICATIONS WITHDRAWN 13 $333,824 4 $283,000 0 $0 FILES CLOSED FOR INCOMPLETENESS 4 $205,970 0 $0 2 $187,000
Aggregated Statistics For Year 2007(Based on 4 full and 8 partial tracts) A) Conventional B) Refinancings C) Non-occupant Loans on Number Average Value Number Average Value Number Average Value
LOANS ORIGINATED 124 $300,320 11 $367,456 3 $433,983 APPLICATIONS APPROVED, NOT ACCEPTED 26 $297,287 11 $493,618 6 $197,540 APPLICATIONS DENIED 12 $369,855 0 $0 0 $0 APPLICATIONS WITHDRAWN 11 $271,525 0 $0 0 $0 FILES CLOSED FOR INCOMPLETENESS 0 $0 0 $0 0 $0
Aggregated Statistics For Year 2006(Based on 4 full and 8 partial tracts) A) Conventional B) Refinancings C) Non-occupant Loans on Number Average Value Number Average Value Number Average Value
LOANS ORIGINATED 88 $290,396 3 $458,903 3 $349,867 APPLICATIONS APPROVED, NOT ACCEPTED 22 $285,293 2 $247,010 3 $392,543 APPLICATIONS DENIED 2 $262,315 0 $0 0 $0 APPLICATIONS WITHDRAWN 2 $304,625 0 $0 0 $0 FILES CLOSED FOR INCOMPLETENESS 0 $0 0 $0 0 $0
Aggregated Statistics For Year 2005(Based on 4 full and 8 partial tracts) A) Conventional B) Refinancings C) Non-occupant Loans on Number Average Value Number Average Value Number Average Value
LOANS ORIGINATED 117 $272,293 5 $378,622 3 $384,630 APPLICATIONS APPROVED, NOT ACCEPTED 28 $280,249 4 $203,500 2 $368,560 APPLICATIONS DENIED 2 $248,000 0 $0 0 $0 APPLICATIONS WITHDRAWN 13 $263,929 2 $319,900 4 $222,828 FILES CLOSED FOR INCOMPLETENESS 2 $191,000 0 $0 0 $0
Aggregated Statistics For Year 2004(Based on 4 full and 8 partial tracts) A) Conventional B) Refinancings C) Non-occupant Loans on D) Loans On Manufactured Number Average Value Number Average Value Number Average Value Number Average Value
LOANS ORIGINATED 134 $261,138 9 $296,538 6 $302,638 0 $0 APPLICATIONS APPROVED, NOT ACCEPTED 59 $264,725 13 $318,485 5 $377,482 2 $143,000 APPLICATIONS DENIED 10 $223,696 0 $0 0 $0 0 $0 APPLICATIONS WITHDRAWN 13 $270,154 6 $279,855 0 $0 0 $0 FILES CLOSED FOR INCOMPLETENESS 0 $0 2 $276,000 0 $0 0 $0
Aggregated Statistics For Year 2003(Based on 4 full and 8 partial tracts) A) Conventional B) Refinancings C) Non-occupant Loans on Number Average Value Number Average Value Number Average Value
LOANS ORIGINATED 216 $244,192 41 $258,985 9 $265,677 APPLICATIONS APPROVED, NOT ACCEPTED 42 $276,710 12 $310,562 0 $0 APPLICATIONS DENIED 9 $304,036 4 $620,000 6 $488,563 APPLICATIONS WITHDRAWN 14 $256,273 3 $336,703 4 $268,262 FILES CLOSED FOR INCOMPLETENESS 2 $508,000 0 $0 0 $0
Aggregated Statistics For Year 2002(Based on 4 full and 8 partial tracts) A) Conventional B) Refinancings C) Non-occupant Loans on Number Average Value Number Average Value Number Average Value
LOANS ORIGINATED 301 $223,310 36 $235,576 26 $248,632 APPLICATIONS APPROVED, NOT ACCEPTED 153 $208,057 10 $197,856 8 $244,534 APPLICATIONS DENIED 5 $200,808 0 $0 2 $222,385 APPLICATIONS WITHDRAWN 7 $262,337 2 $111,580 0 $0 FILES CLOSED FOR INCOMPLETENESS 3 $365,517 0 $0 0 $0
Aggregated Statistics For Year 2001(Based on 4 full and 8 partial tracts) A) Conventional B) Refinancings C) Non-occupant Loans on Number Average Value Number Average Value Number Average Value
LOANS ORIGINATED 322 $193,406 56 $217,822 5 $198,056 APPLICATIONS APPROVED, NOT ACCEPTED 103 $188,268 13 $228,442 3 $290,363 APPLICATIONS DENIED 10 $153,375 4 $181,000 0 $0 APPLICATIONS WITHDRAWN 10 $179,483 0 $0 2 $183,910 FILES CLOSED FOR INCOMPLETENESS 7 $199,487 0 $0 0 $0
Aggregated Statistics For Year 2000(Based on 4 full and 8 partial tracts) A) Conventional B) Refinancings C) Non-occupant Loans on Number Average Value Number Average Value Number Average Value
LOANS ORIGINATED 313 $173,168 21 $166,992 16 $150,129 APPLICATIONS APPROVED, NOT ACCEPTED 64 $174,890 4 $58,000 2 $135,415 APPLICATIONS DENIED 11 $162,574 2 $186,220 0 $0 APPLICATIONS WITHDRAWN 5 $201,830 0 $0 0 $0 FILES CLOSED FOR INCOMPLETENESS 2 $130,045 0 $0 0 $0
Aggregated Statistics For Year 1999(Based on 1 full and 5 partial tracts) A) Conventional B) Refinancings C) Non-occupant Loans on Number Average Value Number Average Value Number Average Value
LOANS ORIGINATED 201 $156,901 13 $140,489 5 $155,386 APPLICATIONS APPROVED, NOT ACCEPTED 24 $175,678 8 $149,209 1 $189,620 APPLICATIONS DENIED 17 $146,832 0 $0 1 $77,420 APPLICATIONS WITHDRAWN 10 $198,541 1 $95,690 0 $0 FILES CLOSED FOR INCOMPLETENESS 1 $243,870 1 $70,080 0 $0
2002 - 2018 National Fire Incident Reporting System (NFIRS) incidents See full 2006 National Fire Incident Reporting System statistics for zip code 11561, New York
Most common first names in zip code 11561 among deceased individuals Name Count Lived (average)
Rose 434 84.2 years Joseph 372 77.6 years Mary 352 82.2 years Anna 339 85.9 years John 287 73.2 years Harry 279 81.3 years William 267 73.9 years Samuel 230 82.3 years Helen 222 80.6 years Louis 221 81.3 years
Most common last names in zip code 11561 among deceased individuals Last name Count Lived (average)
Cohen 146 81.5 years Schwartz 102 81.6 years Levy 95 81.4 years Levine 74 79.4 years Goldberg 73 80.3 years Friedman 72 79.9 years Miller 67 80.2 years Goldstein 67 84.8 years Greenberg 56 81.8 years Smith 54 78.5 years
Businesses in zip code 11561
Name Count Name Count
7-Eleven 1 Nike 3 AT&T 1 Pier 1 Imports 1 Baskin-Robbins 1 RadioShack 1 CVS 1 Rite Aid 1 Curves 1 Sprint Nextel 1 Domino's Pizza 1 Starbucks 3 Dunkin Donuts 1 T-Mobile 2 FedEx 2 Taco Bell 1 GNC 1 True Value 2 Jones New York 1 UPS 3 KFC 1 Waldbaums 1 McDonald's 1 Walgreens 1

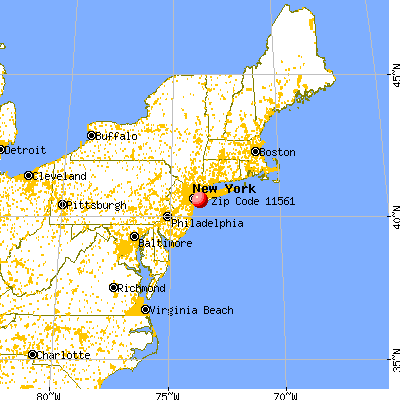


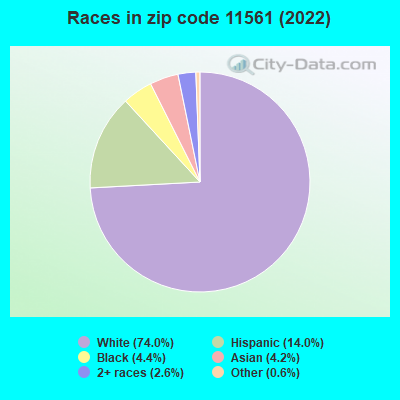


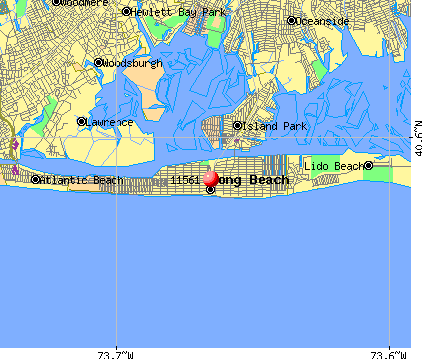 Nearest zip codes: 11558, 11572, 11518, 11557, 11569, 11559.
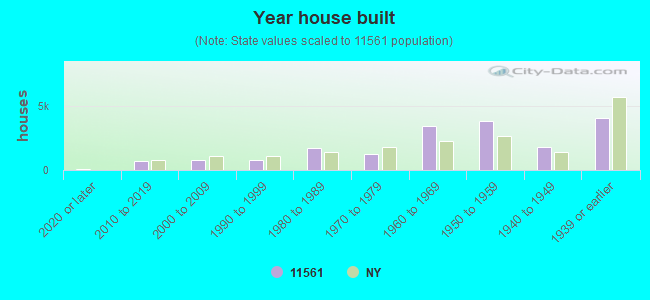


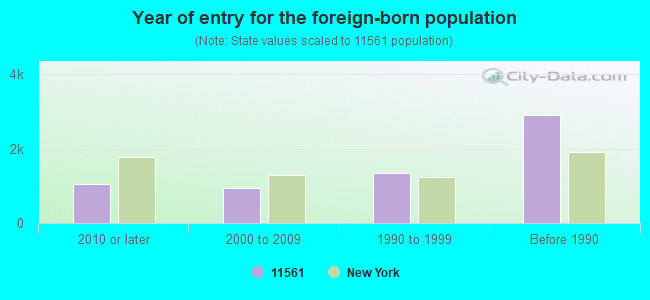

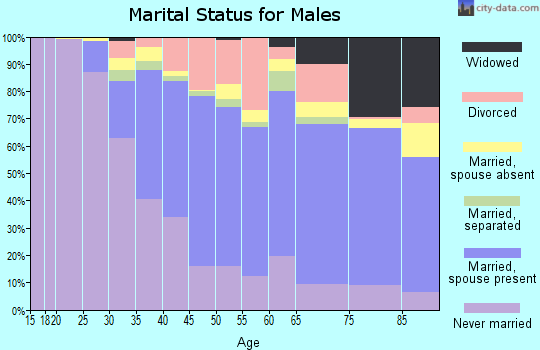

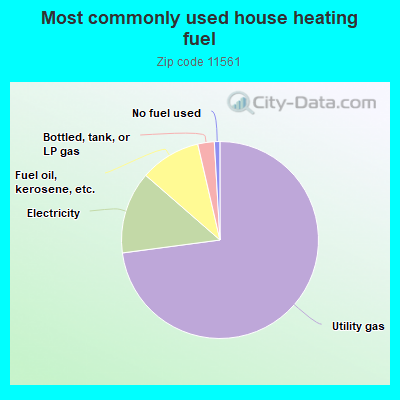
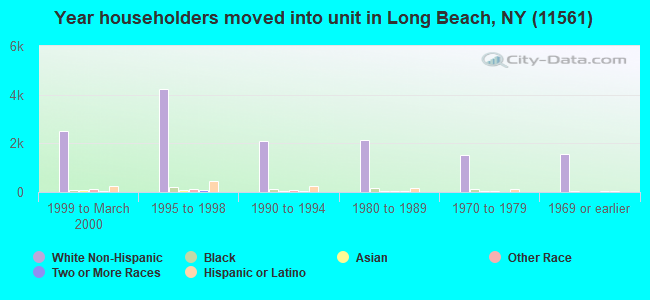
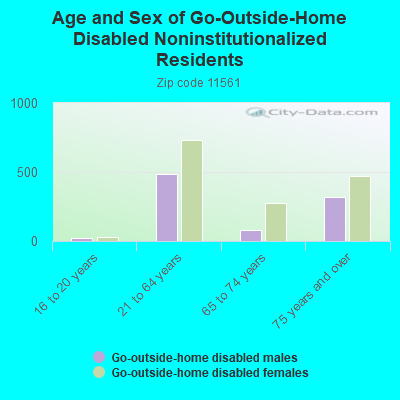
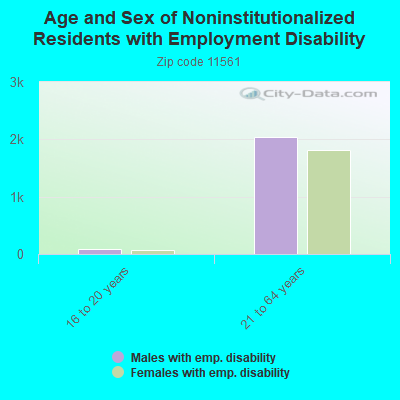
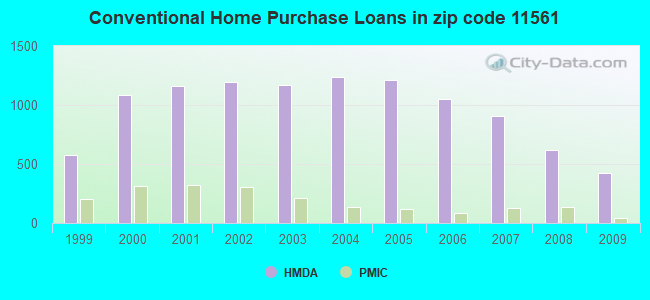
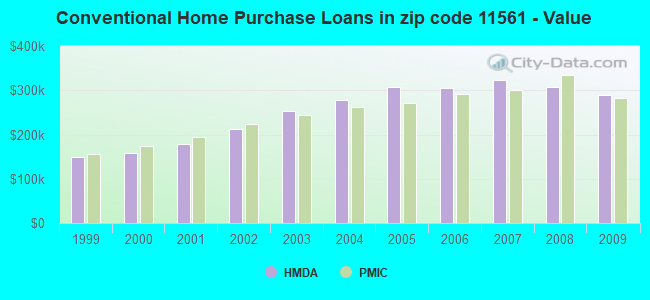
 Based on the data from the years 2002 - 2018 the average number of fire incidents per year is 61. The highest number of reported fires - 137 took place in 2007, and the least - 6 in 2017. The data has a decreasing trend.
 When looking into fire subcategories, the most reports belonged to: Structure Fires (44.7%), and Outside Fires (34.2%).