Estimated zip code population in 2022: 216 Zip code population in 2010: 228 Zip code population in 2000: 265
Houses and condos: 206 Renter-occupied apartments: 7
% of renters here:
9%
State:
46%
March 2022 cost of living index in zip code 12036: 93.7 (less than average, U.S. average is 100)
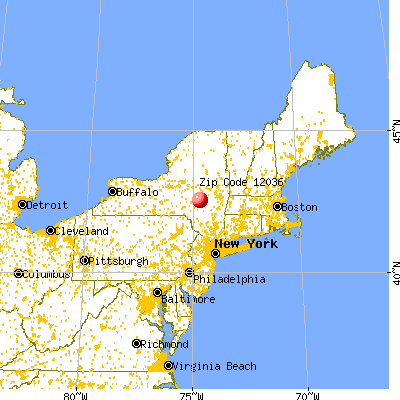
Land area: 7.4 sq. mi. Water area: 0.0 sq. mi.
Population density: 29 people per square mile
(very low).
OSM Map
General Map
Google Map
MSN Map
OSM Map
General Map
Google Map
MSN Map
OSM Map
General Map
Google Map
MSN Map
OSM Map
General Map
Google Map
MSN Map
Please wait while loading the map...
Real estate property taxes paid for housing units in 2022:
This zip code:
2.1% ($2,677)
New York:
1.5% ($6,180)
Median real estate property taxes paid for housing units with mortgages in 2022: $3,252 (2.0%) Median real estate property taxes paid for housing units with no mortgage in 2022: $1,602 (1.4%)
Business Search- 14 Million verified businesses
Males: 100
(46.4%)
Females: 116
(53.6%)
For population 25 years and over in 12036:
High school or higher: 92.2%
Bachelor's degree or higher: 28.6%
Graduate or professional degree: 6.7%
Unemployed: 16.5%
Mean travel time to work (commute): 73.6 minutes
For population 15 years and over in 12036:
Never married: 25.7%
Now married: 54.7%
Separated: 0.0%
Widowed: 2.3%
Divorced: 17.3%
Zip code 12036 compared to state average:
Median household income below state average.
Median house value significantly below state average.
Unemployed percentage significantly above state average.
Black race population percentage significantly below state average.
Hispanic race population percentage significantly below state average.
Median age below state average.
Foreign-born population percentage significantly below state average.
Renting percentage significantly below state average.
Length of stay since moving in below state average.
Number of rooms per house above state average.
Percentage of population with a bachelor's degree or higher below state average.
Estimated median house/condo value in 2022: $125,926
12036:
$125,926
New York:
$400,400
Median resident age:
This zip code:
32.1 years
New York median age:
40.0 years
Average household size:
This zip code:
2.7 people
New York:
2.5 people
Averages for the 2012 tax year for zip code 12036, filed in 2013:
Average Adjusted Gross Income (AGI) in 2012: $42,336 (Individual Income Tax Returns)
Here:
$42,336
State:
$77,088
Salary/wage: $32,400 (reported on 72.7% of returns)
Here:
$32,400
State:
$60,593
(% of AGI for various income ranges: 56.2% for AGIs below $25k, 67.3% for AGIs $25k-50k, 49.8% for AGIs $50k-75k)
Taxable interest for individuals: $325 (reported on 36.4% of returns)
This zip code:
$325
New York:
$3,125
Earned income credit: $2,300 (reported on 18.2% of returns)
Here:
$2,300
State:
$2,230
(% of AGI for various income ranges: 7.6% for AGIs below $25k)
Percentage of individuals using paid preparers for their 2012 taxes: 81.8%
Here:
82%
State:
66%
(% for various income ranges: 75.0% for AGIs below $25k, 75.0% for AGIs $25k-50k, 100.0% for AGIs $50k-75k)
Averages for the 2004 tax year for zip code 12036, filed in 2005:
Average Adjusted Gross Income (AGI) in 2004: $33,016 (Individual Income Tax Returns)
Here:
$33,016
State:
$59,519
Salary/wage: $30,716 (reported on 79.7% of returns)
Here:
$30,716
State:
$50,673
(% of AGI for various income ranges: 112.3% for AGIs below $10k, 73.5% for AGIs $10k-25k, 78.6% for AGIs $25k-50k, 82.8% for AGIs $50k-75k, 62.3% for AGIs $75k-100k)
Taxable interest for individuals: $379 (reported on 51.6% of returns)
This zip code:
$379
New York:
$2,377
(% of AGI for various income ranges: 9.6% for AGIs below $10k, 0.3% for AGIs $10k-25k, 0.7% for AGIs $25k-50k, 0.8% for AGIs $50k-75k)
Taxable dividends: $618 (reported on 26.6% of returns)
Here:
$618
State:
$5,394
(% of AGI for various income ranges: 5.5% for AGIs below $10k, 0.4% for AGIs $10k-25k, 1.6% for AGIs $50k-75k)
Net capital gain/loss: +$417 (reported on 18.8% of returns)
Here:
+$417
State:
+$23,581
Profit/loss from business: +$11,600 (reported on 19.5% of returns)
Here:
+$11,600
State:
+$13,809
Total itemized deductions: $15,286 (22% of AGI, reported on 16.4% of returns)
Here:
$15,286
State:
$25,864
Here:
22.5% of AGI
State:
21.9% of AGI
Charity contributions deductions: $1,188 (2% of AGI, reported on 12.5% of returns)
Here:
$1,188
State:
$4,439
Here:
1.7% of AGI
State:
3.6% of AGI
Total tax: $4,196 (reported on 75.8% of returns)
12036:
$4,196
State:
$11,730
(% of AGI for various income ranges: 6.0% for AGIs $10k-25k, 7.3% for AGIs $25k-50k, 9.2% for AGIs $50k-75k, 14.8% for AGIs $75k-100k)
Earned income credit: $1,407 (reported on 21.1% of returns)
Here:
$1,407
State:
$1,757
Percentage of individuals using paid preparers for their 2004 taxes: 75.0%
Here:
75%
State:
67%
(% for various income ranges: 73.9% for AGIs below $10k, 63.4% for AGIs $10k-25k, 81.1% for AGIs $25k-50k, 78.6% for AGIs $50k-75k, 92.3% for AGIs $75k-100k)
Household received Food Stamps/SNAP in the past 12 months: 27 Household did not receive Food Stamps/SNAP in the past 12 months: 54
Women who had a birth in the past 12 months: 23 (23 now married, 0 unmarried) Women who did not have a birth in the past 12 months: 30 (15 now married, 14 unmarried)
Housing units in zip code 12036 with a mortgage: 40 (6 second mortgage, 6 both second mortgage and home equity loan) Residents with income below the poverty level in 2022:
This zip code:
15.3%
Whole state:
14.3%
Residents with income below 50% of the poverty level in 2022:
This zip code:
7.0%
Whole state:
6.8%
Median number of rooms in houses and condos:
Here:
6.3
State:
6.3
Notable locations in this zip code not listed on our city pages
Size of family households: 6 2-persons, 5 3-persons, 16 4-persons, 2 5-persons, 3 7-or-more-persons
Size of nonfamily households: 45 1-person
45 married couples with children.
0 single-parent households ().
92.4% of residents of 12036 zip code speak English at home.
3.2% of residents speak Spanish at home (100% well).
2.2% of residents speak other Indo-European language at home (100% very well).
1.6% of residents speak Asian or Pacific Island language at home (100% very well).
Foreign born population: 7 (3.3%) (100.0% of them are naturalized citizens)
This zip code:
3.3%
Whole state:
22.7%
50%France
33%Thailand
21%English
19%Italian
16%European
14%Irish
13%American
12%Swedish
4%German
Year of entry for the foreign-born population
02010 or later
02000 to 2009
61990 to 1999
6Before 1990
Housing units lacking complete plumbing facilities: 6.3% Housing units lacking complete kitchen facilities: 6.3%
56.4%Fuel oil, kerosene, etc.
38.0%Wood
7.9%Bottled, tank, or LP gas
Population in 1990: 166. Population change in the 1990s: +99 (+59.6%).
Place of birth for U.S.-born residents:
This state: 148
Northeast: 7
Midwest: 10
South: 32
West: 2
62% of the 12036 zip code residents lived in the same house 5 years ago. Out of people who lived in different houses, 37% lived in this county. Out of people who lived in different counties, 50% lived in New York.
93% of the 12036 zip code residents lived in the same house 1 year ago. Out of people who lived in different houses, 100% moved from different county within same state.
Private vs. public school enrollment:
Students in private schools in grades 1 to 8 (elementary and middle school): 7
Here:
54.8%
New York:
15.6%
Students in private undergraduate colleges:
Here:
0.0%
New York:
39.2%
Top industries in this zip code by the number of employees in 2005:
Professional, Scientific, and Technical Services: Administrative Management and General Management Consulting Services (1-4 employees: 1 establishment)
Real Estate and Rental and Leasing: Lessors of Nonresidential Buildings (except Miniwarehouses) (1-4: 1)
Other Services (except Public Administration): Cemeteries and Crematories (1-4: 1)
Home Mortgage Disclosure Act Aggregated Statistics For Year 2009 (Based on 2 partial tracts)
A) FHA, FSA/RHS & VA Home Purchase Loans
B) Conventional Home Purchase Loans
C) Refinancings
D) Home Improvement Loans
F) Non-occupant Loans on < 5 Family Dwellings (A B C & D)
G) Loans On Manufactured Home Dwelling (A B C & D)
Number
Average Value
Number
Average Value
Number
Average Value
Number
Average Value
Number
Average Value
Number
Average Value
LOANS ORIGINATED
5
$149,786
4
$111,192
9
$112,144
2
$29,415
2
$120,295
1
$77,030
APPLICATIONS APPROVED, NOT ACCEPTED
0
$0
0
$0
2
$91,010
0
$0
0
$0
0
$0
APPLICATIONS DENIED
2
$111,985
3
$94,263
6
$134,493
1
$42,740
1
$85,470
1
$51,180
APPLICATIONS WITHDRAWN
1
$86,000
1
$98,660
4
$110,928
0
$0
0
$0
0
$0
FILES CLOSED FOR INCOMPLETENESS
0
$0
0
$0
2
$87,320
0
$0
1
$32,710
0
$0
Aggregated Statistics For Year 2008 (Based on 2 partial tracts)
A) FHA, FSA/RHS & VA Home Purchase Loans
B) Conventional Home Purchase Loans
C) Refinancings
D) Home Improvement Loans
F) Non-occupant Loans on < 5 Family Dwellings (A B C & D)
G) Loans On Manufactured Home Dwelling (A B C & D)
Number
Average Value
Number
Average Value
Number
Average Value
Number
Average Value
Number
Average Value
Number
Average Value
LOANS ORIGINATED
3
$123,107
7
$115,017
8
$118,314
3
$47,043
2
$94,970
2
$62,650
APPLICATIONS APPROVED, NOT ACCEPTED
0
$0
1
$39,310
3
$108,423
0
$0
0
$0
0
$0
APPLICATIONS DENIED
0
$0
3
$40,450
11
$123,818
4
$22,688
1
$158,280
3
$69,290
APPLICATIONS WITHDRAWN
0
$0
1
$90,220
3
$124,690
0
$0
0
$0
0
$0
FILES CLOSED FOR INCOMPLETENESS
0
$0
0
$0
1
$38,250
0
$0
0
$0
0
$0
Aggregated Statistics For Year 2007 (Based on 2 partial tracts)
A) FHA, FSA/RHS & VA Home Purchase Loans
B) Conventional Home Purchase Loans
C) Refinancings
D) Home Improvement Loans
F) Non-occupant Loans on < 5 Family Dwellings (A B C & D)
G) Loans On Manufactured Home Dwelling (A B C & D)
Number
Average Value
Number
Average Value
Number
Average Value
Number
Average Value
Number
Average Value
Number
Average Value
LOANS ORIGINATED
1
$108,420
9
$116,336
14
$103,579
4
$73,072
6
$96,990
3
$80,987
APPLICATIONS APPROVED, NOT ACCEPTED
1
$40,360
2
$100,770
3
$131,813
1
$102,350
1
$82,830
1
$81,780
APPLICATIONS DENIED
0
$0
4
$134,670
10
$124,962
7
$38,063
2
$66,215
1
$47,750
APPLICATIONS WITHDRAWN
0
$0
1
$115,810
6
$119,370
1
$21,630
1
$141,400
0
$0
FILES CLOSED FOR INCOMPLETENESS
0
$0
0
$0
1
$162,240
0
$0
0
$0
0
$0
Aggregated Statistics For Year 2006 (Based on 2 partial tracts)
A) FHA, FSA/RHS & VA Home Purchase Loans
B) Conventional Home Purchase Loans
C) Refinancings
D) Home Improvement Loans
F) Non-occupant Loans on < 5 Family Dwellings (A B C & D)
G) Loans On Manufactured Home Dwelling (A B C & D)
Number
Average Value
Number
Average Value
Number
Average Value
Number
Average Value
Number
Average Value
Number
Average Value
LOANS ORIGINATED
2
$132,825
11
$93,865
14
$91,464
3
$98,923
3
$80,633
4
$69,710
APPLICATIONS APPROVED, NOT ACCEPTED
0
$0
1
$53,290
4
$120,688
1
$17,150
1
$79,670
1
$37,460
APPLICATIONS DENIED
1
$54,610
2
$113,700
13
$98,032
2
$52,760
1
$117,920
2
$68,590
APPLICATIONS WITHDRAWN
0
$0
1
$110,000
9
$106,722
2
$59,090
1
$31,660
0
$0
FILES CLOSED FOR INCOMPLETENESS
0
$0
0
$0
1
$146,410
0
$0
0
$0
0
$0
Aggregated Statistics For Year 2005 (Based on 2 partial tracts)
A) FHA, FSA/RHS & VA Home Purchase Loans
B) Conventional Home Purchase Loans
C) Refinancings
D) Home Improvement Loans
F) Non-occupant Loans on < 5 Family Dwellings (A B C & D)
G) Loans On Manufactured Home Dwelling (A B C & D)
Number
Average Value
Number
Average Value
Number
Average Value
Number
Average Value
Number
Average Value
Number
Average Value
LOANS ORIGINATED
2
$95,890
13
$108,767
15
$93,051
2
$53,155
4
$125,438
1
$105,520
APPLICATIONS APPROVED, NOT ACCEPTED
0
$0
6
$69,160
3
$83,183
1
$42,210
1
$100,770
1
$53,020
APPLICATIONS DENIED
0
$0
3
$98,397
15
$89,428
3
$29,017
1
$130,580
2
$57,245
APPLICATIONS WITHDRAWN
1
$93,910
1
$82,570
8
$89,000
1
$31,660
0
$0
0
$0
FILES CLOSED FOR INCOMPLETENESS
0
$0
0
$0
3
$142,890
1
$46,690
0
$0
0
$0
Aggregated Statistics For Year 2004 (Based on 2 partial tracts)
A) FHA, FSA/RHS & VA Home Purchase Loans
B) Conventional Home Purchase Loans
C) Refinancings
D) Home Improvement Loans
F) Non-occupant Loans on < 5 Family Dwellings (A B C & D)
G) Loans On Manufactured Home Dwelling (A B C & D)
Number
Average Value
Number
Average Value
Number
Average Value
Number
Average Value
Number
Average Value
Number
Average Value
LOANS ORIGINATED
1
$61,470
9
$104,260
14
$82,193
4
$24,798
2
$121,350
2
$48,275
APPLICATIONS APPROVED, NOT ACCEPTED
0
$0
2
$88,505
3
$93,387
1
$25,060
1
$36,400
1
$37,200
APPLICATIONS DENIED
0
$0
1
$49,860
12
$87,450
4
$44,648
2
$49,460
2
$49,200
APPLICATIONS WITHDRAWN
0
$0
2
$84,680
12
$79,470
0
$0
0
$0
1
$56,450
FILES CLOSED FOR INCOMPLETENESS
0
$0
0
$0
3
$88,110
0
$0
0
$0
0
$0
Aggregated Statistics For Year 2003 (Based on 2 partial tracts)
A) FHA, FSA/RHS & VA Home Purchase Loans
B) Conventional Home Purchase Loans
C) Refinancings
D) Home Improvement Loans
F) Non-occupant Loans on < 5 Family Dwellings (A B C & D)
Number
Average Value
Number
Average Value
Number
Average Value
Number
Average Value
Number
Average Value
LOANS ORIGINATED
1
$108,160
11
$101,155
24
$79,283
4
$21,105
6
$68,368
APPLICATIONS APPROVED, NOT ACCEPTED
0
$0
1
$115,020
2
$75,185
0
$0
1
$48,800
APPLICATIONS DENIED
0
$0
3
$79,667
12
$77,645
1
$24,530
1
$21,900
APPLICATIONS WITHDRAWN
0
$0
1
$108,160
6
$94,308
0
$0
0
$0
FILES CLOSED FOR INCOMPLETENESS
0
$0
0
$0
0
$0
0
$0
0
$0
Aggregated Statistics For Year 2002 (Based on 2 partial tracts)
A) FHA, FSA/RHS & VA Home Purchase Loans
B) Conventional Home Purchase Loans
C) Refinancings
D) Home Improvement Loans
F) Non-occupant Loans on < 5 Family Dwellings (A B C & D)
Number
Average Value
Number
Average Value
Number
Average Value
Number
Average Value
Number
Average Value
LOANS ORIGINATED
2
$78,745
12
$81,910
17
$75,990
3
$21,367
3
$89,603
APPLICATIONS APPROVED, NOT ACCEPTED
0
$0
2
$70,040
3
$84,503
1
$17,410
0
$0
APPLICATIONS DENIED
0
$0
3
$47,043
11
$101,755
2
$27,565
1
$34,820
APPLICATIONS WITHDRAWN
0
$0
1
$98,660
5
$87,898
1
$50,650
0
$0
FILES CLOSED FOR INCOMPLETENESS
0
$0
1
$78,880
1
$62,780
0
$0
0
$0
Aggregated Statistics For Year 2001 (Based on 2 partial tracts)
A) FHA, FSA/RHS & VA Home Purchase Loans
B) Conventional Home Purchase Loans
C) Refinancings
D) Home Improvement Loans
F) Non-occupant Loans on < 5 Family Dwellings (A B C & D)
Number
Average Value
Number
Average Value
Number
Average Value
Number
Average Value
Number
Average Value
LOANS ORIGINATED
2
$99,055
9
$79,140
15
$65,088
2
$18,465
3
$59,003
APPLICATIONS APPROVED, NOT ACCEPTED
0
$0
4
$53,815
3
$79,493
2
$20,050
1
$37,460
APPLICATIONS DENIED
0
$0
6
$56,980
11
$80,459
3
$20,137
0
$0
APPLICATIONS WITHDRAWN
1
$97,080
1
$83,890
6
$54,212
1
$7,390
0
$0
FILES CLOSED FOR INCOMPLETENESS
0
$0
0
$0
1
$65,690
0
$0
0
$0
Aggregated Statistics For Year 2000 (Based on 2 partial tracts)
A) FHA, FSA/RHS & VA Home Purchase Loans
B) Conventional Home Purchase Loans
C) Refinancings
D) Home Improvement Loans
F) Non-occupant Loans on < 5 Family Dwellings (A B C & D)
Number
Average Value
Number
Average Value
Number
Average Value
Number
Average Value
Number
Average Value
LOANS ORIGINATED
2
$64,765
7
$65,310
5
$60,358
2
$13,720
1
$41,680
APPLICATIONS APPROVED, NOT ACCEPTED
0
$0
2
$48,275
2
$49,990
1
$27,440
0
$0
APPLICATIONS DENIED
0
$0
3
$44,757
7
$57,509
4
$15,168
1
$23,740
APPLICATIONS WITHDRAWN
1
$40,360
1
$87,850
6
$37,152
1
$21,900
0
$0
FILES CLOSED FOR INCOMPLETENESS
0
$0
1
$14,510
2
$58,300
0
$0
0
$0
Aggregated Statistics For Year 1999 (Based on 1 partial tract)
A) FHA, FSA/RHS & VA Home Purchase Loans
B) Conventional Home Purchase Loans
C) Refinancings
D) Home Improvement Loans
F) Non-occupant Loans on < 5 Family Dwellings (A B C & D)


 Nearest zip codes: 12093, 12064, 12197, 13786, 12175, 12149.


