Estimated zip code population in 2022: 688 Zip code population in 2010: 797 Zip code population in 2000: 950
Houses and condos: 587 Renter-occupied apartments: 35
% of renters here:
13%
State:
46%
March 2022 cost of living index in zip code 12175: 92.2 (less than average, U.S. average is 100)
Land area: 22.1 sq. mi. Water area: 0.1 sq. mi.
Population density: 31 people per square mile
(very low).
OSM Map
General Map
Google Map
MSN Map
OSM Map
General Map
Google Map
MSN Map
OSM Map
General Map
Google Map
MSN Map
OSM Map
General Map
Google Map
MSN Map
Please wait while loading the map...
Real estate property taxes paid for housing units in 2022:
This zip code:
1.5% ($2,238)
New York:
1.5% ($6,180)
Median real estate property taxes paid for housing units with mortgages in 2022: $2,877 (1.7%) Median real estate property taxes paid for housing units with no mortgage in 2022: $1,882 (1.3%)
Business Search- 14 Million verified businesses
Males: 352
(51.2%)
Females: 336
(48.8%)
For population 25 years and over in 12175:
High school or higher: 96.9%
Bachelor's degree or higher: 25.7%
Graduate or professional degree: 9.3%
Unemployed: 2.6%
Mean travel time to work (commute): 40.1 minutes
For population 15 years and over in 12175:
Never married: 17.4%
Now married: 53.6%
Separated: 0.4%
Widowed: 4.3%
Divorced: 24.4%
Zip code 12175 compared to state average:
Median house value significantly below state average.
Unemployed percentage below state average.
Black race population percentage significantly below state average.
Median age above state average.
Foreign-born population percentage significantly below state average.
Renting percentage significantly below state average.
Length of stay since moving in significantly above state average.
Number of college students significantly below state average.
Averages for the 2020 tax year for zip code 12175, filed in 2021:
Average Adjusted Gross Income (AGI) in 2020: $60,340 (Individual Income Tax Returns)
Here:
$60,340
State:
$90,930
Salary/wage: $53,328 (reported on 71.4% of returns)
Here:
$53,328
State:
$72,104
(% of AGI for various income ranges: 1070.0% for AGIs below $25k, 2437.1% for AGIs $25k-50k, 5407.5% for AGIs $50k-75k, 8836.7% for AGIs $75k-100k, 20210.0% for AGIs $100k-200k)
Taxable interest for individuals: $300 (reported on 37.1% of returns)
This zip code:
$300
New York:
$3,075
(% of AGI for various income ranges: 2.9% for AGIs below $25k, 7.1% for AGIs $25k-50k, 25.0% for AGIs $50k-75k, 16.7% for AGIs $75k-100k, 56.7% for AGIs $100k-200k)
Ordinary dividends: $1,117 (reported on 17.1% of returns)
Here:
$1,117
State:
$11,095
(% of AGI for various income ranges: 44.3% for AGIs $25k-50k, 120.0% for AGIs $75k-100k)
Net capital gain/loss in AGI: +$5,060 (reported on 14.3% of returns)
Here:
+$5,060
State:
+$44,925
(% of AGI for various income ranges: 54.3% for AGIs below $25k, 716.7% for AGIs $75k-100k)
Profit/loss from business: +$8,140 (reported on 14.3% of returns)
Here:
+$8,140
State:
+$14,940
(% of AGI for various income ranges: 1017.5% for AGIs $50k-75k)
Taxable individual retirement arrangement distribution: $8,967 (reported on 8.6% of returns)
12175:
$8,967
New York:
$19,609
(% of AGI for various income ranges: 672.5% for AGIs $50k-75k)
Earned income credit: $1,900 (reported on 11.4% of returns)
Here:
$1,900
State:
$2,138
(% of AGI for various income ranges: 108.6% for AGIs below $25k)
Percentage of individuals using paid preparers for their 2020 taxes: 97.1%
Here:
97%
State:
95%
(% for various income ranges: 90.9% for AGIs below $25k, 100.0% for AGIs $25k-50k, 100.0% for AGIs $50k-75k, 100.0% for AGIs $75k-100k, 100.0% for AGIs $100k-200k)
Averages for the 2012 tax year for zip code 12175, filed in 2013:
Average Adjusted Gross Income (AGI) in 2012: $45,200 (Individual Income Tax Returns)
Here:
$45,200
State:
$77,088
Salary/wage: $40,342 (reported on 74.3% of returns)
Here:
$40,342
State:
$60,593
(% of AGI for various income ranges: 53.7% for AGIs below $25k, 61.4% for AGIs $25k-50k, 70.0% for AGIs $50k-75k, 60.8% for AGIs $75k-100k, 76.7% for AGIs $100k-200k)
Taxable interest for individuals: $560 (reported on 42.9% of returns)
This zip code:
$560
New York:
$3,125
(% of AGI for various income ranges: 0.8% for AGIs below $25k, 1.1% for AGIs $25k-50k, 0.6% for AGIs $50k-75k, 0.2% for AGIs $75k-100k, 0.1% for AGIs $100k-200k)
Ordinary dividends: $1,733 (reported on 25.7% of returns)
Here:
$1,733
State:
$10,299
(% of AGI for various income ranges: 3.0% for AGIs below $25k, 1.3% for AGIs $25k-50k, 2.0% for AGIs $75k-100k)
Profit/loss from business: +$3,225 (reported on 11.4% of returns)
Here:
+$3,225
State:
+$16,168
Taxable individual retirement arrangement distribution: $5,967 (reported on 8.6% of returns)
12175:
$5,967
New York:
$17,621
Total itemized deductions: $16,090 (22% of AGI, reported on 28.6% of returns)
Here:
$16,090
State:
$34,985
Here:
21.8% of AGI
State:
21.3% of AGI
(% of AGI for various income ranges: 20.7% for AGIs below $25k, 19.3% for AGIs $50k-75k, 13.8% for AGIs $100k-200k)
Charity contributions: $1,629 (reported on 20.0% of returns)
Here:
$1,629
State:
$5,572
Taxes paid: $8,180 (reported on 28.6% of returns)
12175:
$8,180
State:
$18,656
(% of AGI for various income ranges: 8.2% for AGIs below $25k, 9.7% for AGIs $50k-75k, 8.1% for AGIs $100k-200k)
Earned income credit: $1,483 (reported on 17.1% of returns)
Here:
$1,483
State:
$2,230
(% of AGI for various income ranges: 5.5% for AGIs below $25k)
Percentage of individuals using paid preparers for their 2012 taxes: 62.9%
Here:
63%
State:
66%
(% for various income ranges: 53.8% for AGIs below $25k, 66.7% for AGIs $25k-50k, 83.3% for AGIs $50k-75k, 100.0% for AGIs $75k-100k)
Averages for the 2004 tax year for zip code 12175, filed in 2005:
Average Adjusted Gross Income (AGI) in 2004: $38,783 (Individual Income Tax Returns)
Here:
$38,783
State:
$59,519
Salary/wage: $33,479 (reported on 78.0% of returns)
Here:
$33,479
State:
$50,673
(% of AGI for various income ranges: 100.0% for AGIs below $10k, 63.4% for AGIs $10k-25k, 66.3% for AGIs $25k-50k, 73.8% for AGIs $50k-75k, 81.3% for AGIs $75k-100k, 48.0% for AGIs over 100k)
Taxable interest for individuals: $881 (reported on 59.9% of returns)
This zip code:
$881
New York:
$2,377
(% of AGI for various income ranges: 5.3% for AGIs below $10k, 3.2% for AGIs $10k-25k, 1.1% for AGIs $25k-50k, 0.8% for AGIs $50k-75k, 0.9% for AGIs $75k-100k, 1.7% for AGIs over 100k)
Taxable dividends: $1,253 (reported on 24.6% of returns)
Here:
$1,253
State:
$5,394
(% of AGI for various income ranges: 1.9% for AGIs $10k-25k, 1.0% for AGIs $25k-50k, 0.9% for AGIs $50k-75k, 0.4% for AGIs $75k-100k, 0.3% for AGIs over 100k)
Net capital gain/loss: +$5,197 (reported on 18.1% of returns)
Here:
+$5,197
State:
+$23,581
(% of AGI for various income ranges: 1.6% for AGIs $10k-25k, 0.4% for AGIs $25k-50k, 2.5% for AGIs $50k-75k, 9.5% for AGIs $75k-100k)
Profit/loss from business: +$4,647 (reported on 15.1% of returns)
Here:
+$4,647
State:
+$13,809
Total itemized deductions: $15,259 (24% of AGI, reported on 33.2% of returns)
Here:
$15,259
State:
$25,864
Here:
23.6% of AGI
State:
21.9% of AGI
(% of AGI for various income ranges: 67.0% for AGIs below $10k, 13.7% for AGIs $25k-50k, 14.8% for AGIs $50k-75k, 12.0% for AGIs $75k-100k, 12.7% for AGIs over 100k)
Charity contributions deductions: $1,763 (3% of AGI, reported on 27.6% of returns)
Here:
$1,763
State:
$4,439
Here:
2.6% of AGI
State:
3.6% of AGI
(% of AGI for various income ranges: 1.1% for AGIs $25k-50k, 2.1% for AGIs $50k-75k, 1.2% for AGIs $75k-100k, 1.0% for AGIs over 100k)
Total tax: $4,687 (reported on 74.8% of returns)
12175:
$4,687
State:
$11,730
(% of AGI for various income ranges: 2.9% for AGIs below $10k, 4.0% for AGIs $10k-25k, 6.4% for AGIs $25k-50k, 7.4% for AGIs $50k-75k, 11.5% for AGIs $75k-100k, 16.1% for AGIs over 100k)
Earned income credit: $1,588 (reported on 15.1% of returns)
Here:
$1,588
State:
$1,757
Percentage of individuals using paid preparers for their 2004 taxes: 69.4%
Here:
69%
State:
67%
(% for various income ranges: 56.9% for AGIs below $10k, 71.6% for AGIs $10k-25k, 75.7% for AGIs $25k-50k, 64.8% for AGIs $50k-75k, 76.0% for AGIs $75k-100k, 75.0% for AGIs over 100k)
Household received Food Stamps/SNAP in the past 12 months: 13 Household did not receive Food Stamps/SNAP in the past 12 months: 267
Women who had a birth in the past 12 months: 10 (10 now married, 0 unmarried) Women who did not have a birth in the past 12 months: 124 (41 now married, 83 unmarried)
Housing units in zip code 12175 with a mortgage: 93 (14 second mortgage, 10 home equity loan, 1 both second mortgage and home equity loan) Median monthly owner costs for units with a mortgage: $1,314 Median monthly owner costs for units without a mortgage: $474
Residents with income below the poverty level in 2022:
This zip code:
3.5%
Whole state:
14.3%
Residents with income below 50% of the poverty level in 2022:
This zip code:
2.3%
Whole state:
6.8%
Median number of rooms in houses and condos:
Here:
5.1
State:
6.3
Median number of rooms in apartments:
Here:
6.8
State:
3.8
Notable locations in this zip code not listed on our city pages
Size of family households: 107 2-persons, 11 3-persons, 27 4-persons, 14 5-persons, 15 6-persons, 3 7-or-more-persons
Size of nonfamily households: 86 1-person, 20 2-persons
124 married couples with children.
30 single-parent households (4 men, 26 women).
91.4% of residents of 12175 zip code speak English at home.
8.0% of residents speak Spanish at home (77% very well, 23% well).
0.6% of residents speak other Indo-European language at home (100% very well).
0.6% of residents speak Asian or Pacific Island language at home (100% very well).
Foreign born population: 7 (1.0%) (100.0% of them are naturalized citizens)
This zip code:
1.0%
Whole state:
22.7%
117%Dominica
12%American
12%Polish
11%European
11%Irish
4%German
3%English
3%Hungarian
Year of entry for the foreign-born population
32010 or later
02000 to 2009
01990 to 1999
13Before 1990
Housing units lacking complete plumbing facilities: 10.2% Housing units lacking complete kitchen facilities: 5.9%
40.6%Wood
31.5%Fuel oil, kerosene, etc.
9.4%Bottled, tank, or LP gas
7.6%Electricity
4.7%Utility gas
2.9%Coal or coke
2.9%Other fuel
1.5%No fuel used
Population in 1990: 1,247.
Place of birth for U.S.-born residents:
This state: 549
Northeast: 84
Midwest: 11
South: 7
West: 18
50% of the 12175 zip code residents lived in the same house 5 years ago. Out of people who lived in different houses, 51% lived in this county. Out of people who lived in different counties, 50% lived in New York.
93% of the 12175 zip code residents lived in the same house 1 year ago. Out of people who lived in different houses, 31% moved from this county. Out of people who lived in different houses, 67% moved from different county within same state.
Private vs. public school enrollment:
Students in private schools in grades 1 to 8 (elementary and middle school):
Here:
0.0%
New York:
15.6%
Students in private schools in grades 9 to 12 (high school): 4
Here:
28.0%
New York:
15.0%
Occupation by median earnings in the past 12 months ($)
86,159Construction and extraction occupations
52,860Installation, maintenance, and repair occupations
50,728Office and administrative support occupations
44,569Education, training, and library occupations
32,538Transportation occupations
27,994Management occupations
Top industries in this zip code by the number of employees in 2005:
Other Services (except Public Administration): Religious Organizations (1-4 employees: 1 establishment)
Construction: Residential Remodelers (1-4: 1)
Administrative and Support and Waste Management and Remediation Services: Locksmiths (1-4: 1)
Real Estate and Rental and Leasing: Lessors of Residential Buildings and Dwellings (1-4: 1)
Accommodation and Food Services: Full-Service Restaurants (1-4: 1)
Finance and Insurance: Real Estate Credit (1-4: 1)
Construction: Poured Concrete Foundation and Structure Contractors (1-4: 1)
People in group quarters in 2010:
134 people in state prisons
People in group quarters in 2000:
234 people in state prisons
4 people in other group homes
Fatal accident statistics in 2011:
Fatal accident count: 1
Vehicles involved in fatal accidents: 1
Fatal accidents caused by drunken drivers: 1
Fatalities: 1
Persons involved in fatal accidents: 1
Pedestrians involved in fatal accidents: 0
Home Mortgage Disclosure Act Aggregated Statistics For Year 2009 (Based on 2 partial tracts)
A) FHA, FSA/RHS & VA Home Purchase Loans
B) Conventional Home Purchase Loans
C) Refinancings
D) Home Improvement Loans
F) Non-occupant Loans on < 5 Family Dwellings (A B C & D)
G) Loans On Manufactured Home Dwelling (A B C & D)
Number
Average Value
Number
Average Value
Number
Average Value
Number
Average Value
Number
Average Value
Number
Average Value
LOANS ORIGINATED
10
$146,947
8
$109,084
19
$104,228
4
$28,855
5
$94,410
2
$75,570
APPLICATIONS APPROVED, NOT ACCEPTED
0
$0
1
$19,670
4
$89,285
0
$0
0
$0
1
$19,670
APPLICATIONS DENIED
3
$146,480
6
$92,478
12
$131,945
2
$41,925
2
$83,850
2
$50,205
APPLICATIONS WITHDRAWN
1
$168,740
1
$193,580
7
$124,371
1
$41,410
0
$0
1
$20,700
FILES CLOSED FOR INCOMPLETENESS
1
$85,400
1
$35,710
3
$114,217
0
$0
1
$64,180
0
$0
Aggregated Statistics For Year 2008 (Based on 2 partial tracts)
A) FHA, FSA/RHS & VA Home Purchase Loans
B) Conventional Home Purchase Loans
C) Refinancings
D) Home Improvement Loans
F) Non-occupant Loans on < 5 Family Dwellings (A B C & D)
G) Loans On Manufactured Home Dwelling (A B C & D)
Number
Average Value
Number
Average Value
Number
Average Value
Number
Average Value
Number
Average Value
Number
Average Value
LOANS ORIGINATED
5
$144,928
13
$121,517
16
$116,072
6
$46,153
4
$93,168
5
$49,172
APPLICATIONS APPROVED, NOT ACCEPTED
1
$83,330
1
$77,120
5
$127,640
0
$0
1
$22,770
0
$0
APPLICATIONS DENIED
1
$46,070
6
$39,683
22
$121,471
8
$22,256
3
$103,520
7
$58,267
APPLICATIONS WITHDRAWN
0
$0
2
$88,510
6
$122,327
0
$0
1
$54,350
1
$78,680
FILES CLOSED FOR INCOMPLETENESS
0
$0
1
$46,070
1
$75,050
0
$0
1
$46,070
0
$0
Aggregated Statistics For Year 2007 (Based on 2 partial tracts)
A) FHA, FSA/RHS & VA Home Purchase Loans
B) Conventional Home Purchase Loans
C) Refinancings
D) Home Improvement Loans
F) Non-occupant Loans on < 5 Family Dwellings (A B C & D)
G) Loans On Manufactured Home Dwelling (A B C & D)
Number
Average Value
Number
Average Value
Number
Average Value
Number
Average Value
Number
Average Value
Number
Average Value
LOANS ORIGINATED
1
$212,730
18
$114,131
28
$101,616
8
$71,688
11
$103,803
5
$95,342
APPLICATIONS APPROVED, NOT ACCEPTED
1
$79,190
3
$131,817
7
$110,840
2
$100,415
2
$81,265
2
$80,230
APPLICATIONS DENIED
1
$66,770
8
$132,118
20
$122,594
13
$40,214
3
$86,613
1
$93,690
APPLICATIONS WITHDRAWN
1
$15,530
2
$113,615
11
$127,753
2
$21,220
2
$138,715
1
$24,330
FILES CLOSED FOR INCOMPLETENESS
0
$0
0
$0
2
$159,160
0
$0
0
$0
0
$0
Aggregated Statistics For Year 2006 (Based on 2 partial tracts)
A) FHA, FSA/RHS & VA Home Purchase Loans
B) Conventional Home Purchase Loans
C) Refinancings
D) Home Improvement Loans
F) Non-occupant Loans on < 5 Family Dwellings (A B C & D)
G) Loans On Manufactured Home Dwelling (A B C & D)
Number
Average Value
Number
Average Value
Number
Average Value
Number
Average Value
Number
Average Value
Number
Average Value
LOANS ORIGINATED
4
$130,305
21
$96,471
27
$93,053
6
$97,050
7
$67,806
7
$78,157
APPLICATIONS APPROVED, NOT ACCEPTED
0
$0
2
$52,280
8
$118,401
2
$16,820
2
$78,160
2
$36,750
APPLICATIONS DENIED
2
$53,570
4
$111,542
26
$96,174
4
$51,760
2
$115,685
5
$53,830
APPLICATIONS WITHDRAWN
0
$0
2
$107,920
18
$104,699
3
$77,293
1
$62,110
1
$56,940
FILES CLOSED FOR INCOMPLETENESS
0
$0
1
$19,670
3
$95,757
0
$0
1
$27,430
0
$0
Aggregated Statistics For Year 2005 (Based on 2 partial tracts)
A) FHA, FSA/RHS & VA Home Purchase Loans
B) Conventional Home Purchase Loans
C) Refinancings
D) Home Improvement Loans
E) Loans on Dwellings For 5+ Families
F) Non-occupant Loans on < 5 Family Dwellings (A B C & D)
G) Loans On Manufactured Home Dwelling (A B C & D)
Number
Average Value
Number
Average Value
Number
Average Value
Number
Average Value
Number
Average Value
Number
Average Value
Number
Average Value
LOANS ORIGINATED
4
$94,075
25
$110,974
30
$91,287
4
$52,148
1
$49,690
7
$140,640
2
$103,520
APPLICATIONS APPROVED, NOT ACCEPTED
0
$0
11
$74,016
5
$97,930
2
$41,410
0
$0
2
$98,860
2
$52,020
APPLICATIONS DENIED
1
$76,600
7
$82,741
29
$90,759
6
$28,468
0
$0
2
$128,105
4
$56,160
APPLICATIONS WITHDRAWN
2
$92,135
3
$54,003
16
$87,312
1
$62,110
0
$0
1
$25,880
0
$0
FILES CLOSED FOR INCOMPLETENESS
0
$0
0
$0
6
$140,183
1
$91,620
0
$0
0
$0
0
$0
Aggregated Statistics For Year 2004 (Based on 2 partial tracts)
A) FHA, FSA/RHS & VA Home Purchase Loans
B) Conventional Home Purchase Loans
C) Refinancings
D) Home Improvement Loans
F) Non-occupant Loans on < 5 Family Dwellings (A B C & D)
G) Loans On Manufactured Home Dwelling (A B C & D)
Number
Average Value
Number
Average Value
Number
Average Value
Number
Average Value
Number
Average Value
Number
Average Value
LOANS ORIGINATED
2
$60,300
19
$96,900
27
$83,621
7
$27,803
4
$119,048
4
$47,360
APPLICATIONS APPROVED, NOT ACCEPTED
1
$46,070
4
$86,828
6
$91,615
1
$49,170
1
$71,430
2
$36,490
APPLICATIONS DENIED
1
$32,610
1
$97,830
23
$89,522
7
$50,060
3
$64,700
3
$64,353
APPLICATIONS WITHDRAWN
0
$0
3
$110,767
23
$81,353
1
$12,420
1
$53,830
1
$110,770
FILES CLOSED FOR INCOMPLETENESS
0
$0
0
$0
5
$103,728
0
$0
1
$49,170
0
$0
Aggregated Statistics For Year 2003 (Based on 2 partial tracts)
A) FHA, FSA/RHS & VA Home Purchase Loans
B) Conventional Home Purchase Loans
C) Refinancings
D) Home Improvement Loans
F) Non-occupant Loans on < 5 Family Dwellings (A B C & D)
Number
Average Value
Number
Average Value
Number
Average Value
Number
Average Value
Number
Average Value
LOANS ORIGINATED
3
$70,740
22
$99,238
48
$77,780
7
$23,661
11
$73,170
APPLICATIONS APPROVED, NOT ACCEPTED
0
$0
2
$112,835
5
$59,006
0
$0
1
$95,760
APPLICATIONS DENIED
0
$0
6
$78,158
23
$79,485
3
$16,047
1
$42,960
APPLICATIONS WITHDRAWN
1
$37,780
2
$106,110
12
$92,521
0
$0
1
$93,170
FILES CLOSED FOR INCOMPLETENESS
0
$0
1
$19,150
1
$35,710
1
$27,430
0
$0
Aggregated Statistics For Year 2002 (Based on 2 partial tracts)
A) FHA, FSA/RHS & VA Home Purchase Loans
B) Conventional Home Purchase Loans
C) Refinancings
D) Home Improvement Loans
F) Non-occupant Loans on < 5 Family Dwellings (A B C & D)
Number
Average Value
Number
Average Value
Number
Average Value
Number
Average Value
Number
Average Value
LOANS ORIGINATED
4
$77,252
23
$83,851
34
$74,550
5
$25,156
7
$75,347
APPLICATIONS APPROVED, NOT ACCEPTED
0
$0
3
$91,617
5
$99,482
2
$17,080
0
$0
APPLICATIONS DENIED
1
$42,960
5
$55,384
22
$99,826
3
$36,060
1
$68,320
APPLICATIONS WITHDRAWN
1
$34,680
2
$96,790
10
$86,232
2
$49,690
1
$31,060
FILES CLOSED FOR INCOMPLETENESS
0
$0
2
$77,380
2
$61,595
0
$0
0
$0
Aggregated Statistics For Year 2001 (Based on 2 partial tracts)
A) FHA, FSA/RHS & VA Home Purchase Loans
B) Conventional Home Purchase Loans
C) Refinancings
D) Home Improvement Loans
F) Non-occupant Loans on < 5 Family Dwellings (A B C & D)
Number
Average Value
Number
Average Value
Number
Average Value
Number
Average Value
Number
Average Value
LOANS ORIGINATED
5
$77,744
19
$73,554
28
$68,416
5
$14,492
6
$57,885
APPLICATIONS APPROVED, NOT ACCEPTED
0
$0
7
$60,337
7
$66,844
3
$26,227
2
$36,750
APPLICATIONS DENIED
0
$0
11
$60,983
21
$82,693
6
$19,755
1
$67,290
APPLICATIONS WITHDRAWN
3
$63,493
2
$82,300
11
$58,018
1
$14,490
0
$0
FILES CLOSED FOR INCOMPLETENESS
0
$0
1
$34,160
2
$64,440
0
$0
0
$0
Aggregated Statistics For Year 2000 (Based on 2 partial tracts)
A) FHA, FSA/RHS & VA Home Purchase Loans
B) Conventional Home Purchase Loans
C) Refinancings
D) Home Improvement Loans
F) Non-occupant Loans on < 5 Family Dwellings (A B C & D)
Number
Average Value
Number
Average Value
Number
Average Value
Number
Average Value
Number
Average Value
LOANS ORIGINATED
3
$84,713
13
$69,000
10
$59,213
4
$13,458
2
$40,890
APPLICATIONS APPROVED, NOT ACCEPTED
1
$42,960
4
$47,360
5
$39,234
3
$17,943
1
$17,600
APPLICATIONS DENIED
0
$0
6
$43,910
14
$56,419
8
$14,881
1
$46,580
APPLICATIONS WITHDRAWN
2
$39,595
2
$86,180
11
$39,761
3
$14,320
0
$0
FILES CLOSED FOR INCOMPLETENESS
0
$0
1
$28,470
5
$45,756
1
$5,180
1
$7,760
Aggregated Statistics For Year 1999 (Based on 1 partial tract)
A) FHA, FSA/RHS & VA Home Purchase Loans
B) Conventional Home Purchase Loans
C) Refinancings
D) Home Improvement Loans
F) Non-occupant Loans on < 5 Family Dwellings (A B C & D)

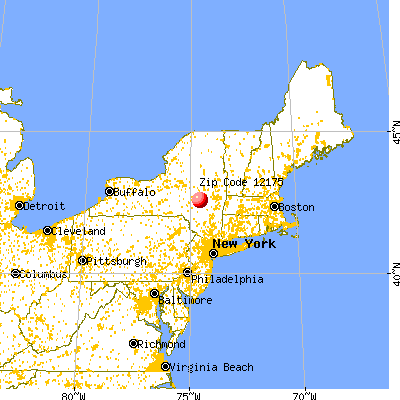


 Nearest zip codes: 12149, 12093, 12194, 12036, 12187, 12064.


