Estimated zip code population in 2022: 2,932 Zip code population in 2010: 2,938 Zip code population in 2000: 2,854
Houses and condos: 1,530 Renter-occupied apartments: 30
% of renters here:
2%
State:
46%
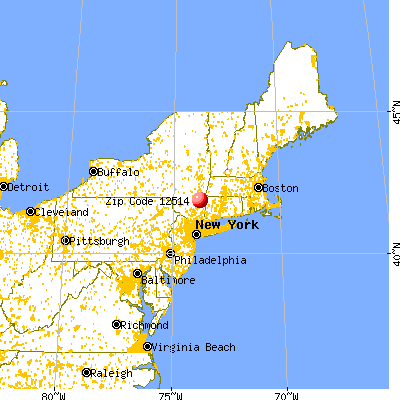
March 2022 cost of living index in zip code 12514: 112.1 (more than average, U.S. average is 100)
Land area: 26.6 sq. mi. Water area: 0.3 sq. mi.
Population density: 110 people per square mile
(very low).
OSM Map
General Map
Google Map
MSN Map
OSM Map
General Map
Google Map
MSN Map
OSM Map
General Map
Google Map
MSN Map
OSM Map
General Map
Google Map
MSN Map
Please wait while loading the map...
Real estate property taxes paid for housing units in 2022:
This zip code:
1.6% ($6,324)
New York:
1.5% ($6,180)
Median real estate property taxes paid for housing units with mortgages in 2022: $6,275 (1.7%) Median real estate property taxes paid for housing units with no mortgage in 2022: $6,621 (1.4%)
Business Search- 14 Million verified businesses
Males: 1,517
(51.8%)
Females: 1,414
(48.2%)
For population 25 years and over in 12514:
High school or higher: 88.4%
Bachelor's degree or higher: 53.4%
Graduate or professional degree: 23.8%
Unemployed: 1.5%
Mean travel time to work (commute): 37.3 minutes
For population 15 years and over in 12514:
Never married: 20.3%
Now married: 71.6%
Separated: 0.3%
Widowed: 3.0%
Divorced: 4.9%
Zip code 12514 compared to state average:
Unemployed percentage significantly below state average.
Black race population percentage significantly below state average.
Hispanic race population percentage significantly below state average.
Median age significantly above state average.
Foreign-born population percentage significantly below state average.
Renting percentage significantly below state average.
Length of stay since moving in significantly above state average.
Number of rooms per house above state average.
Number of college students below state average.
Percentage of population with a bachelor's degree or higher above state average.
Estimated median house/condo value in 2022: $393,520
12514:
$393,520
New York:
$400,400
According to our research of New York and other state lists, there were 4 registered sex offenders living in 12514 zip code as of June 08, 2024. The ratio of all residents to sex offenders in zip code 12514 is 807 to 1. The ratio of registered sex offenders to all residents in this zip code is near the state average.
Median resident age:
This zip code:
59.4 years
New York median age:
40.0 years
Average household size:
This zip code:
2.2 people
New York:
2.5 people
Averages for the 2020 tax year for zip code 12514, filed in 2021:
Average Adjusted Gross Income (AGI) in 2020: $119,570 (Individual Income Tax Returns)
Here:
$119,570
State:
$90,930
Salary/wage: $100,007 (reported on 77.0% of returns)
Here:
$100,007
State:
$72,104
(% of AGI for various income ranges: 1261.7% for AGIs below $25k, 3425.3% for AGIs $25k-50k, 6500.0% for AGIs $50k-75k, 9447.0% for AGIs $75k-100k, 16648.5% for AGIs $100k-200k, 99408.0% for AGIs over 200k)
Taxable interest for individuals: $1,793 (reported on 54.0% of returns)
This zip code:
$1,793
New York:
$3,075
(% of AGI for various income ranges: 20.6% for AGIs below $25k, 52.0% for AGIs $25k-50k, 88.2% for AGIs $50k-75k, 129.0% for AGIs $75k-100k, 141.5% for AGIs $100k-200k, 1442.0% for AGIs over 200k)
Ordinary dividends: $8,980 (reported on 36.7% of returns)
Here:
$8,980
State:
$11,095
(% of AGI for various income ranges: 105.6% for AGIs below $25k, 55.3% for AGIs $25k-50k, 247.3% for AGIs $50k-75k, 182.0% for AGIs $75k-100k, 474.0% for AGIs $100k-200k, 5810.0% for AGIs over 200k)
Net capital gain/loss in AGI: +$22,795 (reported on 28.8% of returns)
Here:
+$22,795
State:
+$44,925
(% of AGI for various income ranges: 2.2% for AGIs below $25k, 78.7% for AGIs $25k-50k, 118.2% for AGIs $50k-75k, 333.0% for AGIs $75k-100k, 439.5% for AGIs $100k-200k, 15308.0% for AGIs over 200k)
Profit/loss from business: +$16,612 (reported on 18.0% of returns)
Here:
+$16,612
State:
+$14,940
(% of AGI for various income ranges: 166.7% for AGIs below $25k, 230.0% for AGIs $25k-50k, 250.0% for AGIs $50k-75k, 410.0% for AGIs $75k-100k, 484.5% for AGIs $100k-200k, 3708.0% for AGIs over 200k)
Taxable individual retirement arrangement distribution: $25,156 (reported on 12.9% of returns)
12514:
$25,156
New York:
$19,609
(% of AGI for various income ranges: 66.1% for AGIs below $25k, 177.3% for AGIs $25k-50k, 332.7% for AGIs $50k-75k, 384.0% for AGIs $75k-100k, 928.5% for AGIs $100k-200k, 3072.0% for AGIs over 200k)
Self-employed (Keogh) retirement plans: $25,900 (reported on 2.2% of returns)
12514:
$25,900
New York:
$32,497
(% of AGI for various income ranges: 388.5% for AGIs $100k-200k)
Total itemized deductions: $30,982 (reported on 15.8% of returns)
Here:
$30,982
State:
$39,326
(% of AGI for various income ranges: 331.7% for AGIs below $25k, 678.2% for AGIs $50k-75k, 782.0% for AGIs $75k-100k, 1013.0% for AGIs $100k-200k, 5330.0% for AGIs over 200k)
Charity contributions: $8,279 (reported on 13.7% of returns)
Here:
$8,279
State:
$15,420
(% of AGI for various income ranges: 113.6% for AGIs $50k-75k, 139.0% for AGIs $75k-100k, 227.0% for AGIs $100k-200k, 1710.0% for AGIs over 200k)
Taxes paid: $9,150 (reported on 15.8% of returns)
12514:
$9,150
State:
$9,183
(% of AGI for various income ranges: 68.3% for AGIs below $25k, 251.8% for AGIs $50k-75k, 298.0% for AGIs $75k-100k, 333.5% for AGIs $100k-200k, 1296.0% for AGIs over 200k)
Earned income credit: $1,540 (reported on 7.2% of returns)
Here:
$1,540
State:
$2,138
(% of AGI for various income ranges: 59.4% for AGIs below $25k, 31.3% for AGIs $25k-50k)
Percentage of individuals using paid preparers for their 2020 taxes: 94.2%
Here:
94%
State:
95%
(% for various income ranges: 93.8% for AGIs below $25k, 95.5% for AGIs $25k-50k, 94.4% for AGIs $50k-75k, 94.1% for AGIs $75k-100k, 94.1% for AGIs $100k-200k, 93.8% for AGIs over 200k)
Averages for the 2012 tax year for zip code 12514, filed in 2013:
Average Adjusted Gross Income (AGI) in 2012: $81,086 (Individual Income Tax Returns)
Here:
$81,086
State:
$77,088
Salary/wage: $68,609 (reported on 79.1% of returns)
Here:
$68,609
State:
$60,593
(% of AGI for various income ranges: 62.3% for AGIs below $25k, 66.7% for AGIs $25k-50k, 68.0% for AGIs $50k-75k, 67.1% for AGIs $75k-100k, 75.1% for AGIs $100k-200k, 57.5% for AGIs over 200k)
Taxable interest for individuals: $1,929 (reported on 56.0% of returns)
This zip code:
$1,929
New York:
$3,125
(% of AGI for various income ranges: 2.1% for AGIs below $25k, 2.4% for AGIs $25k-50k, 1.0% for AGIs $50k-75k, 0.7% for AGIs $75k-100k, 0.9% for AGIs $100k-200k, 1.9% for AGIs over 200k)
Ordinary dividends: $7,433 (reported on 34.3% of returns)
Here:
$7,433
State:
$10,299
(% of AGI for various income ranges: 3.3% for AGIs below $25k, 1.7% for AGIs $25k-50k, 2.5% for AGIs $50k-75k, 1.3% for AGIs $75k-100k, 2.3% for AGIs $100k-200k, 5.5% for AGIs over 200k)
Net capital gain/loss in AGI: +$9,132 (reported on 25.4% of returns)
Here:
+$9,132
State:
+$42,474
(% of AGI for various income ranges: 0.9% for AGIs $25k-50k, 1.2% for AGIs $50k-75k, 0.1% for AGIs $75k-100k, 1.1% for AGIs $100k-200k, 7.8% for AGIs over 200k)
Profit/loss from business: +$13,504 (reported on 19.4% of returns)
Here:
+$13,504
State:
+$16,168
(% of AGI for various income ranges: 11.5% for AGIs below $25k, 4.3% for AGIs $25k-50k, 4.5% for AGIs $50k-75k, 3.4% for AGIs $75k-100k, 1.5% for AGIs $100k-200k, 3.3% for AGIs over 200k)
Taxable individual retirement arrangement distribution: $16,278 (reported on 13.4% of returns)
12514:
$16,278
New York:
$17,621
(% of AGI for various income ranges: 2.7% for AGIs below $25k, 3.4% for AGIs $25k-50k, 3.0% for AGIs $50k-75k, 3.4% for AGIs $75k-100k, 4.5% for AGIs $100k-200k)
Total itemized deductions: $30,391 (24% of AGI, reported on 51.5% of returns)
Here:
$30,391
State:
$34,985
Here:
23.9% of AGI
State:
21.3% of AGI
(% of AGI for various income ranges: 19.9% for AGIs below $25k, 15.5% for AGIs $25k-50k, 20.1% for AGIs $50k-75k, 17.0% for AGIs $75k-100k, 19.3% for AGIs $100k-200k, 20.9% for AGIs over 200k)
Charity contributions: $3,256 (reported on 44.0% of returns)
Here:
$3,256
State:
$5,572
(% of AGI for various income ranges: 1.2% for AGIs below $25k, 1.2% for AGIs $25k-50k, 1.6% for AGIs $50k-75k, 1.5% for AGIs $75k-100k, 1.6% for AGIs $100k-200k, 2.3% for AGIs over 200k)
Taxes paid: $16,246 (reported on 51.5% of returns)
12514:
$16,246
State:
$18,656
(% of AGI for various income ranges: 7.1% for AGIs below $25k, 6.1% for AGIs $25k-50k, 8.7% for AGIs $50k-75k, 7.8% for AGIs $75k-100k, 9.4% for AGIs $100k-200k, 14.6% for AGIs over 200k)
Earned income credit: $1,827 (reported on 8.2% of returns)
Here:
$1,827
State:
$2,230
(% of AGI for various income ranges: 3.5% for AGIs below $25k, 0.6% for AGIs $25k-50k)
Percentage of individuals using paid preparers for their 2012 taxes: 61.2%
Here:
61%
State:
66%
(% for various income ranges: 51.3% for AGIs below $25k, 60.9% for AGIs $25k-50k, 63.2% for AGIs $50k-75k, 62.5% for AGIs $75k-100k, 65.5% for AGIs $100k-200k, 87.5% for AGIs over 200k)
Averages for the 2004 tax year for zip code 12514, filed in 2005:
Average Adjusted Gross Income (AGI) in 2004: $67,592 (Individual Income Tax Returns)
Here:
$67,592
State:
$59,519
Salary/wage: $57,781 (reported on 83.0% of returns)
Here:
$57,781
State:
$50,673
(% of AGI for various income ranges: 2140.0% for AGIs below $10k, 60.2% for AGIs $10k-25k, 73.9% for AGIs $25k-50k, 72.4% for AGIs $50k-75k, 80.3% for AGIs $75k-100k, 65.6% for AGIs over 100k)
Taxable interest for individuals: $1,421 (reported on 69.8% of returns)
This zip code:
$1,421
New York:
$2,377
(% of AGI for various income ranges: 126.7% for AGIs below $10k, 3.1% for AGIs $10k-25k, 1.9% for AGIs $25k-50k, 1.8% for AGIs $50k-75k, 1.2% for AGIs $75k-100k, 1.2% for AGIs over 100k)
Taxable dividends: $3,897 (reported on 40.4% of returns)
Here:
$3,897
State:
$5,394
(% of AGI for various income ranges: 220.0% for AGIs below $10k, 3.2% for AGIs $10k-25k, 1.0% for AGIs $25k-50k, 1.3% for AGIs $50k-75k, 0.9% for AGIs $75k-100k, 3.1% for AGIs over 100k)
Net capital gain/loss: +$11,192 (reported on 30.1% of returns)
Here:
+$11,192
State:
+$23,581
(% of AGI for various income ranges: -73.3% for AGIs below $10k, -0.3% for AGIs $10k-25k, -0.2% for AGIs $25k-50k, 0.8% for AGIs $50k-75k, 0.5% for AGIs $75k-100k, 9.1% for AGIs over 100k)
Profit/loss from business: +$15,310 (reported on 18.1% of returns)
Here:
+$15,310
State:
+$13,809
(% of AGI for various income ranges: 186.7% for AGIs below $10k, 8.2% for AGIs $10k-25k, 6.0% for AGIs $25k-50k, 2.9% for AGIs $50k-75k, 3.3% for AGIs $75k-100k, 3.9% for AGIs over 100k)
IRA payment deduction: $3,583 (reported on 4.4% of returns)
12514:
$3,583
New York:
$3,115
(% of AGI for various income ranges: 0.8% for AGIs $25k-50k, 0.2% for AGIs $50k-75k, 0.3% for AGIs $75k-100k, 0.1% for AGIs over 100k)
Self-employed pension: $17,688 (reported on 1.2% of returns)
Here:
$17,688
New York:
$19,016
Total itemized deductions: $22,354 (21% of AGI, reported on 52.3% of returns)
Here:
$22,354
State:
$25,864
Here:
20.8% of AGI
State:
21.9% of AGI
(% of AGI for various income ranges: 297.8% for AGIs below $10k, 17.7% for AGIs $10k-25k, 17.7% for AGIs $25k-50k, 21.8% for AGIs $50k-75k, 19.0% for AGIs $75k-100k, 15.1% for AGIs over 100k)
Charity contributions deductions: $2,698 (2% of AGI, reported on 49.3% of returns)
Here:
$2,698
State:
$4,439
Here:
2.5% of AGI
State:
3.6% of AGI
(% of AGI for various income ranges: 1.7% for AGIs $10k-25k, 1.9% for AGIs $25k-50k, 2.3% for AGIs $50k-75k, 2.4% for AGIs $75k-100k, 1.8% for AGIs over 100k)
Total tax: $11,292 (reported on 81.7% of returns)
12514:
$11,292
State:
$11,730
(% of AGI for various income ranges: 66.7% for AGIs below $10k, 5.2% for AGIs $10k-25k, 7.4% for AGIs $25k-50k, 8.5% for AGIs $50k-75k, 9.5% for AGIs $75k-100k, 18.2% for AGIs over 100k)
Earned income credit: $1,300 (reported on 5.9% of returns)
Here:
$1,300
State:
$1,757
Percentage of individuals using paid preparers for their 2004 taxes: 63.5%
Here:
63%
State:
67%
(% for various income ranges: 54.7% for AGIs below $10k, 62.1% for AGIs $10k-25k, 63.4% for AGIs $25k-50k, 66.5% for AGIs $50k-75k, 73.1% for AGIs $75k-100k, 63.5% for AGIs over 100k)
Household received Food Stamps/SNAP in the past 12 months: 0 Household did not receive Food Stamps/SNAP in the past 12 months: 1,269
Women who had a birth in the past 12 months: 25 (25 now married, 0 unmarried) Women who did not have a birth in the past 12 months: 365 (181 now married, 181 unmarried)
Housing units in zip code 12514 with a mortgage: 776 (79 second mortgage, 80 both second mortgage and home equity loan) Houses without a mortgage: 113
Median monthly owner costs for units with a mortgage: $2,029 Median monthly owner costs for units without a mortgage: $1,015
Residents with income below the poverty level in 2022:
This zip code:
6.3%
Whole state:
14.3%
Residents with income below 50% of the poverty level in 2022:
This zip code:
3.5%
Whole state:
6.8%
Median number of rooms in houses and condos:
Here:
6.7
State:
6.3
Median number of rooms in apartments:
Here:
6.6
State:
3.8
Notable locations in this zip code not listed on our city pages
Notable locations in zip code 12514: Clinton Vineyards (A), Willow Brook Gardens (B), East Clinton Fire District (C). Display/hide their locations on the map
Churches in zip code 12514 include: Saint Josephs Church (A), Cornerstone Bible Fellowship Church (B), Valley Community Church (C), Evangelical Free Church (D), Bulls Head Church (E). Display/hide their locations on the map
In group quarters: 97 (-1 institutionalized population)
Size of family households: 631 2-persons, 90 3-persons, 180 4-persons, 44 5-persons
Size of nonfamily households: 266 1-person, 84 2-persons
334 married couples with children.
17 single-parent households (17 women).
96.4% of residents of 12514 zip code speak English at home.
1.7% of residents speak Spanish at home (74% very well, 26% well).
1.9% of residents speak other Indo-European language at home (100% very well).
0.7% of residents speak Asian or Pacific Island language at home (65% very well, 35% well).
Foreign born population: 118 (4.0%) (90.3% of them are naturalized citizens)
This zip code:
4.0%
Whole state:
22.7%
18%France
16%El Salvador
15%Chile
9%Sweden
8%England
6%Thailand
5%India
16%Irish
16%Italian
14%German
12%American
5%Polish
5%English
4%European
Year of entry for the foreign-born population
02010 or later
72000 to 2009
211990 to 1999
130Before 1990
Facilities with environmental interests located in this zip code:
DUTCHESS COUNTY BIN 342870 (CO RTE 13 CLINTON CORNERS RD in CLINTON, NY)
(Resource Conservation and Recovery Act (tracking hazardous waste)) Organizations: DUTCHESS COUNTY D P W (CONTACT/OWNER)
DUTCHESS COUNTY BIN 3342880 (HIBERNIA RD OVER E BRANCH in CLINTON, NY)
Conditionally Exempt Small Quantity Generators, less than 100 kg/month of hazardous waste (Resource Conservation and Recovery Act (tracking hazardous waste)) - notification Organizations: DUTCHESS COUNTY DPW (CONTACT/OWNER)
DUTCHESS COUNTY DPW BIN 3342860 (CO RTE 14 TO TRIBUTARY in CLINTON, NY)
Small Quantity Generators, between 100 kg and 1000 kg of hazardous waste/month (Resource Conservation and Recovery Act (tracking hazardous waste)) - notification
Housing units lacking complete plumbing facilities: 2.2% Housing units lacking complete kitchen facilities: 0.5%
62.0%Fuel oil, kerosene, etc.
18.2%Bottled, tank, or LP gas
8.9%Wood
4.6%Utility gas
4.0%Electricity
1.4%Other fuel
1.0%Coal or coke
Population in 1990: 2,667. Population change in the 1990s: +187 (+7.0%).
Place of birth for U.S.-born residents:
This state: 2,018
Northeast: 454
Midwest: 142
South: 111
West: 34
71% of the 12514 zip code residents lived in the same house 5 years ago. Out of people who lived in different houses, 68% lived in this county. Out of people who lived in different counties, 50% lived in New York.
92% of the 12514 zip code residents lived in the same house 1 year ago. Out of people who lived in different houses, 20% moved from this county. Out of people who lived in different houses, 30% moved from different county within same state. Out of people who lived in different houses, 54% moved from different state.
Private vs. public school enrollment:
Students in private schools in grades 1 to 8 (elementary and middle school): 34
Here:
22.3%
New York:
15.6%
Students in private schools in grades 9 to 12 (high school): 44
Here:
57.8%
New York:
15.0%
Students in private undergraduate colleges: 35
Here:
38.0%
New York:
39.2%
Occupation by median earnings in the past 12 months ($)
247,483Legal occupations
128,469Computer and mathematical occupations
122,642Management occupations
120,695Business and financial operations occupations
114,924Architecture and engineering occupations
102,445Sales and related occupations
Top industries in this zip code by the number of employees in 2005:
Other Services (except Public Administration): Religious Organizations (20-49 employees: 1 establishment, 1-4 employees: 1 establishment)
Information: Television Broadcasting (10-19: 1)
Administrative and Support and Waste Management and Remediation Services: Landscaping Services (1-4: 4)
Finance and Insurance: Insurance Agencies and Brokerages (5-9: 1)
Health Care and Social Assistance: Vocational Rehabilitation Services (5-9: 1)
Health Care and Social Assistance: Residential Mental Retardation Facilities (5-9: 1)
Arts, Entertainment, and Recreation: Agents and Managers for Artists, Athletes, Entertainers, and Other Public Figures (1-4: 2)
Construction: Site Preparation Contractors (1-4: 2)
People in group quarters in 2010:
22 people in group homes intended for adults
People in group quarters in 2000:
11 people in homes for the mentally retarded
Fatal accident statistics in 2012:
Fatal accident count: 1
Vehicles involved in fatal accidents: 1
Fatal accidents caused by drunken drivers: 0
Fatalities: 1
Persons involved in fatal accidents: 2
Pedestrians involved in fatal accidents: 0
Fatal accident statistics in 2010:
Fatal accident count: 1
Vehicles involved in fatal accidents: 1
Fatal accidents caused by drunken drivers: 0
Fatalities: 1
Persons involved in fatal accidents: 1
Pedestrians involved in fatal accidents: 0
Home Mortgage Disclosure Act Aggregated Statistics For Year 2009 (Based on 4 partial tracts)
A) FHA, FSA/RHS & VA Home Purchase Loans
B) Conventional Home Purchase Loans
C) Refinancings
D) Home Improvement Loans
F) Non-occupant Loans on < 5 Family Dwellings (A B C & D)
G) Loans On Manufactured Home Dwelling (A B C & D)
Number
Average Value
Number
Average Value
Number
Average Value
Number
Average Value
Number
Average Value
Number
Average Value
LOANS ORIGINATED
5
$230,776
19
$300,654
76
$221,442
7
$72,789
14
$303,796
0
$0
APPLICATIONS APPROVED, NOT ACCEPTED
1
$217,080
1
$390,600
5
$382,714
0
$0
3
$387,080
0
$0
APPLICATIONS DENIED
0
$0
5
$253,758
52
$318,269
4
$93,465
6
$305,738
1
$261,630
APPLICATIONS WITHDRAWN
1
$259,980
3
$268,017
31
$292,458
3
$188,873
3
$261,160
0
$0
FILES CLOSED FOR INCOMPLETENESS
1
$145,320
1
$214,350
6
$400,877
0
$0
1
$364,010
1
$39,800
Aggregated Statistics For Year 2008 (Based on 4 partial tracts)
A) FHA, FSA/RHS & VA Home Purchase Loans
B) Conventional Home Purchase Loans
C) Refinancings
D) Home Improvement Loans
F) Non-occupant Loans on < 5 Family Dwellings (A B C & D)
Number
Average Value
Number
Average Value
Number
Average Value
Number
Average Value
Number
Average Value
LOANS ORIGINATED
2
$255,660
27
$378,727
48
$257,792
12
$67,367
13
$439,097
APPLICATIONS APPROVED, NOT ACCEPTED
1
$311,750
6
$236,755
8
$173,938
0
$0
2
$206,780
APPLICATIONS DENIED
1
$367,830
7
$407,926
41
$268,490
12
$232,144
2
$146,225
APPLICATIONS WITHDRAWN
1
$128,440
4
$424,560
21
$262,776
2
$117,395
0
$0
FILES CLOSED FOR INCOMPLETENESS
0
$0
0
$0
4
$304,920
1
$91,510
1
$76,580
Aggregated Statistics For Year 2007 (Based on 4 partial tracts)
A) FHA, FSA/RHS & VA Home Purchase Loans
B) Conventional Home Purchase Loans
C) Refinancings
D) Home Improvement Loans
F) Non-occupant Loans on < 5 Family Dwellings (A B C & D)
G) Loans On Manufactured Home Dwelling (A B C & D)
Number
Average Value
Number
Average Value
Number
Average Value
Number
Average Value
Number
Average Value
Number
Average Value
LOANS ORIGINATED
0
$0
47
$287,738
79
$226,736
24
$107,602
16
$360,910
1
$104,650
APPLICATIONS APPROVED, NOT ACCEPTED
0
$0
7
$235,460
12
$295,302
2
$50,015
3
$502,290
0
$0
APPLICATIONS DENIED
1
$170,650
9
$502,437
51
$281,261
14
$145,334
6
$416,568
1
$35,580
APPLICATIONS WITHDRAWN
0
$0
6
$361,682
21
$227,359
5
$142,654
2
$337,840
0
$0
FILES CLOSED FOR INCOMPLETENESS
0
$0
1
$360,060
10
$373,846
1
$284,940
0
$0
0
$0
Aggregated Statistics For Year 2006 (Based on 4 partial tracts)
B) Conventional Home Purchase Loans
C) Refinancings
D) Home Improvement Loans
F) Non-occupant Loans on < 5 Family Dwellings (A B C & D)
G) Loans On Manufactured Home Dwelling (A B C & D)
Number
Average Value
Number
Average Value
Number
Average Value
Number
Average Value
Number
Average Value
LOANS ORIGINATED
46
$315,492
80
$224,323
38
$70,642
16
$351,021
0
$0
APPLICATIONS APPROVED, NOT ACCEPTED
6
$313,802
18
$207,813
4
$62,868
3
$508,973
0
$0
APPLICATIONS DENIED
12
$236,525
50
$255,334
16
$111,025
5
$293,534
3
$83,420
APPLICATIONS WITHDRAWN
7
$527,787
37
$228,767
9
$144,606
1
$521,580
0
$0
FILES CLOSED FOR INCOMPLETENESS
4
$159,278
11
$245,810
0
$0
0
$0
0
$0
Aggregated Statistics For Year 2005 (Based on 4 partial tracts)
A) FHA, FSA/RHS & VA Home Purchase Loans
B) Conventional Home Purchase Loans
C) Refinancings
D) Home Improvement Loans
F) Non-occupant Loans on < 5 Family Dwellings (A B C & D)
G) Loans On Manufactured Home Dwelling (A B C & D)
Number
Average Value
Number
Average Value
Number
Average Value
Number
Average Value
Number
Average Value
Number
Average Value
LOANS ORIGINATED
1
$209,240
59
$320,386
100
$243,534
37
$82,214
16
$411,418
0
$0
APPLICATIONS APPROVED, NOT ACCEPTED
0
$0
4
$311,845
15
$272,386
6
$189,842
3
$303,230
0
$0
APPLICATIONS DENIED
0
$0
5
$420,790
47
$266,921
15
$67,381
4
$426,252
0
$0
APPLICATIONS WITHDRAWN
0
$0
7
$281,376
56
$207,314
12
$129,470
4
$289,892
1
$23,020
FILES CLOSED FOR INCOMPLETENESS
0
$0
4
$224,540
21
$202,293
2
$27,300
0
$0
0
$0
Aggregated Statistics For Year 2004 (Based on 4 partial tracts)
A) FHA, FSA/RHS & VA Home Purchase Loans
B) Conventional Home Purchase Loans
C) Refinancings
D) Home Improvement Loans
F) Non-occupant Loans on < 5 Family Dwellings (A B C & D)
G) Loans On Manufactured Home Dwelling (A B C & D)
Number
Average Value
Number
Average Value
Number
Average Value
Number
Average Value
Number
Average Value
Number
Average Value
LOANS ORIGINATED
1
$126,000
61
$309,833
115
$217,663
32
$66,660
24
$377,617
2
$62,760
APPLICATIONS APPROVED, NOT ACCEPTED
0
$0
6
$277,917
22
$265,075
4
$95,218
5
$356,330
0
$0
APPLICATIONS DENIED
0
$0
6
$297,295
46
$270,292
14
$125,214
7
$417,003
3
$95,537
APPLICATIONS WITHDRAWN
1
$127,840
4
$311,362
48
$194,832
9
$145,951
1
$142,740
1
$94,890
FILES CLOSED FOR INCOMPLETENESS
0
$0
2
$260,525
25
$268,917
1
$96,480
1
$318,610
0
$0
Aggregated Statistics For Year 2003 (Based on 4 partial tracts)
A) FHA, FSA/RHS & VA Home Purchase Loans
B) Conventional Home Purchase Loans
C) Refinancings
D) Home Improvement Loans
F) Non-occupant Loans on < 5 Family Dwellings (A B C & D)
Number
Average Value
Number
Average Value
Number
Average Value
Number
Average Value
Number
Average Value
LOANS ORIGINATED
2
$150,525
46
$259,120
206
$201,862
14
$41,874
28
$379,183
APPLICATIONS APPROVED, NOT ACCEPTED
1
$151,960
9
$276,838
29
$164,188
6
$19,023
4
$366,735
APPLICATIONS DENIED
0
$0
10
$292,919
59
$188,768
6
$40,573
3
$347,073
APPLICATIONS WITHDRAWN
1
$133,870
7
$221,947
39
$173,020
3
$65,623
2
$284,475
FILES CLOSED FOR INCOMPLETENESS
0
$0
1
$200,170
6
$222,577
0
$0
0
$0
Aggregated Statistics For Year 2002 (Based on 4 partial tracts)
A) FHA, FSA/RHS & VA Home Purchase Loans
B) Conventional Home Purchase Loans
C) Refinancings
D) Home Improvement Loans
F) Non-occupant Loans on < 5 Family Dwellings (A B C & D)
Number
Average Value
Number
Average Value
Number
Average Value
Number
Average Value
Number
Average Value
LOANS ORIGINATED
2
$136,115
51
$210,868
130
$166,113
19
$53,571
16
$254,984
APPLICATIONS APPROVED, NOT ACCEPTED
0
$0
8
$294,808
26
$167,603
3
$36,693
4
$241,695
APPLICATIONS DENIED
1
$153,680
5
$165,494
37
$190,486
8
$35,225
2
$438,180
APPLICATIONS WITHDRAWN
0
$0
6
$256,993
28
$176,646
5
$35,918
3
$379,110
FILES CLOSED FOR INCOMPLETENESS
0
$0
2
$165,455
15
$221,356
1
$28,310
0
$0
Aggregated Statistics For Year 2001 (Based on 4 partial tracts)
A) FHA, FSA/RHS & VA Home Purchase Loans
B) Conventional Home Purchase Loans
C) Refinancings
D) Home Improvement Loans
F) Non-occupant Loans on < 5 Family Dwellings (A B C & D)
Number
Average Value
Number
Average Value
Number
Average Value
Number
Average Value
Number
Average Value
LOANS ORIGINATED
2
$183,325
56
$180,586
82
$171,979
11
$42,373
13
$211,120
APPLICATIONS APPROVED, NOT ACCEPTED
0
$0
4
$201,030
12
$154,201
3
$45,187
4
$210,808
APPLICATIONS DENIED
0
$0
12
$140,402
29
$149,049
5
$44,798
3
$187,133
APPLICATIONS WITHDRAWN
0
$0
6
$157,115
26
$126,106
5
$26,006
0
$0
FILES CLOSED FOR INCOMPLETENESS
0
$0
0
$0
6
$176,235
1
$61,510
1
$56,680
Aggregated Statistics For Year 2000 (Based on 4 partial tracts)
A) FHA, FSA/RHS & VA Home Purchase Loans
B) Conventional Home Purchase Loans
C) Refinancings
D) Home Improvement Loans
F) Non-occupant Loans on < 5 Family Dwellings (A B C & D)
Number
Average Value
Number
Average Value
Number
Average Value
Number
Average Value
Number
Average Value
LOANS ORIGINATED
2
$152,295
55
$192,984
28
$119,358
15
$29,226
10
$232,970
APPLICATIONS APPROVED, NOT ACCEPTED
0
$0
9
$186,480
4
$95,595
4
$38,385
1
$121,190
APPLICATIONS DENIED
0
$0
8
$165,442
20
$88,124
7
$27,757
1
$239,690
APPLICATIONS WITHDRAWN
1
$171,290
7
$224,124
15
$73,520
3
$54,137
1
$150,750
FILES CLOSED FOR INCOMPLETENESS
0
$0
3
$123,230
4
$74,562
0
$0
0
$0
Aggregated Statistics For Year 1999 (Based on 2 partial tracts)
A) FHA, FSA/RHS & VA Home Purchase Loans
B) Conventional Home Purchase Loans
C) Refinancings
D) Home Improvement Loans
F) Non-occupant Loans on < 5 Family Dwellings (A B C & D)


 Nearest zip codes: 12581, 12578, 12580, 12572, 12571, 12545.


