Estimated zip code population in 2022: 2,008 Zip code population in 2010: 2,246 Zip code population in 2000: 2,231
Houses and condos: 1,176 Renter-occupied apartments: 238
% of renters here:
27%
State:
46%
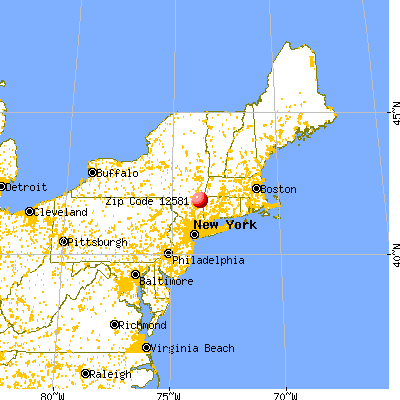
March 2022 cost of living index in zip code 12581: 116.6 (more than average, U.S. average is 100)
Land area: 40.4 sq. mi. Water area: 0.4 sq. mi.
Population density: 50 people per square mile
(very low).
OSM Map
General Map
Google Map
MSN Map
OSM Map
General Map
Google Map
MSN Map
OSM Map
General Map
Google Map
MSN Map
OSM Map
General Map
Google Map
MSN Map
Please wait while loading the map...
Real estate property taxes paid for housing units in 2022:
This zip code:
1.3% ($4,588)
New York:
1.5% ($6,180)
Median real estate property taxes paid for housing units with mortgages in 2022: $4,389 (1.3%) Median real estate property taxes paid for housing units with no mortgage in 2022: $4,892 (1.3%)
Estimated median house/condo value in 2022: $342,545
12581:
$342,545
New York:
$400,400
According to our research of New York and other state lists, there was 1 registered sex offender living in 12581 zip code as of May 28, 2024. The ratio of all residents to sex offenders in zip code 12581 is 2,175 to 1. The ratio of registered sex offenders to all residents in this zip code is lower than the state average.
Median resident age:
This zip code:
45.7 years
New York median age:
40.0 years
Average household size:
This zip code:
2.2 people
New York:
2.5 people
Averages for the 2020 tax year for zip code 12581, filed in 2021:
Average Adjusted Gross Income (AGI) in 2020: $110,444 (Individual Income Tax Returns)
Here:
$110,444
State:
$90,930
Salary/wage: $79,718 (reported on 75.2% of returns)
Here:
$79,718
State:
$72,104
(% of AGI for various income ranges: 1214.0% for AGIs below $25k, 3522.4% for AGIs $25k-50k, 6407.0% for AGIs $50k-75k, 9960.0% for AGIs $75k-100k, 16364.0% for AGIs $100k-200k, 132105.0% for AGIs over 200k)
Taxable interest for individuals: $1,728 (reported on 47.6% of returns)
This zip code:
$1,728
New York:
$3,075
(% of AGI for various income ranges: 24.0% for AGIs below $25k, 20.0% for AGIs $25k-50k, 35.0% for AGIs $50k-75k, 46.7% for AGIs $75k-100k, 243.0% for AGIs $100k-200k, 2440.0% for AGIs over 200k)
Ordinary dividends: $13,735 (reported on 32.4% of returns)
Here:
$13,735
State:
$11,095
(% of AGI for various income ranges: 90.0% for AGIs below $25k, 135.9% for AGIs $25k-50k, 138.0% for AGIs $50k-75k, 288.3% for AGIs $75k-100k, 716.0% for AGIs $100k-200k, 16385.0% for AGIs over 200k)
Net capital gain/loss in AGI: +$40,304 (reported on 26.7% of returns)
Here:
+$40,304
State:
+$44,925
(% of AGI for various income ranges: 76.0% for AGIs below $25k, 111.2% for AGIs $25k-50k, 73.0% for AGIs $50k-75k, 315.0% for AGIs $75k-100k, 1650.0% for AGIs $100k-200k, 45350.0% for AGIs over 200k)
Profit/loss from business: +$19,818 (reported on 21.0% of returns)
Here:
+$19,818
State:
+$14,940
(% of AGI for various income ranges: 198.0% for AGIs below $25k, 220.6% for AGIs $25k-50k, 472.0% for AGIs $50k-75k, 1419.0% for AGIs $100k-200k, 8985.0% for AGIs over 200k)
Taxable individual retirement arrangement distribution: $24,542 (reported on 11.4% of returns)
12581:
$24,542
New York:
$19,609
(% of AGI for various income ranges: 210.7% for AGIs below $25k, 346.0% for AGIs $50k-75k, 2283.0% for AGIs $100k-200k)
Total itemized deductions: $40,429 (reported on 13.3% of returns)
Here:
$40,429
State:
$39,326
(% of AGI for various income ranges: 324.0% for AGIs below $25k, 639.0% for AGIs $50k-75k, 1059.0% for AGIs $100k-200k, 17380.0% for AGIs over 200k)
Charity contributions: $6,785 (reported on 12.4% of returns)
Here:
$6,785
State:
$15,420
(% of AGI for various income ranges: 102.0% for AGIs $50k-75k, 107.0% for AGIs $100k-200k, 3365.0% for AGIs over 200k)
Taxes paid: $9,364 (reported on 13.3% of returns)
12581:
$9,364
State:
$9,183
(% of AGI for various income ranges: 351.0% for AGIs $50k-75k, 400.0% for AGIs $100k-200k, 2800.0% for AGIs over 200k)
Earned income credit: $1,822 (reported on 8.6% of returns)
Here:
$1,822
State:
$2,138
(% of AGI for various income ranges: 65.3% for AGIs below $25k, 38.8% for AGIs $25k-50k)
Percentage of individuals using paid preparers for their 2020 taxes: 93.3%
Here:
93%
State:
95%
(% for various income ranges: 88.9% for AGIs below $25k, 91.3% for AGIs $25k-50k, 93.3% for AGIs $50k-75k, 100.0% for AGIs $75k-100k, 95.0% for AGIs $100k-200k, 100.0% for AGIs over 200k)
Averages for the 2012 tax year for zip code 12581, filed in 2013:
Average Adjusted Gross Income (AGI) in 2012: $72,039 (Individual Income Tax Returns)
Here:
$72,039
State:
$77,088
Salary/wage: $50,647 (reported on 78.6% of returns)
Here:
$50,647
State:
$60,593
(% of AGI for various income ranges: 62.2% for AGIs below $25k, 74.2% for AGIs $25k-50k, 73.1% for AGIs $50k-75k, 59.5% for AGIs $75k-100k, 64.9% for AGIs $100k-200k, 27.8% for AGIs over 200k)
Taxable interest for individuals: $1,452 (reported on 46.6% of returns)
This zip code:
$1,452
New York:
$3,125
(% of AGI for various income ranges: 1.9% for AGIs below $25k, 1.2% for AGIs $25k-50k, 0.5% for AGIs $50k-75k, 1.4% for AGIs $75k-100k, 1.1% for AGIs $100k-200k, 0.5% for AGIs over 200k)
Ordinary dividends: $7,723 (reported on 29.1% of returns)
Here:
$7,723
State:
$10,299
(% of AGI for various income ranges: 2.6% for AGIs below $25k, 1.7% for AGIs $25k-50k, 2.3% for AGIs $50k-75k, 3.9% for AGIs $75k-100k, 3.5% for AGIs $100k-200k, 3.4% for AGIs over 200k)
Net capital gain/loss in AGI: +$17,552 (reported on 24.3% of returns)
Here:
+$17,552
State:
+$42,474
(% of AGI for various income ranges: 1.0% for AGIs $25k-50k, 0.3% for AGIs $75k-100k, 1.9% for AGIs $100k-200k, 17.6% for AGIs over 200k)
Profit/loss from business: +$18,859 (reported on 21.4% of returns)
Here:
+$18,859
State:
+$16,168
(% of AGI for various income ranges: 11.8% for AGIs below $25k, 6.3% for AGIs $25k-50k, 6.0% for AGIs $50k-75k, 12.1% for AGIs $100k-200k)
Taxable individual retirement arrangement distribution: $21,580 (reported on 9.7% of returns)
12581:
$21,580
New York:
$17,621
(% of AGI for various income ranges: 3.1% for AGIs $25k-50k, 4.5% for AGIs $50k-75k, 6.8% for AGIs $100k-200k)
Total itemized deductions: $31,576 (24% of AGI, reported on 40.8% of returns)
Here:
$31,576
State:
$34,985
Here:
24.3% of AGI
State:
21.3% of AGI
(% of AGI for various income ranges: 15.5% for AGIs below $25k, 11.7% for AGIs $25k-50k, 17.4% for AGIs $50k-75k, 17.1% for AGIs $75k-100k, 24.6% for AGIs $100k-200k, 14.8% for AGIs over 200k)
Charity contributions: $3,649 (reported on 35.9% of returns)
Here:
$3,649
State:
$5,572
(% of AGI for various income ranges: 1.0% for AGIs $25k-50k, 1.7% for AGIs $50k-75k, 2.4% for AGIs $75k-100k, 2.0% for AGIs $100k-200k, 2.1% for AGIs over 200k)
Taxes paid: $13,962 (reported on 40.8% of returns)
12581:
$13,962
State:
$18,656
(% of AGI for various income ranges: 5.9% for AGIs below $25k, 4.7% for AGIs $25k-50k, 6.8% for AGIs $50k-75k, 6.6% for AGIs $75k-100k, 9.3% for AGIs $100k-200k, 9.2% for AGIs over 200k)
Earned income credit: $1,817 (reported on 11.7% of returns)
Here:
$1,817
State:
$2,230
(% of AGI for various income ranges: 3.9% for AGIs below $25k, 0.8% for AGIs $25k-50k)
Percentage of individuals using paid preparers for their 2012 taxes: 59.2%
Here:
59%
State:
66%
(% for various income ranges: 48.5% for AGIs below $25k, 54.2% for AGIs $25k-50k, 62.5% for AGIs $50k-75k, 60.0% for AGIs $75k-100k, 75.0% for AGIs $100k-200k, 100.0% for AGIs over 200k)
Averages for the 2004 tax year for zip code 12581, filed in 2005:
Average Adjusted Gross Income (AGI) in 2004: $61,736 (Individual Income Tax Returns)
Here:
$61,736
State:
$59,519
Salary/wage: $50,944 (reported on 78.4% of returns)
Here:
$50,944
State:
$50,673
(% of AGI for various income ranges: 71.1% for AGIs $10k-25k, 73.6% for AGIs $25k-50k, 76.9% for AGIs $50k-75k, 76.5% for AGIs $75k-100k, 51.1% for AGIs over 100k)
Taxable interest for individuals: $1,499 (reported on 62.2% of returns)
This zip code:
$1,499
New York:
$2,377
(% of AGI for various income ranges: 3.2% for AGIs $10k-25k, 1.8% for AGIs $25k-50k, 1.6% for AGIs $50k-75k, 1.0% for AGIs $75k-100k, 1.1% for AGIs over 100k)
Taxable dividends: $3,876 (reported on 38.3% of returns)
Here:
$3,876
State:
$5,394
(% of AGI for various income ranges: 4.0% for AGIs $10k-25k, 1.1% for AGIs $25k-50k, 1.6% for AGIs $50k-75k, 1.4% for AGIs $75k-100k, 2.9% for AGIs over 100k)
Net capital gain/loss: +$14,790 (reported on 30.6% of returns)
Here:
+$14,790
State:
+$23,581
(% of AGI for various income ranges: -1.0% for AGIs $10k-25k, 0.2% for AGIs $25k-50k, 2.0% for AGIs $50k-75k, 2.8% for AGIs $75k-100k, 13.0% for AGIs over 100k)
Profit/loss from business: +$13,818 (reported on 21.4% of returns)
Here:
+$13,818
State:
+$13,809
(% of AGI for various income ranges: 4.7% for AGIs $10k-25k, 9.4% for AGIs $25k-50k, 2.9% for AGIs $50k-75k, 3.5% for AGIs $75k-100k, 4.2% for AGIs over 100k)
IRA payment deduction: $3,459 (reported on 5.9% of returns)
12581:
$3,459
New York:
$3,115
(% of AGI for various income ranges: 0.9% for AGIs $25k-50k, 0.4% for AGIs $50k-75k, 0.4% for AGIs $75k-100k, 0.1% for AGIs over 100k)
Self-employed pension: $10,000 (reported on 1.1% of returns)
Here:
$10,000
New York:
$19,016
Total itemized deductions: $24,339 (23% of AGI, reported on 44.4% of returns)
Here:
$24,339
State:
$25,864
Here:
22.6% of AGI
State:
21.9% of AGI
(% of AGI for various income ranges: 20.1% for AGIs $10k-25k, 15.6% for AGIs $25k-50k, 18.3% for AGIs $50k-75k, 19.3% for AGIs $75k-100k, 16.5% for AGIs over 100k)
Charity contributions deductions: $2,856 (3% of AGI, reported on 41.1% of returns)
Here:
$2,856
State:
$4,439
Here:
2.5% of AGI
State:
3.6% of AGI
(% of AGI for various income ranges: 1.0% for AGIs $10k-25k, 1.5% for AGIs $25k-50k, 1.9% for AGIs $50k-75k, 2.2% for AGIs $75k-100k, 1.9% for AGIs over 100k)
Total tax: $10,919 (reported on 81.4% of returns)
12581:
$10,919
State:
$11,730
(% of AGI for various income ranges: 4.5% for AGIs $10k-25k, 7.8% for AGIs $25k-50k, 8.7% for AGIs $50k-75k, 10.5% for AGIs $75k-100k, 19.5% for AGIs over 100k)
Earned income credit: $1,373 (reported on 7.3% of returns)
Here:
$1,373
State:
$1,757
Percentage of individuals using paid preparers for their 2004 taxes: 65.5%
Here:
66%
State:
67%
(% for various income ranges: 59.9% for AGIs below $10k, 62.8% for AGIs $10k-25k, 64.1% for AGIs $25k-50k, 66.9% for AGIs $50k-75k, 63.6% for AGIs $75k-100k, 78.4% for AGIs over 100k)
Household received Food Stamps/SNAP in the past 12 months: 70 Household did not receive Food Stamps/SNAP in the past 12 months: 806
Women who had a birth in the past 12 months: 61 (32 now married, 29 unmarried) Women who did not have a birth in the past 12 months: 310 (113 now married, 197 unmarried)
Housing units in zip code 12581 with a mortgage: 349 (19 second mortgage, 19 both second mortgage and home equity loan) Houses without a mortgage: 24
Median monthly owner costs for units with a mortgage: $1,615 Median monthly owner costs for units without a mortgage: $799
Residents with income below the poverty level in 2022:
This zip code:
17.2%
Whole state:
14.3%
Residents with income below 50% of the poverty level in 2022:
This zip code:
4.4%
Whole state:
6.8%
Median number of rooms in houses and condos:
Here:
6.0
State:
6.3
Median number of rooms in apartments:
Here:
4.3
State:
3.8
Notable locations in this zip code not listed on our city pages
Notable locations in zip code 12581: Thunder Hill Farm (A), MLC Farm (B), Saint Margaret Villa (C), Stanford Free Library (D), Stanford Town Supervisors Office (E). Display/hide their locations on the map
In group quarters: 14 (-1 institutionalized population)
Size of family households: 383 2-persons, 80 3-persons, 128 4-persons, 32 5-persons
Size of nonfamily households: 213 1-person, 49 2-persons
188 married couples with children.
185 single-parent households (71 men, 114 women).
82.6% of residents of 12581 zip code speak English at home.
11.0% of residents speak Spanish at home (65% very well, 13% well, 18% not well, 5% not at all).
3.3% of residents speak other Indo-European language at home (100% very well).
1.7% of residents speak Asian or Pacific Island language at home (100% very well).
1.3% of residents speak other language at home (100% very well).
Foreign born population: 240 (12.0%) (46.2% of them are naturalized citizens)
This zip code:
12.0%
Whole state:
22.7%
62%Honduras
10%France
7%Sweden
7%Belgium
5%United Kingdom, excluding England and Scotland
4%Czechoslovakia (includes Czech Republic and Slovakia)
2%Poland
13%Irish
12%German
9%Italian
6%American
4%English
4%Dutch
3%European
Year of entry for the foreign-born population
1512010 or later
1222000 to 2009
171990 to 1999
114Before 1990
Facilities with environmental interests located in this zip code:
COLD SPRING ES ( in STANFORDVILLE, NY)
(National Center for Education Statistics) - STATE ID-131301040003 Organizations: PINE PLAINS CSD (SCHOOL DISTRICT)
Housing units lacking complete plumbing facilities: 1.8% Housing units lacking complete kitchen facilities: 2.3%
57.0%Fuel oil, kerosene, etc.
15.3%Electricity
13.8%Bottled, tank, or LP gas
5.3%Solar energy
3.9%Utility gas
2.2%Other fuel
2.0%Wood
0.9%No fuel used
Population in 1990: 2,356.
Place of birth for U.S.-born residents:
This state: 1,192
Northeast: 201
Midwest: 51
South: 122
West: 42
61% of the 12581 zip code residents lived in the same house 5 years ago. Out of people who lived in different houses, 66% lived in this county. Out of people who lived in different counties, 50% lived in New York.
97% of the 12581 zip code residents lived in the same house 1 year ago. Out of people who lived in different houses, 20% moved from this county. Out of people who lived in different houses, 76% moved from different county within same state.
Private vs. public school enrollment:
Students in private schools in grades 1 to 8 (elementary and middle school): 27
Here:
21.6%
New York:
15.6%
Students in private schools in grades 9 to 12 (high school): 14
Here:
9.6%
New York:
15.0%
Students in private undergraduate colleges: 28
Here:
50.2%
New York:
39.2%
Occupation by median earnings in the past 12 months ($)
247,483Legal occupations
115,172Business and financial operations occupations
92,529Management occupations
86,862Computer and mathematical occupations
68,435Architecture and engineering occupations
66,230Transportation occupations
Top industries in this zip code by the number of employees in 2005:
Accommodation and Food Services: Recreational and Vacation Camps (except Campgrounds) (20-49 employees: 1 establishment)
Health Care and Social Assistance: Residential Mental Retardation Facilities (20-49: 1)
Administrative and Support and Waste Management and Remediation Services: Landscaping Services (10-19: 1, 1-4: 3)
Construction: Industrial Building Construction (10-19: 1)
Construction: Site Preparation Contractors (5-9: 1, 1-4: 2)
Accommodation and Food Services: Full-Service Restaurants (5-9: 1, 1-4: 1)
People in group quarters in 2010:
54 people in group homes intended for adults
People in group quarters in 2000:
35 people in homes for the mentally ill
22 people in nursing homes
5 people in homes for the mentally retarded
3 people in other noninstitutional group quarters
Fatal accident statistics in 2014:
Fatal accident count: 1
Vehicles involved in fatal accidents: 1
Fatal accidents caused by drunken drivers: 0
Fatalities: 1
Persons involved in fatal accidents: 1
Pedestrians involved in fatal accidents: 0
Fatal accident statistics in 2012:
Fatal accident count: 1
Vehicles involved in fatal accidents: 2
Fatal accidents caused by drunken drivers: 0
Fatalities: 1
Persons involved in fatal accidents: 2
Pedestrians involved in fatal accidents: 0
Home Mortgage Disclosure Act Aggregated Statistics For Year 2009 (Based on 4 partial tracts)
A) FHA, FSA/RHS & VA Home Purchase Loans
B) Conventional Home Purchase Loans
C) Refinancings
D) Home Improvement Loans
F) Non-occupant Loans on < 5 Family Dwellings (A B C & D)
G) Loans On Manufactured Home Dwelling (A B C & D)
Number
Average Value
Number
Average Value
Number
Average Value
Number
Average Value
Number
Average Value
Number
Average Value
LOANS ORIGINATED
7
$230,746
29
$294,749
97
$223,140
11
$109,550
23
$299,094
0
$0
APPLICATIONS APPROVED, NOT ACCEPTED
0
$0
3
$262,650
5
$436,442
0
$0
3
$428,720
0
$0
APPLICATIONS DENIED
2
$201,160
11
$231,975
68
$380,927
1
$33,840
15
$326,019
4
$210,782
APPLICATIONS WITHDRAWN
3
$164,417
4
$147,530
25
$269,182
4
$77,568
4
$326,338
0
$0
FILES CLOSED FOR INCOMPLETENESS
0
$0
2
$330,265
9
$449,853
0
$0
1
$310,270
0
$0
Aggregated Statistics For Year 2008 (Based on 4 partial tracts)
A) FHA, FSA/RHS & VA Home Purchase Loans
B) Conventional Home Purchase Loans
C) Refinancings
D) Home Improvement Loans
F) Non-occupant Loans on < 5 Family Dwellings (A B C & D)
G) Loans On Manufactured Home Dwelling (A B C & D)
Number
Average Value
Number
Average Value
Number
Average Value
Number
Average Value
Number
Average Value
Number
Average Value
LOANS ORIGINATED
1
$357,490
37
$373,006
60
$232,724
12
$109,982
17
$481,396
0
$0
APPLICATIONS APPROVED, NOT ACCEPTED
0
$0
8
$252,675
14
$217,425
1
$75,440
2
$278,370
0
$0
APPLICATIONS DENIED
0
$0
3
$206,760
47
$274,917
12
$286,739
0
$0
2
$256,180
APPLICATIONS WITHDRAWN
0
$0
5
$366,810
18
$249,656
3
$142,877
1
$275,200
0
$0
FILES CLOSED FOR INCOMPLETENESS
0
$0
0
$0
3
$312,447
3
$72,397
0
$0
0
$0
Aggregated Statistics For Year 2007 (Based on 4 partial tracts)
A) FHA, FSA/RHS & VA Home Purchase Loans
B) Conventional Home Purchase Loans
C) Refinancings
D) Home Improvement Loans
F) Non-occupant Loans on < 5 Family Dwellings (A B C & D)
G) Loans On Manufactured Home Dwelling (A B C & D)
Number
Average Value
Number
Average Value
Number
Average Value
Number
Average Value
Number
Average Value
Number
Average Value
LOANS ORIGINATED
2
$241,840
59
$316,105
86
$199,109
31
$153,569
25
$330,269
3
$112,417
APPLICATIONS APPROVED, NOT ACCEPTED
0
$0
14
$342,914
14
$232,188
4
$63,708
7
$359,901
0
$0
APPLICATIONS DENIED
0
$0
18
$692,648
62
$213,518
24
$114,932
13
$498,663
0
$0
APPLICATIONS WITHDRAWN
0
$0
8
$403,182
24
$187,140
6
$71,115
3
$300,530
0
$0
FILES CLOSED FOR INCOMPLETENESS
0
$0
3
$287,213
9
$238,938
1
$107,920
0
$0
0
$0
Aggregated Statistics For Year 2006 (Based on 4 partial tracts)
B) Conventional Home Purchase Loans
C) Refinancings
D) Home Improvement Loans
E) Loans on Dwellings For 5+ Families
F) Non-occupant Loans on < 5 Family Dwellings (A B C & D)
G) Loans On Manufactured Home Dwelling (A B C & D)
Number
Average Value
Number
Average Value
Number
Average Value
Number
Average Value
Number
Average Value
Number
Average Value
LOANS ORIGINATED
61
$353,417
118
$218,419
40
$69,652
1
$571,980
21
$347,929
0
$0
APPLICATIONS APPROVED, NOT ACCEPTED
8
$432,796
17
$224,469
5
$58,774
0
$0
7
$551,697
0
$0
APPLICATIONS DENIED
23
$241,322
69
$251,269
17
$203,739
0
$0
9
$270,913
4
$126,805
APPLICATIONS WITHDRAWN
15
$279,250
37
$199,052
11
$151,180
0
$0
5
$372,596
0
$0
FILES CLOSED FOR INCOMPLETENESS
3
$227,083
12
$252,085
1
$60,700
0
$0
0
$0
0
$0
Aggregated Statistics For Year 2005 (Based on 4 partial tracts)
A) FHA, FSA/RHS & VA Home Purchase Loans
B) Conventional Home Purchase Loans
C) Refinancings
D) Home Improvement Loans
F) Non-occupant Loans on < 5 Family Dwellings (A B C & D)
G) Loans On Manufactured Home Dwelling (A B C & D)
Number
Average Value
Number
Average Value
Number
Average Value
Number
Average Value
Number
Average Value
Number
Average Value
LOANS ORIGINATED
0
$0
80
$403,063
129
$227,876
43
$83,131
32
$423,509
0
$0
APPLICATIONS APPROVED, NOT ACCEPTED
0
$0
9
$296,212
19
$203,875
9
$169,880
6
$266,260
0
$0
APPLICATIONS DENIED
0
$0
15
$368,632
56
$250,988
22
$59,110
9
$396,748
2
$124,250
APPLICATIONS WITHDRAWN
0
$0
14
$288,056
73
$218,337
12
$160,587
8
$407,534
3
$24,730
FILES CLOSED FOR INCOMPLETENESS
1
$103,870
5
$200,732
35
$226,855
1
$59,360
2
$104,855
0
$0
Aggregated Statistics For Year 2004 (Based on 4 partial tracts)
A) FHA, FSA/RHS & VA Home Purchase Loans
B) Conventional Home Purchase Loans
C) Refinancings
D) Home Improvement Loans
F) Non-occupant Loans on < 5 Family Dwellings (A B C & D)
G) Loans On Manufactured Home Dwelling (A B C & D)
Number
Average Value
Number
Average Value
Number
Average Value
Number
Average Value
Number
Average Value
Number
Average Value
LOANS ORIGINATED
3
$151,877
82
$291,624
168
$208,762
24
$94,953
41
$373,193
5
$49,288
APPLICATIONS APPROVED, NOT ACCEPTED
0
$0
8
$205,612
32
$228,769
9
$112,296
4
$243,895
0
$0
APPLICATIONS DENIED
0
$0
10
$427,453
61
$241,308
14
$58,244
12
$406,274
6
$107,863
APPLICATIONS WITHDRAWN
0
$0
7
$425,729
66
$168,850
9
$181,187
5
$145,582
3
$92,620
FILES CLOSED FOR INCOMPLETENESS
0
$0
3
$263,053
28
$274,233
0
$0
1
$377,720
0
$0
Aggregated Statistics For Year 2003 (Based on 4 partial tracts)
A) FHA, FSA/RHS & VA Home Purchase Loans
B) Conventional Home Purchase Loans
C) Refinancings
D) Home Improvement Loans
F) Non-occupant Loans on < 5 Family Dwellings (A B C & D)
Number
Average Value
Number
Average Value
Number
Average Value
Number
Average Value
Number
Average Value
LOANS ORIGINATED
1
$290,030
57
$248,435
277
$245,441
17
$42,021
44
$448,598
APPLICATIONS APPROVED, NOT ACCEPTED
0
$0
12
$270,114
36
$194,431
7
$35,636
12
$337,312
APPLICATIONS DENIED
0
$0
14
$187,939
68
$192,690
4
$58,160
6
$219,535
APPLICATIONS WITHDRAWN
0
$0
10
$165,478
58
$186,189
2
$85,970
4
$192,932
FILES CLOSED FOR INCOMPLETENESS
0
$0
3
$135,770
8
$261,538
1
$40,470
2
$119,340
Aggregated Statistics For Year 2002 (Based on 4 partial tracts)
A) FHA, FSA/RHS & VA Home Purchase Loans
B) Conventional Home Purchase Loans
C) Refinancings
D) Home Improvement Loans
E) Loans on Dwellings For 5+ Families
F) Non-occupant Loans on < 5 Family Dwellings (A B C & D)
Number
Average Value
Number
Average Value
Number
Average Value
Number
Average Value
Number
Average Value
Number
Average Value
LOANS ORIGINATED
3
$127,257
61
$242,199
180
$177,853
27
$48,476
1
$1,922,330
32
$294,710
APPLICATIONS APPROVED, NOT ACCEPTED
0
$0
13
$389,257
26
$142,794
5
$29,086
0
$0
3
$344,493
APPLICATIONS DENIED
1
$124,110
10
$146,957
36
$251,513
12
$41,107
0
$0
2
$429,485
APPLICATIONS WITHDRAWN
0
$0
9
$189,184
39
$218,298
8
$34,686
0
$0
4
$254,625
FILES CLOSED FOR INCOMPLETENESS
0
$0
2
$167,100
17
$192,912
1
$13,490
0
$0
0
$0
Aggregated Statistics For Year 2001 (Based on 4 partial tracts)
A) FHA, FSA/RHS & VA Home Purchase Loans
B) Conventional Home Purchase Loans
C) Refinancings
D) Home Improvement Loans
F) Non-occupant Loans on < 5 Family Dwellings (A B C & D)
Number
Average Value
Number
Average Value
Number
Average Value
Number
Average Value
Number
Average Value
LOANS ORIGINATED
5
$140,106
78
$188,553
113
$190,141
17
$29,959
24
$209,898
APPLICATIONS APPROVED, NOT ACCEPTED
1
$202,350
6
$161,452
22
$138,095
2
$36,025
4
$331,518
APPLICATIONS DENIED
2
$118,865
17
$174,208
28
$175,335
13
$29,565
4
$208,072
APPLICATIONS WITHDRAWN
2
$68,775
6
$170,495
31
$125,844
6
$24,873
0
$0
FILES CLOSED FOR INCOMPLETENESS
0
$0
2
$104,825
6
$177,220
0
$0
0
$0
Aggregated Statistics For Year 2000 (Based on 4 partial tracts)
A) FHA, FSA/RHS & VA Home Purchase Loans
B) Conventional Home Purchase Loans
C) Refinancings
D) Home Improvement Loans
F) Non-occupant Loans on < 5 Family Dwellings (A B C & D)
Number
Average Value
Number
Average Value
Number
Average Value
Number
Average Value
Number
Average Value
LOANS ORIGINATED
6
$139,503
74
$210,726
43
$121,161
19
$33,284
17
$232,128
APPLICATIONS APPROVED, NOT ACCEPTED
0
$0
14
$158,826
4
$81,545
4
$15,850
1
$97,130
APPLICATIONS DENIED
1
$144,340
9
$170,718
28
$108,429
4
$37,230
3
$100,727
APPLICATIONS WITHDRAWN
3
$107,247
9
$270,560
15
$83,105
3
$48,317
0
$0
FILES CLOSED FOR INCOMPLETENESS
1
$201,000
7
$149,931
7
$101,013
0
$0
1
$161,880
Aggregated Statistics For Year 1999 (Based on 2 partial tracts)
A) FHA, FSA/RHS & VA Home Purchase Loans
B) Conventional Home Purchase Loans
C) Refinancings
D) Home Improvement Loans
F) Non-occupant Loans on < 5 Family Dwellings (A B C & D)
Detailed PMIC statistics for the following Tracts:0900.00
, 1700.00
2002 - 2018 National Fire Incident Reporting System (NFIRS) incidents
Based on the data from the years 2002 - 2018 the average number of fires per year is 14. The highest number of fires - 38 took place in 2013, and the least - 0 in 2005. The data has a dropping trend.
When looking into fire subcategories, the most incidents belonged to: Structure Fires (41.5%), and Outside Fires (35.5%).
Fire incident types reported to NFIRS in Zip Code 12581


 Nearest zip codes: 12514, 12567, 12545, 12501, 12578, 12571.


 Based on the data from the years 2002 - 2018 the average number of fires per year is 14. The highest number of fires - 38 took place in 2013, and the least - 0 in 2005. The data has a dropping trend.
 When looking into fire subcategories, the most incidents belonged to: Structure Fires (41.5%), and Outside Fires (35.5%).