Estimated zip code population in 2022: 9,450 Zip code population in 2010: 9,826 Zip code population in 2000: 8,842
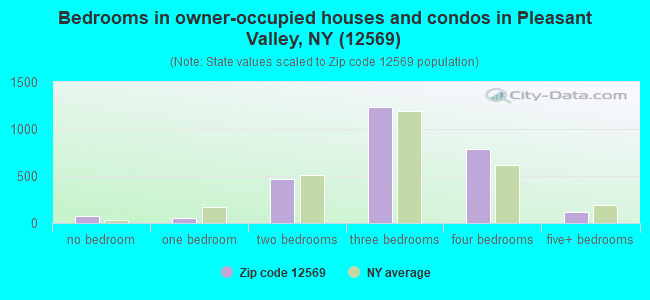
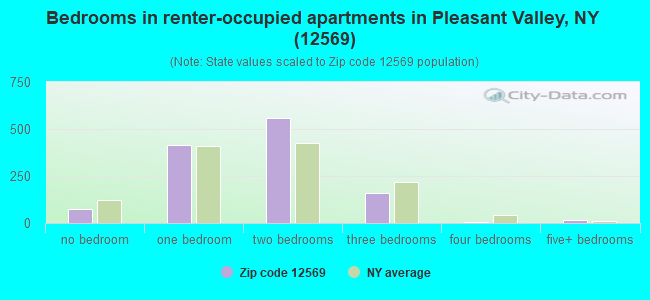
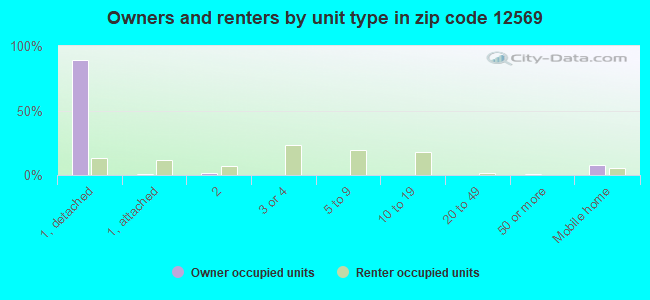
Houses and condos: 4,135 Renter-occupied apartments: 1,242
% of renters here:
31%
State:
46%
March 2022 cost of living index in zip code 12569: 117.3 (more than average, U.S. average is 100)
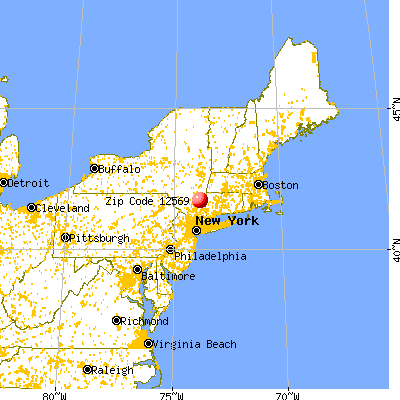
Land area: 33.0 sq. mi. Water area: 0.6 sq. mi.
Population density: 286 people per square mile
(very low).
OSM Map
General Map
Google Map
MSN Map
OSM Map
General Map
Google Map
MSN Map
OSM Map
General Map
Google Map
MSN Map
OSM Map
General Map
Google Map
MSN Map
Please wait while loading the map...
Real estate property taxes paid for housing units in 2022:
This zip code:
2.4% ($8,150)
New York:
1.5% ($6,180)
Median real estate property taxes paid for housing units with mortgages in 2022: $8,366 (2.3%) Median real estate property taxes paid for housing units with no mortgage in 2022: $7,792 (2.6%)
Business Search- 14 Million verified businesses
Males: 4,852
(51.3%)
Females: 4,598
(48.7%)
For population 25 years and over in 12569:
High school or higher: 95.4%
Bachelor's degree or higher: 36.5%
Graduate or professional degree: 18.6%
Unemployed: 3.3%
Mean travel time to work (commute): 34.1 minutes
For population 15 years and over in 12569:
Never married: 30.0%
Now married: 56.5%
Separated: 1.5%
Widowed: 4.4%
Divorced: 7.6%
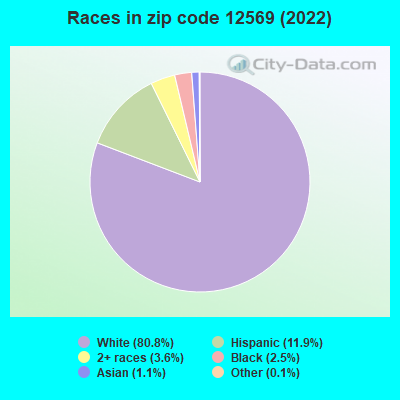
Zip code 12569 compared to state average:
Black race population percentage significantly below state average.
Foreign-born population percentage significantly below state average.
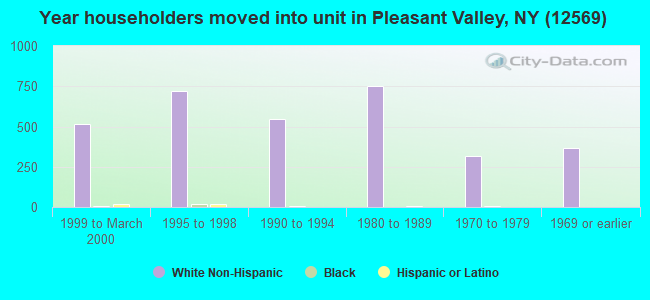
Length of stay since moving in above state average.
Estimated median house/condo value in 2022: $341,398
12569:
$341,398
New York:
$400,400
According to our research of New York and other state lists, there were 3 registered sex offenders living in 12569 zip code as of May 28, 2024. The ratio of all residents to sex offenders in zip code 12569 is 3,415 to 1. The ratio of registered sex offenders to all residents in this zip code is much lower than the state average.
Median resident age:
This zip code:
43.2 years
New York median age:
40.0 years
Average household size:
This zip code:
2.4 people
New York:
2.5 people
Averages for the 2020 tax year for zip code 12569, filed in 2021:
Average Adjusted Gross Income (AGI) in 2020: $92,359 (Individual Income Tax Returns)
Here:
$92,359
State:
$90,930
Salary/wage: $73,788 (reported on 81.2% of returns)
Here:
$73,788
State:
$72,104
(% of AGI for various income ranges: 1097.4% for AGIs below $25k, 3509.8% for AGIs $25k-50k, 6444.0% for AGIs $50k-75k, 9353.6% for AGIs $75k-100k, 17809.4% for AGIs $100k-200k, 80152.5% for AGIs over 200k)
Taxable interest for individuals: $1,495 (reported on 42.7% of returns)
This zip code:
$1,495
New York:
$3,075
(% of AGI for various income ranges: 18.1% for AGIs below $25k, 30.0% for AGIs $25k-50k, 55.3% for AGIs $50k-75k, 49.7% for AGIs $75k-100k, 158.1% for AGIs $100k-200k, 1251.7% for AGIs over 200k)
Ordinary dividends: $7,883 (reported on 25.9% of returns)
Here:
$7,883
State:
$11,095
(% of AGI for various income ranges: 36.7% for AGIs below $25k, 50.9% for AGIs $25k-50k, 104.5% for AGIs $50k-75k, 155.6% for AGIs $75k-100k, 370.0% for AGIs $100k-200k, 5560.8% for AGIs over 200k)
Net capital gain/loss in AGI: +$20,031 (reported on 21.3% of returns)
Here:
+$20,031
State:
+$44,925
(% of AGI for various income ranges: 21.4% for AGIs below $25k, 32.2% for AGIs $25k-50k, 80.9% for AGIs $50k-75k, 158.7% for AGIs $75k-100k, 427.9% for AGIs $100k-200k, 15515.8% for AGIs over 200k)
Profit/loss from business: +$17,600 (reported on 14.4% of returns)
Here:
+$17,600
State:
+$14,940
(% of AGI for various income ranges: 122.2% for AGIs below $25k, 160.1% for AGIs $25k-50k, 142.6% for AGIs $50k-75k, 163.1% for AGIs $75k-100k, 582.4% for AGIs $100k-200k, 4977.5% for AGIs over 200k)
Taxable individual retirement arrangement distribution: $16,798 (reported on 9.7% of returns)
12569:
$16,798
New York:
$19,609
(% of AGI for various income ranges: 54.0% for AGIs below $25k, 67.0% for AGIs $25k-50k, 177.9% for AGIs $50k-75k, 326.2% for AGIs $75k-100k, 534.7% for AGIs $100k-200k, 1701.7% for AGIs over 200k)
Self-employed (Keogh) retirement plans: $33,100 (reported on 0.7% of returns)
12569:
$33,100
New York:
$32,497
(% of AGI for various income ranges: 213.5% for AGIs $100k-200k)
Total itemized deductions: $30,378 (reported on 11.2% of returns)
Here:
$30,378
State:
$39,326
(% of AGI for various income ranges: 82.0% for AGIs below $25k, 129.9% for AGIs $25k-50k, 377.2% for AGIs $50k-75k, 635.6% for AGIs $75k-100k, 960.0% for AGIs $100k-200k, 4776.7% for AGIs over 200k)
Charity contributions: $7,026 (reported on 8.8% of returns)
Here:
$7,026
State:
$15,420
(% of AGI for various income ranges: 9.9% for AGIs $25k-50k, 42.1% for AGIs $50k-75k, 93.6% for AGIs $75k-100k, 183.5% for AGIs $100k-200k, 1224.2% for AGIs over 200k)
Taxes paid: $9,320 (reported on 11.2% of returns)
12569:
$9,320
State:
$9,183
(% of AGI for various income ranges: 17.5% for AGIs below $25k, 47.5% for AGIs $25k-50k, 150.9% for AGIs $50k-75k, 253.8% for AGIs $75k-100k, 325.6% for AGIs $100k-200k, 946.7% for AGIs over 200k)
Earned income credit: $1,673 (reported on 9.0% of returns)
Here:
$1,673
State:
$2,138
(% of AGI for various income ranges: 50.0% for AGIs below $25k, 40.0% for AGIs $25k-50k)
Percentage of individuals using paid preparers for their 2020 taxes: 95.1%
Here:
95%
State:
95%
(% for various income ranges: 94.0% for AGIs below $25k, 94.8% for AGIs $25k-50k, 95.1% for AGIs $50k-75k, 94.8% for AGIs $75k-100k, 96.3% for AGIs $100k-200k, 97.3% for AGIs over 200k)
Averages for the 2012 tax year for zip code 12569, filed in 2013:
Average Adjusted Gross Income (AGI) in 2012: $70,485 (Individual Income Tax Returns)
Here:
$70,485
State:
$77,088
Salary/wage: $61,786 (reported on 83.2% of returns)
Here:
$61,786
State:
$60,593
(% of AGI for various income ranges: 70.3% for AGIs below $25k, 73.3% for AGIs $25k-50k, 73.8% for AGIs $50k-75k, 73.1% for AGIs $75k-100k, 79.4% for AGIs $100k-200k, 63.7% for AGIs over 200k)
Taxable interest for individuals: $1,072 (reported on 51.4% of returns)
This zip code:
$1,072
New York:
$3,125
(% of AGI for various income ranges: 1.3% for AGIs below $25k, 0.7% for AGIs $25k-50k, 0.8% for AGIs $50k-75k, 0.6% for AGIs $75k-100k, 0.5% for AGIs $100k-200k, 1.2% for AGIs over 200k)
Ordinary dividends: $4,237 (reported on 28.4% of returns)
Here:
$4,237
State:
$10,299
(% of AGI for various income ranges: 2.2% for AGIs below $25k, 1.4% for AGIs $25k-50k, 1.5% for AGIs $50k-75k, 1.4% for AGIs $75k-100k, 1.3% for AGIs $100k-200k, 2.6% for AGIs over 200k)
Net capital gain/loss in AGI: +$7,224 (reported on 20.2% of returns)
Here:
+$7,224
State:
+$42,474
(% of AGI for various income ranges: 0.2% for AGIs below $25k, 0.3% for AGIs $50k-75k, 0.7% for AGIs $75k-100k, 1.0% for AGIs $100k-200k, 6.6% for AGIs over 200k)
Profit/loss from business: +$16,057 (reported on 14.4% of returns)
Here:
+$16,057
State:
+$16,168
(% of AGI for various income ranges: 5.7% for AGIs below $25k, 3.3% for AGIs $25k-50k, 2.4% for AGIs $50k-75k, 2.1% for AGIs $75k-100k, 3.1% for AGIs $100k-200k, 4.2% for AGIs over 200k)
Taxable individual retirement arrangement distribution: $13,834 (reported on 11.2% of returns)
12569:
$13,834
New York:
$17,621
(% of AGI for various income ranges: 2.6% for AGIs below $25k, 2.8% for AGIs $25k-50k, 2.5% for AGIs $50k-75k, 2.8% for AGIs $75k-100k, 2.0% for AGIs $100k-200k, 1.6% for AGIs over 200k)
Self-employment retirement plans: $20,067 (reported on 0.6% of returns)
12569:
$20,067
New York:
$27,330
Total itemized deductions: $26,925 (22% of AGI, reported on 43.0% of returns)
Here:
$26,925
State:
$34,985
Here:
22.2% of AGI
State:
21.3% of AGI
(% of AGI for various income ranges: 12.7% for AGIs below $25k, 12.9% for AGIs $25k-50k, 15.2% for AGIs $50k-75k, 18.1% for AGIs $75k-100k, 18.9% for AGIs $100k-200k, 15.1% for AGIs over 200k)
Charity contributions: $2,882 (reported on 37.0% of returns)
Here:
$2,882
State:
$5,572
(% of AGI for various income ranges: 0.6% for AGIs below $25k, 1.1% for AGIs $25k-50k, 1.1% for AGIs $50k-75k, 1.6% for AGIs $75k-100k, 1.6% for AGIs $100k-200k, 1.9% for AGIs over 200k)
Taxes paid: $13,988 (reported on 42.8% of returns)
12569:
$13,988
State:
$18,656
(% of AGI for various income ranges: 4.5% for AGIs below $25k, 5.0% for AGIs $25k-50k, 6.4% for AGIs $50k-75k, 8.7% for AGIs $75k-100k, 9.7% for AGIs $100k-200k, 10.1% for AGIs over 200k)
Earned income credit: $1,792 (reported on 10.4% of returns)
Here:
$1,792
State:
$2,230
(% of AGI for various income ranges: 3.8% for AGIs below $25k, 0.7% for AGIs $25k-50k)
Percentage of individuals using paid preparers for their 2012 taxes: 58.0%
Here:
58%
State:
66%
(% for various income ranges: 50.3% for AGIs below $25k, 54.5% for AGIs $25k-50k, 60.3% for AGIs $50k-75k, 64.3% for AGIs $75k-100k, 67.8% for AGIs $100k-200k, 68.2% for AGIs over 200k)
Averages for the 2004 tax year for zip code 12569, filed in 2005:
Average Adjusted Gross Income (AGI) in 2004: $59,010 (Individual Income Tax Returns)
Here:
$59,010
State:
$59,519
Salary/wage: $53,215 (reported on 84.6% of returns)
Here:
$53,215
State:
$50,673
(% of AGI for various income ranges: 133.8% for AGIs below $10k, 68.1% for AGIs $10k-25k, 79.1% for AGIs $25k-50k, 80.5% for AGIs $50k-75k, 84.0% for AGIs $75k-100k, 71.5% for AGIs over 100k)
Taxable interest for individuals: $1,139 (reported on 64.1% of returns)
This zip code:
$1,139
New York:
$2,377
(% of AGI for various income ranges: 6.9% for AGIs below $10k, 2.7% for AGIs $10k-25k, 1.1% for AGIs $25k-50k, 1.1% for AGIs $50k-75k, 1.0% for AGIs $75k-100k, 1.2% for AGIs over 100k)
Taxable dividends: $2,097 (reported on 34.9% of returns)
Here:
$2,097
State:
$5,394
(% of AGI for various income ranges: 5.9% for AGIs below $10k, 1.7% for AGIs $10k-25k, 1.0% for AGIs $25k-50k, 0.9% for AGIs $50k-75k, 1.0% for AGIs $75k-100k, 1.4% for AGIs over 100k)
Net capital gain/loss: +$6,897 (reported on 25.7% of returns)
Here:
+$6,897
State:
+$23,581
(% of AGI for various income ranges: -3.5% for AGIs below $10k, -0.1% for AGIs $10k-25k, -0.2% for AGIs $25k-50k, 1.0% for AGIs $50k-75k, 1.4% for AGIs $75k-100k, 5.6% for AGIs over 100k)
Profit/loss from business: +$14,440 (reported on 15.0% of returns)
Here:
+$14,440
State:
+$13,809
(% of AGI for various income ranges: 5.2% for AGIs below $10k, 5.3% for AGIs $10k-25k, 3.6% for AGIs $25k-50k, 1.5% for AGIs $50k-75k, 1.5% for AGIs $75k-100k, 4.9% for AGIs over 100k)
IRA payment deduction: $3,264 (reported on 3.5% of returns)
12569:
$3,264
New York:
$3,115
(% of AGI for various income ranges: 0.3% for AGIs $10k-25k, 0.3% for AGIs $25k-50k, 0.3% for AGIs $50k-75k, 0.2% for AGIs $75k-100k, 0.1% for AGIs over 100k)
Self-employed pension: $15,286 (reported on 1.2% of returns)
Here:
$15,286
New York:
$19,016
Total itemized deductions: $22,130 (22% of AGI, reported on 44.4% of returns)
Here:
$22,130
State:
$25,864
Here:
22.0% of AGI
State:
21.9% of AGI
(% of AGI for various income ranges: 22.1% for AGIs below $10k, 13.6% for AGIs $10k-25k, 12.3% for AGIs $25k-50k, 18.0% for AGIs $50k-75k, 18.7% for AGIs $75k-100k, 17.0% for AGIs over 100k)
Charity contributions deductions: $2,478 (2% of AGI, reported on 41.6% of returns)
Here:
$2,478
State:
$4,439
Here:
2.4% of AGI
State:
3.6% of AGI
(% of AGI for various income ranges: 0.8% for AGIs below $10k, 0.7% for AGIs $10k-25k, 1.2% for AGIs $25k-50k, 1.7% for AGIs $50k-75k, 2.1% for AGIs $75k-100k, 1.9% for AGIs over 100k)
Total tax: $9,268 (reported on 81.4% of returns)
12569:
$9,268
State:
$11,730
(% of AGI for various income ranges: 3.9% for AGIs below $10k, 4.8% for AGIs $10k-25k, 7.6% for AGIs $25k-50k, 8.6% for AGIs $50k-75k, 9.6% for AGIs $75k-100k, 17.7% for AGIs over 100k)
Earned income credit: $1,354 (reported on 7.4% of returns)
Here:
$1,354
State:
$1,757
Percentage of individuals using paid preparers for their 2004 taxes: 62.7%
Here:
63%
State:
67%
(% for various income ranges: 52.4% for AGIs below $10k, 63.0% for AGIs $10k-25k, 61.9% for AGIs $25k-50k, 68.4% for AGIs $50k-75k, 67.3% for AGIs $75k-100k, 66.4% for AGIs over 100k)
Likely homosexual households (counted as self-reported same-sex unmarried-partner households)
Lesbian couples: 0.4% of all households
Gay men: 0.0% of all households
Household received Food Stamps/SNAP in the past 12 months: 246 Household did not receive Food Stamps/SNAP in the past 12 months: 3,672
Women who had a birth in the past 12 months: 141 (117 now married, 23 unmarried) Women who did not have a birth in the past 12 months: 1,760 (880 now married, 868 unmarried)
Housing units in zip code 12569 with a mortgage: 1,635 (249 second mortgage, 232 both second mortgage and home equity loan) Houses without a mortgage: 98
Median monthly owner costs for units with a mortgage: $2,449 Median monthly owner costs for units without a mortgage: $1,023
Residents with income below the poverty level in 2022:
This zip code:
4.8%
Whole state:
14.3%
Residents with income below 50% of the poverty level in 2022:
This zip code:
1.5%
Whole state:
6.8%
Median number of rooms in houses and condos:
Here:
6.8
State:
6.3
Median number of rooms in apartments:
Here:
3.5
State:
3.8
Notable locations in this zip code not listed on our city pages
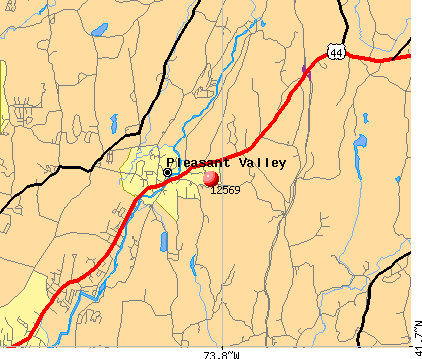
Notable locations in zip code 12569: James Baird State Park Golf Course (A), Rockhedge Herb Farm (B), Wigstens Farm (C), Derry Dol Farm (D), Pleasant Valley Free Library (E), Pleasant Valley Fire Company 1 (F). Display/hide their locations on the map
Churches in zip code 12569 include: Pleasant Valley Presbyterian Church (A), Saint Stanislaus Church (B), His Way Ministries (C), Saint Pauls Episcopal Church (D), Pleasant Valley United Methodist Church (E). Display/hide their locations on the map
1,472 married couples with children.
175 single-parent households (39 men, 136 women).
88.6% of residents of 12569 zip code speak English at home.
5.2% of residents speak Spanish at home (76% very well, 18% well, 3% not well, 3% not at all).
4.6% of residents speak other Indo-European language at home (89% very well, 7% well, 4% not well).
0.9% of residents speak Asian or Pacific Island language at home (96% very well, 4% well).
0.4% of residents speak other language at home (100% very well).
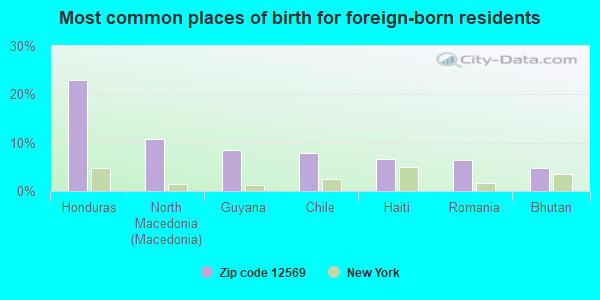
Foreign born population: 718 (7.6%) (55.9% of them are naturalized citizens)
This zip code:
7.6%
Whole state:
22.7%
23%Honduras
11%North Macedonia (Macedonia)
8%Guyana
8%Chile
7%Haiti
6%Romania
5%Bhutan
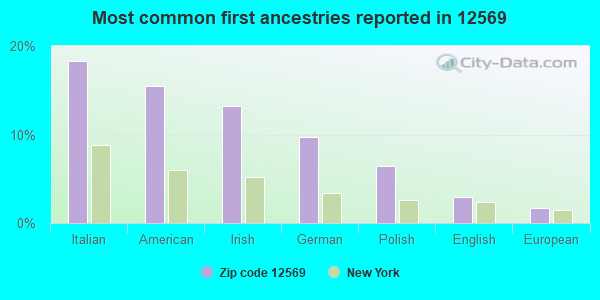
18%Italian
15%American
13%Irish
10%German
6%Polish
3%English
2%European
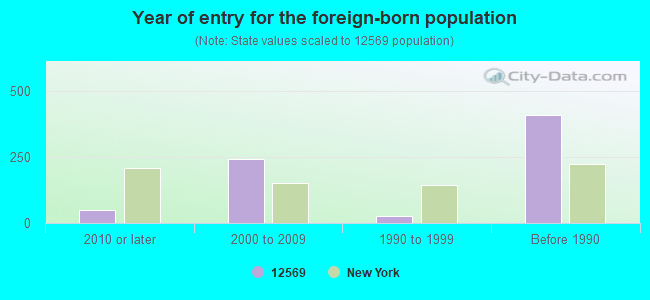
Year of entry for the foreign-born population
512010 or later
2412000 to 2009
271990 to 1999
408Before 1990
Facilities with environmental interests located in this zip code:
CONKLIN CORP (199 WEST ROAD in PLEASANT VALLEY, NY)
STATE MASTER (New York facility tracking) - AIR PROGRAM, HAZARDOUS WASTE PROGRAM CRITERIA AND HAZARDOUS AIR POLLUTANT INVENTORY (Inventory of air pollution sources) Small Quantity Generators, between 100 kg and 1000 kg of hazardous waste/month (Resource Conservation and Recovery Act (tracking hazardous waste)) - notification TRI REPORTER (Tracking of toxic chemicals releasing facilities) Business SIC classification: TELEPHONE AND TELEGRAPH APPARATUS Organizations: OWNERNAME (CONTACT/OWNER)
Alternative names: CONKLIN CORP., CONKLIN INSTRUMENT CORP
GODDARD'S SVC STA (1699 MAIN ST in PLEASANT VALLEY, NY)
(Integrated Compliance Information System) - ICIS-HQ-2001-0578, FORMAL ENFORCEMENT ACTION Business SIC classification: GASOLINE SERVICE STATIONS
ARLINGTON CENTRAL SCHOOL DIST (WEST RD 4/10 MI E OF RTE 115 in PLEASANT VALLEY, NY)
(Resource Conservation and Recovery Act (tracking hazardous waste))
ARLINGTON CENTRAL SCHOOL DIST (TRAVER RD 2/10 MI S OF RTE 44 in PLEASANT VALLEY, NY)
(Resource Conservation and Recovery Act (tracking hazardous waste))
GETTY PETROLEUM CORPORATION (ROUTE 44 in PLEASANT VALLEY, NY)
(Resource Conservation and Recovery Act (tracking hazardous waste))
H.R. HARKINS, INC (PLEASANT VIEW RD in PLEASANT VALLEY, NY)
COMPLIANCE ACTIVITY (Tracking inspections of insecticide, fungicide, and rodenticide, and toxic substances) Alternative names: H.B. HARKINS
Housing units lacking complete plumbing facilities: 0.7% Housing units lacking complete kitchen facilities: 1.2%
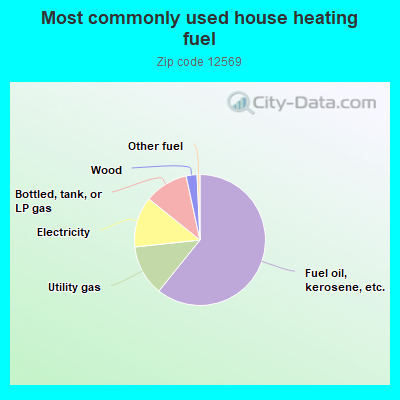
60.8%Fuel oil, kerosene, etc.
12.5%Utility gas
12.5%Electricity
10.8%Bottled, tank, or LP gas
2.7%Wood
0.7%Other fuel
Population in 1990: 7,978. Population change in the 1990s: +864 (+10.8%).
Place of birth for U.S.-born residents:
This state: 6,843
Northeast: 1,144
Midwest: 169
South: 324
West: 201
65% of the 12569 zip code residents lived in the same house 5 years ago. Out of people who lived in different houses, 68% lived in this county. Out of people who lived in different counties, 50% lived in New York.
94% of the 12569 zip code residents lived in the same house 1 year ago. Out of people who lived in different houses, 44% moved from this county. Out of people who lived in different houses, 10% moved from different county within same state. Out of people who lived in different houses, 45% moved from different state. Out of people who lived in different houses, 2% moved from abroad.
Private vs. public school enrollment:
Students in private schools in grades 1 to 8 (elementary and middle school): 69
Here:
8.7%
New York:
15.6%
Students in private schools in grades 9 to 12 (high school):
Here:
0.0%
New York:
15.0%
Students in private undergraduate colleges: 78
Here:
18.4%
New York:
39.2%
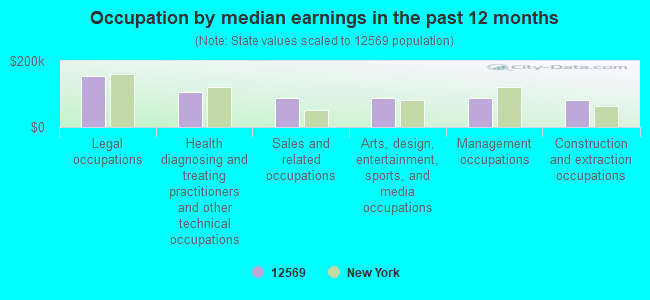
Occupation by median earnings in the past 12 months ($)
154,038Legal occupations
106,598Health diagnosing and treating practitioners and other technical occupations
87,478Sales and related occupations
87,103Arts, design, entertainment, sports, and media occupations
86,970Management occupations
82,416Construction and extraction occupations
Companies with federal contracts located in this zip code:
FAIL-SAFE TECHNICAL ASSOCIATES (1882 ROUTE 44 in PLEASANT VALLE, NY; small business) : $48,655 in 4 contractsfrom 2000 to 2003
$40,000 with Army for Fire Protection Services. Signed on 2000-09-11. Completion date: 2000-10-30.
$7,983 with Army for Maintenance, Repair and Rebuilding of Equipment -- Electric Wire, and Power and Distribution Equipment. Signed on 2003-11-03. Completion date: 2003-10-31.
$672, same as above.Signed on 2003-07-02. Completion date: 2003-10-31.
$0, same as above.Signed on 2003-07-02. Completion date: 2003-10-31.
Top industries in this zip code by the number of employees in 2005:
Construction: Commercial and Institutional Building Construction (100-249 employees: 1 establishment, 20-49 employees: 1 establishment, 5-9 employees: 1 establishment, 1-4 employees: 1 establishment)
Health Care and Social Assistance: Residential Mental Retardation Facilities (20-49: 2, 10-19: 1, 5-9: 2)
2002 - 2018 National Fire Incident Reporting System (NFIRS) incidents
Based on the data from the years 2002 - 2018 the average number of fires per year is 44. The highest number of fires - 60 took place in 2015, and the least - 15 in 2004. The data has a growing trend.
When looking into fire subcategories, the most incidents belonged to: Structure Fires (69.1%), and Outside Fires (20.4%).
Fire incident types reported to NFIRS in Zip Code 12569


 Nearest zip codes: 12578, 12603, 12540, 12585, 12604, 12538.


 Based on the data from the years 2002 - 2018 the average number of fires per year is 44. The highest number of fires - 60 took place in 2015, and the least - 15 in 2004. The data has a growing trend.
 When looking into fire subcategories, the most incidents belonged to: Structure Fires (69.1%), and Outside Fires (20.4%).