Estimated zip code population in 2022: 828 Zip code population in 2010: 885 Zip code population in 2000: 956
Houses and condos: 397 Renter-occupied apartments: 52
% of renters here:
13%
State:
46%
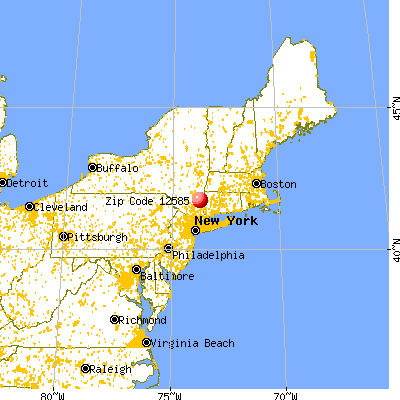
March 2022 cost of living index in zip code 12585: 116.0 (more than average, U.S. average is 100)
Land area: 4.9 sq. mi. Water area: 0.1 sq. mi.
Population density: 168 people per square mile
(very low).
OSM Map
General Map
Google Map
MSN Map
OSM Map
General Map
Google Map
MSN Map
OSM Map
General Map
Google Map
MSN Map
OSM Map
General Map
Google Map
MSN Map
Please wait while loading the map...
Real estate property taxes paid for housing units in 2022:
This zip code:
1.5% ($7,851)
New York:
1.5% ($6,180)
Median real estate property taxes paid for housing units with mortgages in 2022: $8,690 (1.4%) Median real estate property taxes paid for housing units with no mortgage in 2022: $7,437 (1.6%)
Estimated median house/condo value in 2022: $527,160
12585:
$527,160
New York:
$400,400
According to our research of New York and other state lists, there was 1 registered sex offender living in 12585 zip code as of May 28, 2024. The ratio of all residents to sex offenders in zip code 12585 is 913 to 1. The ratio of registered sex offenders to all residents in this zip code is near the state average.
Median resident age:
This zip code:
60.7 years
New York median age:
40.0 years
Average household size:
This zip code:
2.0 people
New York:
2.5 people
Averages for the 2020 tax year for zip code 12585, filed in 2021:
Average Adjusted Gross Income (AGI) in 2020: $104,717 (Individual Income Tax Returns)
Here:
$104,717
State:
$90,930
Salary/wage: $83,047 (reported on 78.3% of returns)
Here:
$83,047
State:
$72,104
(% of AGI for various income ranges: 1191.7% for AGIs below $25k, 3246.7% for AGIs $25k-50k, 5712.0% for AGIs $50k-75k, 9180.0% for AGIs $75k-100k, 14471.2% for AGIs $100k-200k)
Taxable interest for individuals: $710 (reported on 45.7% of returns)
This zip code:
$710
New York:
$3,075
(% of AGI for various income ranges: 16.7% for AGIs $25k-50k, 4.0% for AGIs $50k-75k, 40.0% for AGIs $75k-100k, 60.0% for AGIs $100k-200k)
Ordinary dividends: $7,143 (reported on 30.4% of returns)
Here:
$7,143
State:
$11,095
(% of AGI for various income ranges: 73.3% for AGIs below $25k, 198.0% for AGIs $50k-75k, 178.8% for AGIs $100k-200k)
Net capital gain/loss in AGI: +$12,145 (reported on 23.9% of returns)
Here:
+$12,145
State:
+$44,925
(% of AGI for various income ranges: 11.7% for AGIs below $25k, 80.0% for AGIs $50k-75k, 170.0% for AGIs $100k-200k)
Profit/loss from business: +$14,267 (reported on 13.0% of returns)
Here:
+$14,267
State:
+$14,940
(% of AGI for various income ranges: 691.7% for AGIs $25k-50k, 551.2% for AGIs $100k-200k)
Taxable individual retirement arrangement distribution: $25,667 (reported on 6.5% of returns)
12585:
$25,667
New York:
$19,609
(% of AGI for various income ranges: 962.5% for AGIs $100k-200k)
Total itemized deductions: $24,362 (reported on 17.4% of returns)
Here:
$24,362
State:
$39,326
(% of AGI for various income ranges: 828.3% for AGIs $25k-50k, 1815.0% for AGIs $100k-200k)
Charity contributions: $4,750 (reported on 13.0% of returns)
Here:
$4,750
State:
$15,420
(% of AGI for various income ranges: 356.2% for AGIs $100k-200k)
Taxes paid: $8,412 (reported on 17.4% of returns)
12585:
$8,412
State:
$9,183
(% of AGI for various income ranges: 356.7% for AGIs $25k-50k, 573.8% for AGIs $100k-200k)
Earned income credit: $1,025 (reported on 8.7% of returns)
Here:
$1,025
State:
$2,138
(% of AGI for various income ranges: 68.3% for AGIs below $25k)
Percentage of individuals using paid preparers for their 2020 taxes: 95.7%
Here:
96%
State:
95%
(% for various income ranges: 90.0% for AGIs below $25k, 87.5% for AGIs $25k-50k, 100.0% for AGIs $50k-75k, 100.0% for AGIs $75k-100k, 100.0% for AGIs $100k-200k, 100.0% for AGIs over 200k)
Averages for the 2012 tax year for zip code 12585, filed in 2013:
Average Adjusted Gross Income (AGI) in 2012: $72,141 (Individual Income Tax Returns)
Here:
$72,141
State:
$77,088
Salary/wage: $60,597 (reported on 80.4% of returns)
Here:
$60,597
State:
$60,593
(% of AGI for various income ranges: 63.9% for AGIs below $25k, 76.6% for AGIs $25k-50k, 68.9% for AGIs $50k-75k, 68.2% for AGIs $75k-100k, 69.0% for AGIs $100k-200k, 61.8% for AGIs over 200k)
Taxable interest for individuals: $617 (reported on 52.2% of returns)
This zip code:
$617
New York:
$3,125
(% of AGI for various income ranges: 1.1% for AGIs below $25k, 0.1% for AGIs $25k-50k, 0.8% for AGIs $50k-75k, 0.5% for AGIs $75k-100k, 0.2% for AGIs $100k-200k, 0.6% for AGIs over 200k)
Ordinary dividends: $2,179 (reported on 30.4% of returns)
Here:
$2,179
State:
$10,299
(% of AGI for various income ranges: 2.0% for AGIs below $25k, 1.1% for AGIs $50k-75k, 1.8% for AGIs $100k-200k)
Net capital gain/loss in AGI: +$5,878 (reported on 19.6% of returns)
Here:
+$5,878
State:
+$42,474
(% of AGI for various income ranges: 1.1% for AGIs below $25k, 4.0% for AGIs $100k-200k)
Profit/loss from business: +$19,812 (reported on 17.4% of returns)
Here:
+$19,812
State:
+$16,168
(% of AGI for various income ranges: 19.9% for AGIs below $25k, 2.7% for AGIs $50k-75k, 9.1% for AGIs $100k-200k)
Taxable individual retirement arrangement distribution: $11,600 (reported on 8.7% of returns)
12585:
$11,600
New York:
$17,621
Total itemized deductions: $24,100 (22% of AGI, reported on 50.0% of returns)
Here:
$24,100
State:
$34,985
Here:
22.1% of AGI
State:
21.3% of AGI
(% of AGI for various income ranges: 23.1% for AGIs $25k-50k, 15.0% for AGIs $50k-75k, 18.5% for AGIs $75k-100k, 18.3% for AGIs $100k-200k, 14.9% for AGIs over 200k)
Charity contributions: $2,753 (reported on 37.0% of returns)
Here:
$2,753
State:
$5,572
(% of AGI for various income ranges: 1.4% for AGIs below $25k, 0.4% for AGIs $50k-75k, 1.2% for AGIs $75k-100k, 1.7% for AGIs $100k-200k, 2.0% for AGIs over 200k)
Taxes paid: $10,970 (reported on 50.0% of returns)
12585:
$10,970
State:
$18,656
(% of AGI for various income ranges: 6.4% for AGIs $25k-50k, 6.2% for AGIs $50k-75k, 7.6% for AGIs $75k-100k, 8.6% for AGIs $100k-200k, 8.5% for AGIs over 200k)
Earned income credit: $1,750 (reported on 8.7% of returns)
Here:
$1,750
State:
$2,230
(% of AGI for various income ranges: 4.4% for AGIs below $25k)
Percentage of individuals using paid preparers for their 2012 taxes: 60.9%
Here:
61%
State:
66%
(% for various income ranges: 57.1% for AGIs below $25k, 50.0% for AGIs $25k-50k, 66.7% for AGIs $50k-75k, 60.0% for AGIs $75k-100k, 90.0% for AGIs $100k-200k)
Averages for the 2004 tax year for zip code 12585, filed in 2005:
Average Adjusted Gross Income (AGI) in 2004: $60,865 (Individual Income Tax Returns)
Here:
$60,865
State:
$59,519
Salary/wage: $57,876 (reported on 85.3% of returns)
Here:
$57,876
State:
$50,673
(% of AGI for various income ranges: 83.3% for AGIs below $10k, 61.8% for AGIs $10k-25k, 81.1% for AGIs $25k-50k, 78.8% for AGIs $50k-75k, 80.3% for AGIs $75k-100k, 83.7% for AGIs over 100k)
Taxable interest for individuals: $676 (reported on 64.6% of returns)
This zip code:
$676
New York:
$2,377
(% of AGI for various income ranges: 2.1% for AGIs below $10k, 3.1% for AGIs $10k-25k, 0.7% for AGIs $25k-50k, 0.7% for AGIs $50k-75k, 0.7% for AGIs $75k-100k, 0.5% for AGIs over 100k)
Taxable dividends: $1,703 (reported on 36.2% of returns)
Here:
$1,703
State:
$5,394
(% of AGI for various income ranges: 4.9% for AGIs below $10k, 3.8% for AGIs $10k-25k, 0.3% for AGIs $25k-50k, 0.4% for AGIs $50k-75k, 0.5% for AGIs $75k-100k, 1.2% for AGIs over 100k)
Net capital gain/loss: +$1,371 (reported on 24.0% of returns)
Here:
+$1,371
State:
+$23,581
(% of AGI for various income ranges: -1.2% for AGIs below $10k, 0.3% for AGIs $10k-25k, -0.3% for AGIs $25k-50k, 0.3% for AGIs $50k-75k, -0.3% for AGIs $75k-100k, 1.2% for AGIs over 100k)
Profit/loss from business: +$7,112 (reported on 16.6% of returns)
Here:
+$7,112
State:
+$13,809
(% of AGI for various income ranges: 31.2% for AGIs below $10k, 3.2% for AGIs $25k-50k, 2.5% for AGIs $50k-75k, 3.6% for AGIs $75k-100k, 0.1% for AGIs over 100k)
IRA payment deduction: $3,182 (reported on 2.3% of returns)
12585:
$3,182
New York:
$3,115
Total itemized deductions: $23,761 (23% of AGI, reported on 46.8% of returns)
Here:
$23,761
State:
$25,864
Here:
23.1% of AGI
State:
21.9% of AGI
(% of AGI for various income ranges: 42.0% for AGIs below $10k, 17.7% for AGIs $25k-50k, 25.6% for AGIs $50k-75k, 19.9% for AGIs $75k-100k, 16.8% for AGIs over 100k)
Charity contributions deductions: $2,567 (2% of AGI, reported on 43.1% of returns)
Here:
$2,567
State:
$4,439
Here:
2.4% of AGI
State:
3.6% of AGI
(% of AGI for various income ranges: 2.0% for AGIs $25k-50k, 1.7% for AGIs $50k-75k, 1.6% for AGIs $75k-100k, 2.1% for AGIs over 100k)
Total tax: $9,909 (reported on 81.6% of returns)
12585:
$9,909
State:
$11,730
(% of AGI for various income ranges: 4.5% for AGIs below $10k, 5.1% for AGIs $10k-25k, 8.1% for AGIs $25k-50k, 8.6% for AGIs $50k-75k, 9.9% for AGIs $75k-100k, 18.1% for AGIs over 100k)
Earned income credit: $1,303 (reported on 6.8% of returns)
Here:
$1,303
State:
$1,757
Percentage of individuals using paid preparers for their 2004 taxes: 59.6%
Here:
60%
State:
67%
(% for various income ranges: 50.5% for AGIs below $10k, 56.4% for AGIs $10k-25k, 63.8% for AGIs $25k-50k, 73.3% for AGIs $50k-75k, 55.1% for AGIs $75k-100k, 63.0% for AGIs over 100k)
Household received Food Stamps/SNAP in the past 12 months: 0 Household did not receive Food Stamps/SNAP in the past 12 months: 394
Women who did not have a birth in the past 12 months: 144 (35 now married, 109 unmarried)
Housing units in zip code 12585 with a mortgage: 135 (17 second mortgage, 17 both second mortgage and home equity loan) Median monthly owner costs for units with a mortgage: $2,645 Median monthly owner costs for units without a mortgage: $1,149
Residents with income below the poverty level in 2022:
This zip code:
27.0%
Whole state:
14.3%
Residents with income below 50% of the poverty level in 2022:
This zip code:
10.8%
Whole state:
6.8%
Median number of rooms in houses and condos:
Here:
8.0
State:
6.3
Notable locations in this zip code not listed on our city pages
In group quarters: 45 (-1 institutionalized population)
Size of family households: 165 2-persons, 29 3-persons, 20 4-persons, 5 5-persons
Size of nonfamily households: 120 1-person, 66 2-persons
55 married couples with children.
0 single-parent households ().
83.4% of residents of 12585 zip code speak English at home.
1.1% of residents speak Spanish at home (100% very well).
5.7% of residents speak other Indo-European language at home (100% very well).
8.3% of residents speak Asian or Pacific Island language at home (100% very well).
2.3% of residents speak other language at home (100% very well).
Foreign born population: 162 (19.6%) (94.7% of them are naturalized citizens)
This zip code:
19.6%
Whole state:
22.7%
24%Greece
12%France
9%Poland
9%Ecuador
36%Italian
15%American
6%Polish
5%Russian
5%Ukrainian
3%German
3%English
Year of entry for the foreign-born population
02010 or later
182000 to 2009
261990 to 1999
120Before 1990
Facilities with environmental interests located in this zip code:
AGWAY ENERGY PRODUCTS (ON THE GREEN in VERBANK, NY)
(Resource Conservation and Recovery Act (tracking hazardous waste))
64.9%Fuel oil, kerosene, etc.
23.0%Electricity
7.7%Bottled, tank, or LP gas
4.9%Other fuel
Population in 1990: 989.
Place of birth for U.S.-born residents:
This state: 486
Northeast: 117
Midwest: 8
South: 24
West: 18
60% of the 12585 zip code residents lived in the same house 5 years ago. Out of people who lived in different houses, 82% lived in this county. Out of people who lived in different counties, 50% lived in New York.
92% of the 12585 zip code residents lived in the same house 1 year ago. Out of people who lived in different houses, 94% moved from this county.
Private vs. public school enrollment:
Students in private schools in grades 1 to 8 (elementary and middle school):
Here:
0.0%
New York:
15.6%
Students in private schools in grades 9 to 12 (high school): 1
Here:
7.6%
New York:
15.0%
Students in private undergraduate colleges:
Here:
0.0%
New York:
39.2%
Occupation by median earnings in the past 12 months ($)
69,363Sales and related occupations
66,943Management occupations
66,445Installation, maintenance, and repair occupations
40,532Production occupations
36,746Office and administrative support occupations
32,527Healthcare support occupations
Top industries in this zip code by the number of employees in 2005:
Health Care and Social Assistance: Residential Mental Retardation Facilities (10-19 employees: 1 establishment)
Professional, Scientific, and Technical Services: Offices of Certified Public Accountants (5-9: 1)
Accommodation and Food Services: Recreational and Vacation Camps (except Campgrounds) (5-9: 1)
Administrative and Support and Waste Management and Remediation Services: Landscaping Services (1-4: 2)
Other Services (except Public Administration): General Automotive Repair (1-4: 2)
Health Care and Social Assistance: Child Day Care Services (1-4: 1)
Other Services (except Public Administration): Appliance Repair and Maintenance (1-4: 1)
Finance and Insurance: Insurance Agencies and Brokerages (1-4: 1)
Construction: Plumbing, Heating, and Air-Conditioning Contractors (1-4: 1)
Health Care and Social Assistance: Offices of Dentists (1-4: 1)
People in group quarters in 2010:
20 people in group homes intended for adults
12 people in residential treatment centers for adults
People in group quarters in 2000:
15 people in homes for the mentally retarded
Fatal accident statistics in 2013:
Fatal accident count: 1
Vehicles involved in fatal accidents: 1
Fatal accidents caused by drunken drivers: 0
Fatalities: 1
Persons involved in fatal accidents: 1
Pedestrians involved in fatal accidents: 0
Home Mortgage Disclosure Act Aggregated Statistics For Year 2009 (Based on 2 partial tracts)
A) FHA, FSA/RHS & VA Home Purchase Loans
B) Conventional Home Purchase Loans
C) Refinancings
D) Home Improvement Loans
F) Non-occupant Loans on < 5 Family Dwellings (A B C & D)
Number
Average Value
Number
Average Value
Number
Average Value
Number
Average Value
Number
Average Value
LOANS ORIGINATED
2
$301,950
4
$266,400
28
$240,007
1
$96,650
2
$213,920
APPLICATIONS APPROVED, NOT ACCEPTED
0
$0
0
$0
2
$414,605
0
$0
0
$0
APPLICATIONS DENIED
1
$258,550
2
$223,615
11
$340,091
2
$46,170
0
$0
APPLICATIONS WITHDRAWN
1
$182,530
1
$280,710
9
$283,962
0
$0
1
$70,180
FILES CLOSED FOR INCOMPLETENESS
0
$0
0
$0
3
$449,080
0
$0
1
$480,170
Aggregated Statistics For Year 2008 (Based on 2 partial tracts)
A) FHA, FSA/RHS & VA Home Purchase Loans
B) Conventional Home Purchase Loans
C) Refinancings
D) Home Improvement Loans
F) Non-occupant Loans on < 5 Family Dwellings (A B C & D)
Number
Average Value
Number
Average Value
Number
Average Value
Number
Average Value
Number
Average Value
LOANS ORIGINATED
1
$191,140
11
$316,530
18
$256,209
2
$85,105
1
$191,760
APPLICATIONS APPROVED, NOT ACCEPTED
0
$0
2
$167,135
4
$334,810
0
$0
0
$0
APPLICATIONS DENIED
0
$0
2
$315,185
16
$294,603
3
$104,960
1
$377,980
APPLICATIONS WITHDRAWN
1
$136,970
1
$365,970
7
$283,527
1
$155,130
0
$0
FILES CLOSED FOR INCOMPLETENESS
0
$0
0
$0
1
$486,320
0
$0
0
$0
Aggregated Statistics For Year 2007 (Based on 2 partial tracts)
B) Conventional Home Purchase Loans
C) Refinancings
D) Home Improvement Loans
F) Non-occupant Loans on < 5 Family Dwellings (A B C & D)
Number
Average Value
Number
Average Value
Number
Average Value
Number
Average Value
LOANS ORIGINATED
16
$310,359
21
$238,457
8
$84,914
2
$376,285
APPLICATIONS APPROVED, NOT ACCEPTED
2
$290,565
8
$325,152
1
$190,840
1
$207,150
APPLICATIONS DENIED
2
$374,130
23
$347,252
5
$191,760
1
$164,060
APPLICATIONS WITHDRAWN
4
$259,090
12
$293,410
3
$117,477
0
$0
FILES CLOSED FOR INCOMPLETENESS
1
$270,250
5
$297,088
1
$200,070
0
$0
Aggregated Statistics For Year 2006 (Based on 2 partial tracts)
B) Conventional Home Purchase Loans
C) Refinancings
D) Home Improvement Loans
F) Non-occupant Loans on < 5 Family Dwellings (A B C & D)
Number
Average Value
Number
Average Value
Number
Average Value
Number
Average Value
LOANS ORIGINATED
15
$288,470
28
$249,263
12
$131,277
3
$470,010
APPLICATIONS APPROVED, NOT ACCEPTED
3
$215,767
4
$312,802
1
$146,210
0
$0
APPLICATIONS DENIED
4
$288,332
20
$365,974
4
$201,762
1
$109,580
APPLICATIONS WITHDRAWN
2
$233,775
15
$301,254
2
$53,095
0
$0
FILES CLOSED FOR INCOMPLETENESS
1
$458,620
5
$440,462
0
$0
0
$0
Aggregated Statistics For Year 2005 (Based on 2 partial tracts)
B) Conventional Home Purchase Loans
C) Refinancings
D) Home Improvement Loans
F) Non-occupant Loans on < 5 Family Dwellings (A B C & D)
Number
Average Value
Number
Average Value
Number
Average Value
Number
Average Value
LOANS ORIGINATED
26
$325,297
34
$247,544
10
$63,499
2
$254,395
APPLICATIONS APPROVED, NOT ACCEPTED
4
$544,268
7
$229,136
1
$35,700
0
$0
APPLICATIONS DENIED
2
$725,025
16
$317,438
5
$119,918
0
$0
APPLICATIONS WITHDRAWN
3
$545,523
15
$263,456
5
$156,548
0
$0
FILES CLOSED FOR INCOMPLETENESS
1
$268,400
10
$280,868
0
$0
0
$0
Aggregated Statistics For Year 2004 (Based on 2 partial tracts)
B) Conventional Home Purchase Loans
C) Refinancings
D) Home Improvement Loans
F) Non-occupant Loans on < 5 Family Dwellings (A B C & D)
G) Loans On Manufactured Home Dwelling (A B C & D)
Number
Average Value
Number
Average Value
Number
Average Value
Number
Average Value
Number
Average Value
LOANS ORIGINATED
26
$310,416
41
$222,697
5
$128,292
3
$573,227
0
$0
APPLICATIONS APPROVED, NOT ACCEPTED
5
$246,056
11
$219,965
0
$0
1
$209,300
0
$0
APPLICATIONS DENIED
4
$400,988
16
$263,227
6
$102,087
1
$402,290
1
$38,480
APPLICATIONS WITHDRAWN
3
$305,133
16
$235,198
1
$152,360
1
$217,920
0
$0
FILES CLOSED FOR INCOMPLETENESS
0
$0
8
$206,572
0
$0
0
$0
0
$0
Aggregated Statistics For Year 2003 (Based on 2 partial tracts)
B) Conventional Home Purchase Loans
C) Refinancings
D) Home Improvement Loans
F) Non-occupant Loans on < 5 Family Dwellings (A B C & D)
Number
Average Value
Number
Average Value
Number
Average Value
Number
Average Value
LOANS ORIGINATED
22
$276,013
89
$183,217
4
$43,862
3
$147,743
APPLICATIONS APPROVED, NOT ACCEPTED
6
$301,695
15
$209,304
1
$12,310
0
$0
APPLICATIONS DENIED
2
$297,025
19
$190,966
2
$48,015
1
$102,190
APPLICATIONS WITHDRAWN
3
$282,970
18
$208,911
1
$27,390
0
$0
FILES CLOSED FOR INCOMPLETENESS
1
$193,300
4
$286,022
0
$0
0
$0
Aggregated Statistics For Year 2002 (Based on 2 partial tracts)
A) FHA, FSA/RHS & VA Home Purchase Loans
B) Conventional Home Purchase Loans
C) Refinancings
D) Home Improvement Loans
F) Non-occupant Loans on < 5 Family Dwellings (A B C & D)
Number
Average Value
Number
Average Value
Number
Average Value
Number
Average Value
Number
Average Value
LOANS ORIGINATED
1
$119,430
23
$256,906
53
$168,024
4
$29,165
2
$420,915
APPLICATIONS APPROVED, NOT ACCEPTED
0
$0
1
$459,240
10
$149,929
1
$39,400
0
$0
APPLICATIONS DENIED
0
$0
2
$261,785
11
$176,454
3
$56,943
0
$0
APPLICATIONS WITHDRAWN
0
$0
2
$168,215
12
$149,745
3
$52,633
0
$0
FILES CLOSED FOR INCOMPLETENESS
0
$0
1
$81,570
6
$157,645
0
$0
0
$0
Aggregated Statistics For Year 2001 (Based on 2 partial tracts)
A) FHA, FSA/RHS & VA Home Purchase Loans
B) Conventional Home Purchase Loans
C) Refinancings
D) Home Improvement Loans
F) Non-occupant Loans on < 5 Family Dwellings (A B C & D)
Number
Average Value
Number
Average Value
Number
Average Value
Number
Average Value
Number
Average Value
LOANS ORIGINATED
1
$152,360
23
$192,683
28
$141,060
2
$72,485
0
$0
APPLICATIONS APPROVED, NOT ACCEPTED
0
$0
3
$217,613
4
$170,752
0
$0
1
$301,640
APPLICATIONS DENIED
0
$0
1
$200,690
10
$132,446
1
$67,100
0
$0
APPLICATIONS WITHDRAWN
0
$0
1
$166,520
12
$152,335
1
$60,020
0
$0
FILES CLOSED FOR INCOMPLETENESS
0
$0
1
$110,810
2
$190,530
0
$0
0
$0
Aggregated Statistics For Year 2000 (Based on 2 partial tracts)
A) FHA, FSA/RHS & VA Home Purchase Loans
B) Conventional Home Purchase Loans
C) Refinancings
D) Home Improvement Loans
F) Non-occupant Loans on < 5 Family Dwellings (A B C & D)
Number
Average Value
Number
Average Value
Number
Average Value
Number
Average Value
Number
Average Value
LOANS ORIGINATED
1
$108,650
16
$173,599
9
$93,606
5
$25,424
1
$107,110
APPLICATIONS APPROVED, NOT ACCEPTED
0
$0
2
$166,365
1
$158,210
0
$0
0
$0
APPLICATIONS DENIED
0
$0
3
$83,310
7
$122,064
1
$37,240
0
$0
APPLICATIONS WITHDRAWN
0
$0
1
$183,760
6
$51,967
1
$69,560
0
$0
FILES CLOSED FOR INCOMPLETENESS
0
$0
1
$78,800
3
$135,533
0
$0
0
$0
Aggregated Statistics For Year 1999 (Based on 1 partial tract)
A) FHA, FSA/RHS & VA Home Purchase Loans
B) Conventional Home Purchase Loans
C) Refinancings
D) Home Improvement Loans
F) Non-occupant Loans on < 5 Family Dwellings (A B C & D)


 Nearest zip codes: 12545, 12540, 12522, 12570, 12569, 12578.


