Estimated zip code population in 2022: 4,051 Zip code population in 2010: 4,275 Zip code population in 2000: 3,618
Houses and condos: 1,868 Renter-occupied apartments: 388
% of renters here:
23%
State:
46%
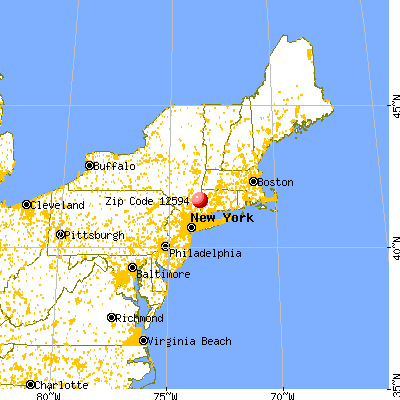
March 2022 cost of living index in zip code 12594: 115.0 (more than average, U.S. average is 100)
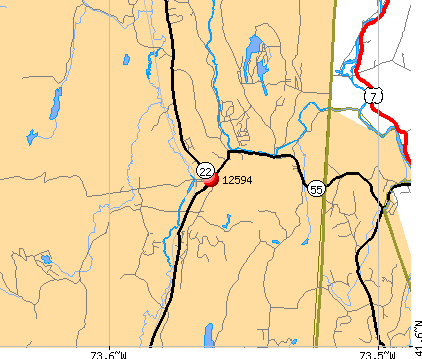
Land area: 24.1 sq. mi. Water area: 0.6 sq. mi.
Population density: 168 people per square mile
(very low).
OSM Map
General Map
Google Map
MSN Map
OSM Map
General Map
Google Map
MSN Map
OSM Map
General Map
Google Map
MSN Map
OSM Map
General Map
Google Map
MSN Map
Please wait while loading the map...
Real estate property taxes paid for housing units in 2022:
This zip code:
1.8% ($5,758)
New York:
1.5% ($6,180)
Median real estate property taxes paid for housing units with mortgages in 2022: $6,103 (1.7%) Median real estate property taxes paid for housing units with no mortgage in 2022: $4,493 (1.6%)
Estimated median house/condo value in 2022: $319,611
12594:
$319,611
New York:
$400,400
According to our research of New York and other state lists, there were 4 registered sex offenders living in 12594 zip code as of May 30, 2024. The ratio of all residents to sex offenders in zip code 12594 is 1,111 to 1. The ratio of registered sex offenders to all residents in this zip code is near the state average.
Median resident age:
This zip code:
49.1 years
New York median age:
40.0 years
Average household size:
This zip code:
2.3 people
New York:
2.5 people
Averages for the 2020 tax year for zip code 12594, filed in 2021:
Average Adjusted Gross Income (AGI) in 2020: $66,283 (Individual Income Tax Returns)
Here:
$66,283
State:
$90,930
Salary/wage: $60,707 (reported on 81.8% of returns)
Here:
$60,707
State:
$72,104
(% of AGI for various income ranges: 1131.2% for AGIs below $25k, 3351.0% for AGIs $25k-50k, 6121.4% for AGIs $50k-75k, 9606.9% for AGIs $75k-100k, 16524.6% for AGIs $100k-200k)
Taxable interest for individuals: $922 (reported on 34.4% of returns)
This zip code:
$922
New York:
$3,075
(% of AGI for various income ranges: 8.8% for AGIs below $25k, 23.2% for AGIs $25k-50k, 35.0% for AGIs $50k-75k, 37.5% for AGIs $75k-100k, 46.7% for AGIs $100k-200k)
Ordinary dividends: $2,825 (reported on 17.2% of returns)
Here:
$2,825
State:
$11,095
(% of AGI for various income ranges: 12.7% for AGIs below $25k, 41.5% for AGIs $25k-50k, 34.1% for AGIs $50k-75k, 111.9% for AGIs $75k-100k, 128.3% for AGIs $100k-200k)
Net capital gain/loss in AGI: +$5,310 (reported on 13.9% of returns)
Here:
+$5,310
State:
+$44,925
(% of AGI for various income ranges: 7.8% for AGIs below $25k, 7.0% for AGIs $25k-50k, 115.9% for AGIs $50k-75k, 48.1% for AGIs $75k-100k, 131.2% for AGIs $100k-200k)
Profit/loss from business: +$12,526 (reported on 12.9% of returns)
Here:
+$12,526
State:
+$14,940
(% of AGI for various income ranges: 139.3% for AGIs below $25k, 220.2% for AGIs $25k-50k, 233.6% for AGIs $50k-75k, 258.1% for AGIs $75k-100k, 172.5% for AGIs $100k-200k)
Taxable individual retirement arrangement distribution: $14,257 (reported on 6.7% of returns)
12594:
$14,257
New York:
$19,609
(% of AGI for various income ranges: 106.2% for AGIs $25k-50k, 271.8% for AGIs $50k-75k, 405.4% for AGIs $100k-200k)
Total itemized deductions: $26,452 (reported on 10.0% of returns)
Here:
$26,452
State:
$39,326
(% of AGI for various income ranges: 204.8% for AGIs $25k-50k, 314.5% for AGIs $50k-75k, 606.9% for AGIs $75k-100k, 765.4% for AGIs $100k-200k)
Charity contributions: $6,575 (reported on 7.7% of returns)
Here:
$6,575
State:
$15,420
(% of AGI for various income ranges: 17.1% for AGIs below $25k, 62.7% for AGIs $50k-75k, 80.0% for AGIs $75k-100k, 161.2% for AGIs $100k-200k)
Taxes paid: $8,357 (reported on 10.0% of returns)
12594:
$8,357
State:
$9,183
(% of AGI for various income ranges: 58.8% for AGIs $25k-50k, 113.6% for AGIs $50k-75k, 215.6% for AGIs $75k-100k, 277.1% for AGIs $100k-200k)
Earned income credit: $1,859 (reported on 12.9% of returns)
Here:
$1,859
State:
$2,138
(% of AGI for various income ranges: 65.6% for AGIs below $25k, 58.2% for AGIs $25k-50k)
Percentage of individuals using paid preparers for their 2020 taxes: 94.3%
Here:
94%
State:
95%
(% for various income ranges: 93.2% for AGIs below $25k, 94.1% for AGIs $25k-50k, 93.5% for AGIs $50k-75k, 95.8% for AGIs $75k-100k, 94.6% for AGIs $100k-200k, 100.0% for AGIs over 200k)
Averages for the 2012 tax year for zip code 12594, filed in 2013:
Average Adjusted Gross Income (AGI) in 2012: $55,125 (Individual Income Tax Returns)
Here:
$55,125
State:
$77,088
Salary/wage: $51,522 (reported on 84.8% of returns)
Here:
$51,522
State:
$60,593
(% of AGI for various income ranges: 72.6% for AGIs below $25k, 73.8% for AGIs $25k-50k, 80.5% for AGIs $50k-75k, 79.2% for AGIs $75k-100k, 82.9% for AGIs $100k-200k, 79.2% for AGIs over 200k)
Taxable interest for individuals: $540 (reported on 39.3% of returns)
This zip code:
$540
New York:
$3,125
(% of AGI for various income ranges: 0.8% for AGIs below $25k, 0.5% for AGIs $25k-50k, 0.3% for AGIs $50k-75k, 0.3% for AGIs $75k-100k, 0.2% for AGIs $100k-200k, 0.6% for AGIs over 200k)
Ordinary dividends: $1,639 (reported on 16.2% of returns)
Here:
$1,639
State:
$10,299
(% of AGI for various income ranges: 1.0% for AGIs below $25k, 0.4% for AGIs $25k-50k, 0.3% for AGIs $50k-75k, 0.5% for AGIs $75k-100k, 0.6% for AGIs $100k-200k)
Net capital gain/loss in AGI: +$1,616 (reported on 9.9% of returns)
Here:
+$1,616
State:
+$42,474
(% of AGI for various income ranges: 0.4% for AGIs $50k-75k, 1.0% for AGIs $100k-200k)
Profit/loss from business: +$8,916 (reported on 13.1% of returns)
Here:
+$8,916
State:
+$16,168
(% of AGI for various income ranges: 8.0% for AGIs below $25k, 3.6% for AGIs $25k-50k, 0.9% for AGIs $50k-75k, 2.1% for AGIs $75k-100k, 1.3% for AGIs $100k-200k)
Taxable individual retirement arrangement distribution: $10,577 (reported on 6.8% of returns)
12594:
$10,577
New York:
$17,621
(% of AGI for various income ranges: 1.9% for AGIs below $25k, 1.0% for AGIs $25k-50k, 1.7% for AGIs $50k-75k, 1.4% for AGIs $75k-100k, 1.5% for AGIs $100k-200k)
Total itemized deductions: $24,087 (25% of AGI, reported on 39.3% of returns)
Here:
$24,087
State:
$34,985
Here:
25.3% of AGI
State:
21.3% of AGI
(% of AGI for various income ranges: 11.0% for AGIs below $25k, 12.4% for AGIs $25k-50k, 16.5% for AGIs $50k-75k, 20.0% for AGIs $75k-100k, 19.5% for AGIs $100k-200k, 16.9% for AGIs over 200k)
Charity contributions: $2,021 (reported on 33.0% of returns)
Here:
$2,021
State:
$5,572
(% of AGI for various income ranges: 0.5% for AGIs below $25k, 0.7% for AGIs $25k-50k, 1.0% for AGIs $50k-75k, 1.5% for AGIs $75k-100k, 1.7% for AGIs $100k-200k, 0.8% for AGIs over 200k)
Taxes paid: $10,916 (reported on 39.3% of returns)
12594:
$10,916
State:
$18,656
(% of AGI for various income ranges: 4.0% for AGIs below $25k, 4.4% for AGIs $25k-50k, 7.0% for AGIs $50k-75k, 8.8% for AGIs $75k-100k, 9.5% for AGIs $100k-200k, 9.6% for AGIs over 200k)
Earned income credit: $2,115 (reported on 13.6% of returns)
Here:
$2,115
State:
$2,230
(% of AGI for various income ranges: 4.8% for AGIs below $25k, 1.1% for AGIs $25k-50k)
Percentage of individuals using paid preparers for their 2012 taxes: 62.8%
Here:
63%
State:
66%
(% for various income ranges: 55.7% for AGIs below $25k, 63.4% for AGIs $25k-50k, 67.9% for AGIs $50k-75k, 70.8% for AGIs $75k-100k, 68.0% for AGIs $100k-200k, 66.7% for AGIs over 200k)
Averages for the 2004 tax year for zip code 12594, filed in 2005:
Average Adjusted Gross Income (AGI) in 2004: $47,318 (Individual Income Tax Returns)
Here:
$47,318
State:
$59,519
Salary/wage: $47,476 (reported on 84.9% of returns)
Here:
$47,476
State:
$50,673
(% of AGI for various income ranges: 106.4% for AGIs below $10k, 70.1% for AGIs $10k-25k, 82.1% for AGIs $25k-50k, 83.4% for AGIs $50k-75k, 92.2% for AGIs $75k-100k, 85.6% for AGIs over 100k)
Taxable interest for individuals: $636 (reported on 51.0% of returns)
This zip code:
$636
New York:
$2,377
(% of AGI for various income ranges: 2.8% for AGIs below $10k, 2.3% for AGIs $10k-25k, 0.6% for AGIs $25k-50k, 1.0% for AGIs $50k-75k, 0.2% for AGIs $75k-100k, 0.3% for AGIs over 100k)
Taxable dividends: $791 (reported on 19.1% of returns)
Here:
$791
State:
$5,394
(% of AGI for various income ranges: 1.4% for AGIs below $10k, 1.1% for AGIs $10k-25k, 0.4% for AGIs $25k-50k, 0.3% for AGIs $50k-75k, 0.1% for AGIs $75k-100k, 0.2% for AGIs over 100k)
Net capital gain/loss: +$3,871 (reported on 11.5% of returns)
Here:
+$3,871
State:
+$23,581
(% of AGI for various income ranges: -2.0% for AGIs below $10k, -0.5% for AGIs $10k-25k, 0.2% for AGIs $25k-50k, 0.3% for AGIs $50k-75k, -0.1% for AGIs $75k-100k, 3.4% for AGIs over 100k)
Profit/loss from business: +$7,536 (reported on 14.4% of returns)
Here:
+$7,536
State:
+$13,809
(% of AGI for various income ranges: 13.4% for AGIs below $10k, 6.8% for AGIs $10k-25k, 2.8% for AGIs $25k-50k, 2.5% for AGIs $50k-75k, 1.7% for AGIs $75k-100k, 0.6% for AGIs over 100k)
IRA payment deduction: $2,862 (reported on 1.6% of returns)
12594:
$2,862
New York:
$3,115
Total itemized deductions: $20,669 (27% of AGI, reported on 43.0% of returns)
Here:
$20,669
State:
$25,864
Here:
27.3% of AGI
State:
21.9% of AGI
(% of AGI for various income ranges: 14.8% for AGIs below $10k, 10.8% for AGIs $10k-25k, 14.6% for AGIs $25k-50k, 19.9% for AGIs $50k-75k, 21.8% for AGIs $75k-100k, 20.7% for AGIs over 100k)
Charity contributions deductions: $2,286 (3% of AGI, reported on 39.0% of returns)
Here:
$2,286
State:
$4,439
Here:
2.9% of AGI
State:
3.6% of AGI
(% of AGI for various income ranges: 0.9% for AGIs $10k-25k, 1.4% for AGIs $25k-50k, 2.2% for AGIs $50k-75k, 1.9% for AGIs $75k-100k, 2.4% for AGIs over 100k)
Total tax: $5,487 (reported on 79.7% of returns)
12594:
$5,487
State:
$11,730
(% of AGI for various income ranges: 4.0% for AGIs below $10k, 4.5% for AGIs $10k-25k, 7.1% for AGIs $25k-50k, 8.1% for AGIs $50k-75k, 8.3% for AGIs $75k-100k, 13.9% for AGIs over 100k)
Earned income credit: $1,595 (reported on 10.4% of returns)
Here:
$1,595
State:
$1,757
Percentage of individuals using paid preparers for their 2004 taxes: 62.2%
Here:
62%
State:
67%
(% for various income ranges: 46.4% for AGIs below $10k, 59.1% for AGIs $10k-25k, 65.5% for AGIs $25k-50k, 68.3% for AGIs $50k-75k, 71.2% for AGIs $75k-100k, 64.7% for AGIs over 100k)
Household received Food Stamps/SNAP in the past 12 months: 95 Household did not receive Food Stamps/SNAP in the past 12 months: 1,604
Women who had a birth in the past 12 months: 36 (36 now married, 0 unmarried) Women who did not have a birth in the past 12 months: 955 (309 now married, 647 unmarried)
Housing units in zip code 12594 with a mortgage: 752 (71 second mortgage, 59 both second mortgage and home equity loan) Houses without a mortgage: 12
Median monthly owner costs for units with a mortgage: $2,310 Median monthly owner costs for units without a mortgage: $793
Residents with income below the poverty level in 2022:
This zip code:
16.3%
Whole state:
14.3%
Residents with income below 50% of the poverty level in 2022:
This zip code:
7.1%
Whole state:
6.8%
Median number of rooms in houses and condos:
Here:
6.5
State:
6.3
Median number of rooms in apartments:
Here:
3.3
State:
3.8
Notable locations in this zip code not listed on our city pages
Notable locations in zip code 12594: Harlem Valley-Wingdale Station (A), Camp Siwanoy (B), Dover Plains Library (C), J H Ketchum Hose Company Wingdale Station (D). Display/hide their locations on the map
In group quarters: 79 (-1 institutionalized population)
Size of family households: 478 2-persons, 502 3-persons, 155 4-persons, 48 5-persons, 36 6-persons
Size of nonfamily households: 332 1-person, 159 2-persons
277 married couples with children.
186 single-parent households (75 men, 111 women).
87.9% of residents of 12594 zip code speak English at home.
11.3% of residents speak Spanish at home (68% very well, 24% well, 8% not well).
0.3% of residents speak other Indo-European language at home (42% very well, 58% well).
Foreign born population: 330 (8.2%) (64.4% of them are naturalized citizens)
This zip code:
8.2%
Whole state:
22.7%
33%Dominica
13%Denmark
12%Honduras
8%Germany
7%El Salvador
6%Bulgaria
4%Guyana
21%Italian
15%American
9%Irish
6%German
3%Polish
1%Croatian
1%English
Year of entry for the foreign-born population
1232010 or later
312000 to 2009
981990 to 1999
130Before 1990
Facilities with environmental interests located in this zip code:
HILL TOP PARK (730 CEDAR LANE in WINGDALE, NY)
STATE MASTER (New York facility tracking) - National Pollutant Discharge Elimination System Permit (Integrated Compliance Information System) - ICIS-02-2000-8489, FORMAL ENFORCEMENT ACTION Business SIC classification: WATER SUPPLY; SERVICES Alternative names: HILLTOP MOBILE HOME PARK
HUNT COUNTRY FURNITURE (WEBATOK RD in WINGDALE, NY)
AIR SYNTHETIC MINOR (AIRS/AFS) STATE MASTER (New York facility tracking) - AIR PROGRAM, CRITERIA AND HAZARDOUS AIR POLLUTANT INVENTORY (Inventory of air pollution sources) Small Quantity Generators, between 100 kg and 1000 kg of hazardous waste/month (Resource Conservation and Recovery Act (tracking hazardous waste)) Business SIC classification: WOOD HOUSEHOLD FURNITURE, EXCEPT UPHOLSTERED; FURNITURE AND FIXTURES Organizations: HUNT COUNTRY FURNITURE INC (AIR PERMITTING FACILITY OWNER CONTACT)
Alternative names: HUNT FURNITURE CO
HARLEM VALLEY SECURE CTR ( in WINGDALE, NY)
(National Center for Education Statistics) - STATE ID-130502978570 Organizations: DOVER UFSD (SCHOOL DISTRICT)
HILLTOP MHP (RR#1, BOX 478E, E MAOUNTAIN RD in WINGDALE, NY)
(Integrated Compliance Information System) - ICIS-02-2000-8165, FORMAL ENFORCEMENT ACTION Business SIC classification: WATER SUPPLY
CRESTWOOD TRAILER PARK (RR #1, BOX 478E, E MOUNTAIN RD in WINGDALE, NY)
(Integrated Compliance Information System) - ICIS-02-2000-8168, FORMAL ENFORCEMENT ACTION Business SIC classification: WATER SUPPLY
HARLEM VALLEY SECURE CENTER (ROUTE 22 in WINGDALE, NY)
CRITERIA AND HAZARDOUS AIR POLLUTANT INVENTORY (Inventory of air pollution sources) National Pollutant Discharge Elimination System NON-MAJOR (Tracking pollutant discharge elimination systems) - permit Small Quantity Generators, between 100 kg and 1000 kg of hazardous waste/month (Resource Conservation and Recovery Act (tracking hazardous waste)) Business SIC classification: SERVICES Organizations: NYS OMH - HARLEM VALLEY (CONTACT/OWNER)
Alternative names: C T MALE, HARLEM VALLEY PSYCHIATRIC CENT
HUNT COUNTRY FURNITURE (19 DOG TAIL CORNERS RD in WINGDALE, NY)
Small Quantity Generators, between 100 kg and 1000 kg of hazardous waste/month (Resource Conservation and Recovery Act (tracking hazardous waste)) Organizations: JOSEPH GUAGENTI (CONTACT/OPERATOR)
, RANDOLPH WILLIAMS (CONTACT/OWNER)
Housing units lacking complete plumbing facilities: 1.2% Housing units lacking complete kitchen facilities: 2.3%
50.4%Fuel oil, kerosene, etc.
40.5%Electricity
5.3%Bottled, tank, or LP gas
3.3%Wood
0.7%Other fuel
Population in 1990: 3,716.
Place of birth for U.S.-born residents:
This state: 2,438
Northeast: 840
Midwest: 101
South: 249
West: 32
52% of the 12594 zip code residents lived in the same house 5 years ago. Out of people who lived in different houses, 44% lived in this county. Out of people who lived in different counties, 50% lived in New York.
90% of the 12594 zip code residents lived in the same house 1 year ago. Out of people who lived in different houses, 34% moved from this county. Out of people who lived in different houses, 40% moved from different county within same state. Out of people who lived in different houses, 29% moved from different state.
Private vs. public school enrollment:
Students in private schools in grades 1 to 8 (elementary and middle school): 10
Here:
6.1%
New York:
15.6%
Students in private schools in grades 9 to 12 (high school): 26
Here:
8.0%
New York:
15.0%
Students in private undergraduate colleges: 94
Here:
34.9%
New York:
39.2%
Occupation by median earnings in the past 12 months ($)
134,394Management occupations
134,126Business and financial operations occupations
128,575Health diagnosing and treating practitioners and other technical occupations
94,020Law enforcement workers including supervisors
92,556Education, training, and library occupations
84,067Transportation occupations
Companies with federal contracts located in this zip code:
HUNT COUNTRY FURNITURE INC (19 DOG TAIL CORNERS RD in WINGDALE, NY; small business)
$12,860 with Army for Office Furniture. Taking place in GA. Signed on 2004-09-30. Completion date: 2004-11-23.
Top industries in this zip code by the number of employees in 2005:
Mining: Other Crushed and Broken Stone Mining and Quarrying (50-99 employees: 1 establishment)
Construction: Plumbing, Heating, and Air-Conditioning Contractors (10-19: 2, 1-4: 3)
Accommodation and Food Services: Recreational and Vacation Camps (except Campgrounds) (20-49: 1)
Construction: New Single-Family Housing Construction (except Operative Builders) (10-19: 1, 1-4: 4)
Accommodation and Food Services: Limited-Service Restaurants (10-19: 1, 1-4: 2)
Accommodation and Food Services: Full-Service Restaurants (5-9: 2, 1-4: 1)
Wholesale Trade: Other Construction Material Merchant Wholesalers (10-19: 1)
People in group quarters in 2010:
19 people in group homes intended for adults
15 people in other noninstitutional facilities
3 people in residential treatment centers for adults
People in group quarters in 2000:
155 people in training schools for juvenile delinquents
17 people in mental (psychiatric) hospitals or wards
4 people in homes for the mentally retarded
4 people in other noninstitutional group quarters
Fatal accident statistics in 2014:
Fatal accident count: 2
Vehicles involved in fatal accidents: 4
Fatal accidents caused by drunken drivers: 0
Fatalities: 2
Persons involved in fatal accidents: 8
Pedestrians involved in fatal accidents: 0
Home Mortgage Disclosure Act Aggregated Statistics For Year 2009 (Based on 2 full and 2 partial tracts)
A) FHA, FSA/RHS & VA Home Purchase Loans
B) Conventional Home Purchase Loans
C) Refinancings
D) Home Improvement Loans
E) Loans on Dwellings For 5+ Families
F) Non-occupant Loans on < 5 Family Dwellings (A B C & D)
G) Loans On Manufactured Home Dwelling (A B C & D)
Number
Average Value
Number
Average Value
Number
Average Value
Number
Average Value
Number
Average Value
Number
Average Value
Number
Average Value
LOANS ORIGINATED
9
$211,384
11
$200,415
27
$229,005
4
$183,518
0
$0
2
$323,250
3
$71,033
APPLICATIONS APPROVED, NOT ACCEPTED
0
$0
1
$121,040
3
$234,960
0
$0
1
$110,360
1
$71,200
1
$121,040
APPLICATIONS DENIED
1
$296,900
1
$140,980
23
$249,706
3
$22,547
0
$0
3
$268,900
3
$59,570
APPLICATIONS WITHDRAWN
1
$72,620
3
$188,680
14
$215,787
1
$258,460
0
$0
1
$150,940
0
$0
FILES CLOSED FOR INCOMPLETENESS
0
$0
1
$145,960
1
$244,220
0
$0
0
$0
0
$0
0
$0
Aggregated Statistics For Year 2008 (Based on 2 full and 2 partial tracts)
A) FHA, FSA/RHS & VA Home Purchase Loans
B) Conventional Home Purchase Loans
C) Refinancings
D) Home Improvement Loans
E) Loans on Dwellings For 5+ Families
F) Non-occupant Loans on < 5 Family Dwellings (A B C & D)
G) Loans On Manufactured Home Dwelling (A B C & D)
Number
Average Value
Number
Average Value
Number
Average Value
Number
Average Value
Number
Average Value
Number
Average Value
Number
Average Value
LOANS ORIGINATED
1
$400,140
13
$221,664
15
$211,227
9
$61,073
1
$356,000
4
$124,422
3
$81,407
APPLICATIONS APPROVED, NOT ACCEPTED
0
$0
3
$162,337
6
$191,290
2
$132,790
0
$0
0
$0
1
$56,250
APPLICATIONS DENIED
1
$217,160
5
$187,826
39
$262,436
9
$122,543
0
$0
1
$75,470
1
$56,960
APPLICATIONS WITHDRAWN
1
$441,440
2
$167,675
12
$246,768
3
$196,037
0
$0
2
$137,415
1
$35,600
FILES CLOSED FOR INCOMPLETENESS
0
$0
0
$0
4
$280,350
0
$0
0
$0
0
$0
0
$0
Aggregated Statistics For Year 2007 (Based on 2 full and 2 partial tracts)
A) FHA, FSA/RHS & VA Home Purchase Loans
B) Conventional Home Purchase Loans
C) Refinancings
D) Home Improvement Loans
F) Non-occupant Loans on < 5 Family Dwellings (A B C & D)
G) Loans On Manufactured Home Dwelling (A B C & D)
Number
Average Value
Number
Average Value
Number
Average Value
Number
Average Value
Number
Average Value
Number
Average Value
LOANS ORIGINATED
4
$272,162
23
$238,277
63
$225,944
12
$137,416
5
$218,442
1
$74,050
APPLICATIONS APPROVED, NOT ACCEPTED
0
$0
9
$280,241
13
$209,766
4
$79,565
1
$213,600
1
$42,010
APPLICATIONS DENIED
0
$0
9
$256,637
57
$253,272
11
$126,154
8
$268,158
1
$71,200
APPLICATIONS WITHDRAWN
0
$0
3
$187,967
29
$237,875
4
$204,878
1
$418,660
1
$17,800
FILES CLOSED FOR INCOMPLETENESS
0
$0
2
$215,380
8
$229,798
1
$53,400
0
$0
0
$0
Aggregated Statistics For Year 2006 (Based on 2 full and 2 partial tracts)
A) FHA, FSA/RHS & VA Home Purchase Loans
B) Conventional Home Purchase Loans
C) Refinancings
D) Home Improvement Loans
F) Non-occupant Loans on < 5 Family Dwellings (A B C & D)
G) Loans On Manufactured Home Dwelling (A B C & D)
Number
Average Value
Number
Average Value
Number
Average Value
Number
Average Value
Number
Average Value
Number
Average Value
LOANS ORIGINATED
1
$214,310
52
$211,635
77
$215,875
13
$98,475
1
$267,000
4
$60,165
APPLICATIONS APPROVED, NOT ACCEPTED
0
$0
7
$206,174
19
$216,785
4
$48,415
1
$195,800
3
$70,487
APPLICATIONS DENIED
0
$0
11
$212,111
57
$229,876
15
$93,319
5
$179,566
2
$69,420
APPLICATIONS WITHDRAWN
0
$0
8
$155,839
40
$193,094
6
$153,317
1
$201,500
1
$84,020
FILES CLOSED FOR INCOMPLETENESS
0
$0
1
$44,860
9
$243,424
0
$0
0
$0
1
$44,860
Aggregated Statistics For Year 2005 (Based on 2 full and 2 partial tracts)
B) Conventional Home Purchase Loans
C) Refinancings
D) Home Improvement Loans
F) Non-occupant Loans on < 5 Family Dwellings (A B C & D)
G) Loans On Manufactured Home Dwelling (A B C & D)
Number
Average Value
Number
Average Value
Number
Average Value
Number
Average Value
Number
Average Value
LOANS ORIGINATED
46
$236,984
88
$208,017
16
$91,091
6
$178,237
1
$126,740
APPLICATIONS APPROVED, NOT ACCEPTED
10
$243,287
16
$186,144
1
$4,980
1
$178,000
2
$121,395
APPLICATIONS DENIED
10
$154,290
49
$182,693
20
$124,275
1
$198,650
4
$47,525
APPLICATIONS WITHDRAWN
13
$175,912
53
$207,845
10
$213,956
1
$226,420
1
$61,230
FILES CLOSED FOR INCOMPLETENESS
3
$116,530
28
$226,238
0
$0
0
$0
1
$10,680
Aggregated Statistics For Year 2004 (Based on 2 full and 2 partial tracts)
A) FHA, FSA/RHS & VA Home Purchase Loans
B) Conventional Home Purchase Loans
C) Refinancings
D) Home Improvement Loans
E) Loans on Dwellings For 5+ Families
F) Non-occupant Loans on < 5 Family Dwellings (A B C & D)
G) Loans On Manufactured Home Dwelling (A B C & D)
Number
Average Value
Number
Average Value
Number
Average Value
Number
Average Value
Number
Average Value
Number
Average Value
Number
Average Value
LOANS ORIGINATED
1
$182,980
55
$212,603
88
$189,412
13
$72,350
1
$160,200
8
$159,666
1
$165,900
APPLICATIONS APPROVED, NOT ACCEPTED
0
$0
8
$191,706
21
$178,188
6
$61,470
0
$0
1
$48,420
4
$49,662
APPLICATIONS DENIED
0
$0
16
$154,860
60
$166,416
14
$76,850
0
$0
3
$76,660
7
$61,231
APPLICATIONS WITHDRAWN
0
$0
10
$231,471
53
$195,088
9
$118,667
1
$149,520
1
$237,810
1
$67,640
FILES CLOSED FOR INCOMPLETENESS
0
$0
3
$217,160
28
$216,804
3
$74,760
0
$0
0
$0
0
$0
Aggregated Statistics For Year 2003 (Based on 2 full and 2 partial tracts)
A) FHA, FSA/RHS & VA Home Purchase Loans
B) Conventional Home Purchase Loans
C) Refinancings
D) Home Improvement Loans
F) Non-occupant Loans on < 5 Family Dwellings (A B C & D)
Number
Average Value
Number
Average Value
Number
Average Value
Number
Average Value
Number
Average Value
LOANS ORIGINATED
2
$228,910
41
$211,325
142
$173,214
10
$19,729
2
$196,155
APPLICATIONS APPROVED, NOT ACCEPTED
0
$0
9
$167,402
34
$148,651
3
$47,703
3
$177,643
APPLICATIONS DENIED
0
$0
16
$52,821
71
$165,695
12
$58,740
1
$8,540
APPLICATIONS WITHDRAWN
0
$0
8
$159,706
61
$164,740
7
$56,757
0
$0
FILES CLOSED FOR INCOMPLETENESS
0
$0
2
$278,390
9
$136,704
0
$0
0
$0
Aggregated Statistics For Year 2002 (Based on 2 full and 2 partial tracts)
A) FHA, FSA/RHS & VA Home Purchase Loans
B) Conventional Home Purchase Loans
C) Refinancings
D) Home Improvement Loans
F) Non-occupant Loans on < 5 Family Dwellings (A B C & D)
Number
Average Value
Number
Average Value
Number
Average Value
Number
Average Value
Number
Average Value
LOANS ORIGINATED
2
$237,095
50
$170,111
77
$143,758
11
$23,536
4
$134,035
APPLICATIONS APPROVED, NOT ACCEPTED
1
$280,530
6
$172,092
18
$112,269
5
$36,454
0
$0
APPLICATIONS DENIED
1
$153,080
11
$83,693
44
$138,306
9
$30,537
0
$0
APPLICATIONS WITHDRAWN
0
$0
6
$127,803
36
$137,028
6
$47,942
1
$64,080
FILES CLOSED FOR INCOMPLETENESS
0
$0
1
$124,600
22
$127,415
0
$0
1
$137,420
Aggregated Statistics For Year 2001 (Based on 2 full and 2 partial tracts)
A) FHA, FSA/RHS & VA Home Purchase Loans
B) Conventional Home Purchase Loans
C) Refinancings
D) Home Improvement Loans
E) Loans on Dwellings For 5+ Families
F) Non-occupant Loans on < 5 Family Dwellings (A B C & D)
Number
Average Value
Number
Average Value
Number
Average Value
Number
Average Value
Number
Average Value
Number
Average Value
LOANS ORIGINATED
4
$145,425
50
$161,460
64
$120,992
11
$22,693
1
$290,500
2
$160,555
APPLICATIONS APPROVED, NOT ACCEPTED
2
$136,705
6
$93,043
13
$89,011
3
$18,750
0
$0
0
$0
APPLICATIONS DENIED
1
$123,890
6
$135,873
49
$103,802
9
$16,060
0
$0
2
$101,815
APPLICATIONS WITHDRAWN
0
$0
6
$177,288
32
$128,783
4
$20,292
0
$0
1
$103,240
FILES CLOSED FOR INCOMPLETENESS
0
$0
2
$174,795
9
$119,379
1
$10,680
0
$0
1
$101,100
Aggregated Statistics For Year 2000 (Based on 2 full and 2 partial tracts)
A) FHA, FSA/RHS & VA Home Purchase Loans
B) Conventional Home Purchase Loans
C) Refinancings
D) Home Improvement Loans
E) Loans on Dwellings For 5+ Families
F) Non-occupant Loans on < 5 Family Dwellings (A B C & D)
Number
Average Value
Number
Average Value
Number
Average Value
Number
Average Value
Number
Average Value
Number
Average Value
LOANS ORIGINATED
6
$162,692
29
$136,736
9
$172,067
10
$21,620
1
$24,210
2
$373,090
APPLICATIONS APPROVED, NOT ACCEPTED
0
$0
2
$84,015
6
$144,298
1
$12,100
0
$0
1
$284,800
APPLICATIONS DENIED
1
$229,980
10
$74,630
14
$93,526
6
$18,037
1
$131,010
3
$78,320
APPLICATIONS WITHDRAWN
1
$99,680
3
$133,620
12
$102,301
0
$0
0
$0
0
$0
FILES CLOSED FOR INCOMPLETENESS
0
$0
0
$0
4
$132,965
0
$0
0
$0
0
$0
Aggregated Statistics For Year 1999 (Based on 1 full and 1 partial tracts)
A) FHA, FSA/RHS & VA Home Purchase Loans
B) Conventional Home Purchase Loans
C) Refinancings
D) Home Improvement Loans
F) Non-occupant Loans on < 5 Family Dwellings (A B C & D)
Detailed PMIC statistics for the following Tracts:0400.02
, 6200.00
2002 - 2018 National Fire Incident Reporting System (NFIRS) incidents
According to the data from the years 2002 - 2018 the average number of fires per year is 13. The highest number of fire incidents - 24 took place in 2005, and the least - 6 in 2003. The data has a declining trend.
When looking into fire subcategories, the most incidents belonged to: Structure Fires (52.8%), and Outside Fires (21.5%).
Fire incident types reported to NFIRS in Zip Code 12594


 Nearest zip codes: 12522, 06755, 06785, 12564, 06757, 12592.


 According to the data from the years 2002 - 2018 the average number of fires per year is 13. The highest number of fire incidents - 24 took place in 2005, and the least - 6 in 2003. The data has a declining trend.
 When looking into fire subcategories, the most incidents belonged to: Structure Fires (52.8%), and Outside Fires (21.5%).