Estimated zip code population in 2022: 4,699 Zip code population in 2010: 5,172 Zip code population in 2000: 5,691
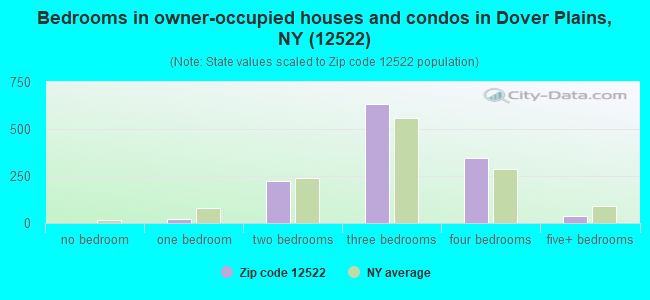
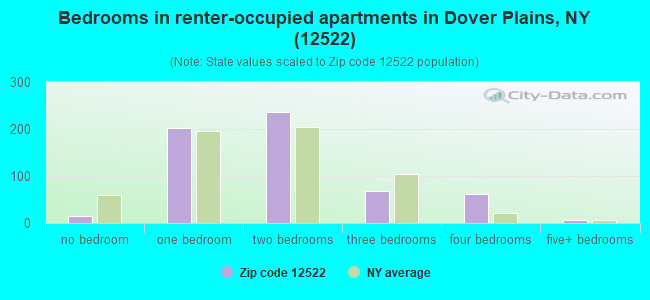
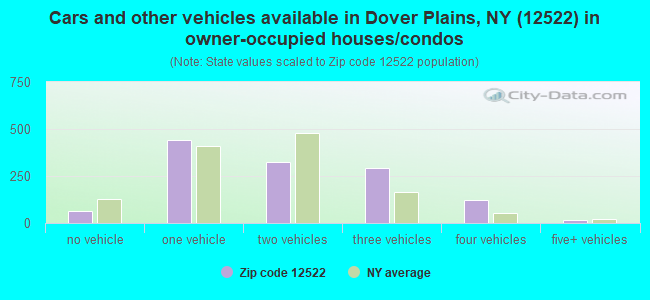
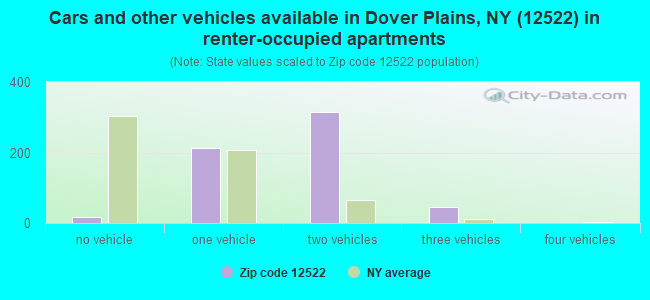
Houses and condos: 2,105 Renter-occupied apartments: 598
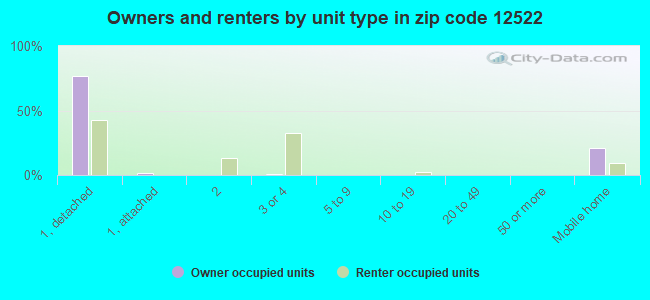
% of renters here:
32%
State:
46%
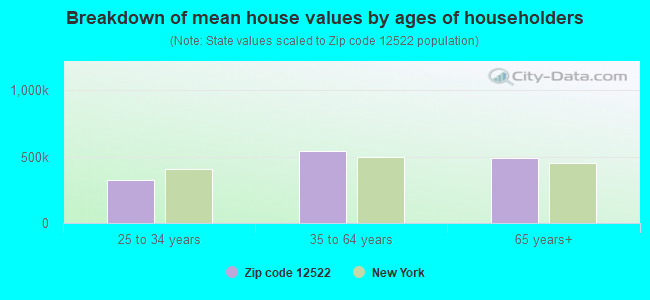
March 2022 cost of living index in zip code 12522: 116.0 (more than average, U.S. average is 100)
Land area: 37.3 sq. mi. Water area: 0.4 sq. mi.
Population density: 126 people per square mile
(very low).
OSM Map
General Map
Google Map
MSN Map
OSM Map
General Map
Google Map
MSN Map
OSM Map
General Map
Google Map
MSN Map
OSM Map
General Map
Google Map
MSN Map
Please wait while loading the map...
Real estate property taxes paid for housing units in 2022:
This zip code:
2.0% ($5,830)
New York:
1.5% ($6,180)
Median real estate property taxes paid for housing units with mortgages in 2022: $5,983 (2.0%) Median real estate property taxes paid for housing units with no mortgage in 2022: $5,752 (2.0%)
Business Search- 14 Million verified businesses
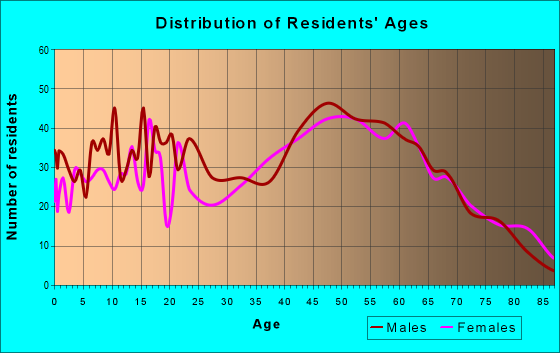
Males: 2,136
(45.5%)
Females: 2,562
(54.5%)
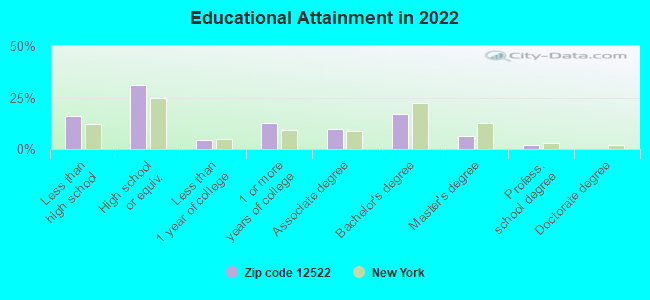
For population 25 years and over in 12522:
High school or higher: 83.3%
Bachelor's degree or higher: 25.6%
Graduate or professional degree: 8.6%
Unemployed: 7.7%
Mean travel time to work (commute): 36.6 minutes
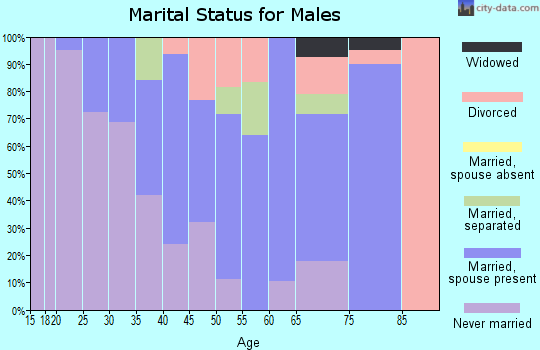
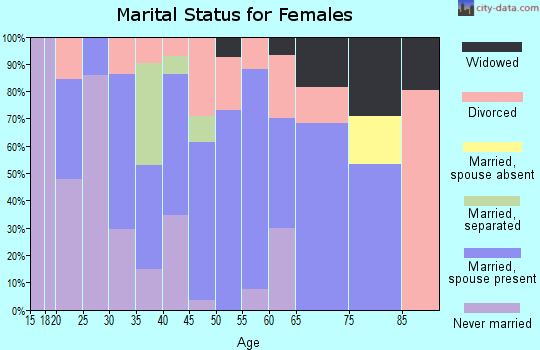
For population 15 years and over in 12522:
Never married: 37.7%
Now married: 43.3%
Separated: 1.0%
Widowed: 8.5%
Divorced: 9.4%
Zip code 12522 compared to state average:
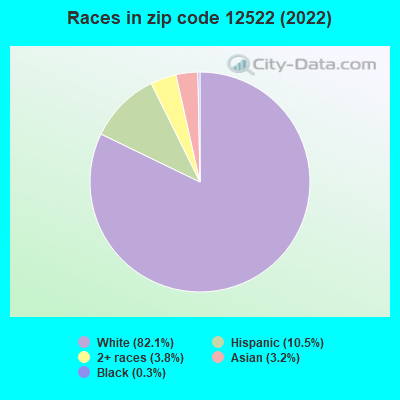
Black race population percentage significantly below state average.
Hispanic race population percentage below state average.
Foreign-born population percentage below state average.
Length of stay since moving in significantly above state average.
Averages for the 2020 tax year for zip code 12522, filed in 2021:
Average Adjusted Gross Income (AGI) in 2020: $69,678 (Individual Income Tax Returns)
Here:
$69,678
State:
$90,930
Salary/wage: $57,662 (reported on 74.7% of returns)
Here:
$57,662
State:
$72,104
(% of AGI for various income ranges: 1105.8% for AGIs below $25k, 3431.7% for AGIs $25k-50k, 5721.0% for AGIs $50k-75k, 8652.9% for AGIs $75k-100k, 16051.9% for AGIs $100k-200k)
Taxable interest for individuals: $1,401 (reported on 34.0% of returns)
This zip code:
$1,401
New York:
$3,075
(% of AGI for various income ranges: 18.0% for AGIs below $25k, 19.0% for AGIs $25k-50k, 23.3% for AGIs $50k-75k, 61.8% for AGIs $75k-100k, 78.1% for AGIs $100k-200k)
Ordinary dividends: $8,290 (reported on 16.6% of returns)
Here:
$8,290
State:
$11,095
(% of AGI for various income ranges: 26.4% for AGIs below $25k, 33.8% for AGIs $25k-50k, 58.0% for AGIs $50k-75k, 142.9% for AGIs $75k-100k, 140.0% for AGIs $100k-200k)
Net capital gain/loss in AGI: +$20,353 (reported on 12.4% of returns)
Here:
+$20,353
State:
+$44,925
(% of AGI for various income ranges: 9.6% for AGIs below $25k, 29.6% for AGIs $25k-50k, 81.0% for AGIs $50k-75k, 138.2% for AGIs $75k-100k, 234.3% for AGIs $100k-200k)
Profit/loss from business: +$12,161 (reported on 12.9% of returns)
Here:
+$12,161
State:
+$14,940
(% of AGI for various income ranges: 172.4% for AGIs below $25k, 165.8% for AGIs $25k-50k, 168.0% for AGIs $50k-75k, 93.5% for AGIs $75k-100k, 731.0% for AGIs $100k-200k)
Taxable individual retirement arrangement distribution: $13,575 (reported on 8.3% of returns)
12522:
$13,575
New York:
$19,609
(% of AGI for various income ranges: 37.1% for AGIs below $25k, 105.0% for AGIs $25k-50k, 197.3% for AGIs $50k-75k, 224.1% for AGIs $75k-100k, 510.0% for AGIs $100k-200k)
Total itemized deductions: $26,153 (reported on 7.9% of returns)
Here:
$26,153
State:
$39,326
(% of AGI for various income ranges: 151.7% for AGIs $25k-50k, 247.3% for AGIs $50k-75k, 461.2% for AGIs $75k-100k, 793.8% for AGIs $100k-200k)
Charity contributions: $5,836 (reported on 5.8% of returns)
Here:
$5,836
State:
$15,420
(% of AGI for various income ranges: 60.0% for AGIs $50k-75k, 82.9% for AGIs $75k-100k, 122.4% for AGIs $100k-200k)
Taxes paid: $8,142 (reported on 7.9% of returns)
12522:
$8,142
State:
$9,183
(% of AGI for various income ranges: 34.4% for AGIs $25k-50k, 67.7% for AGIs $50k-75k, 181.8% for AGIs $75k-100k, 300.0% for AGIs $100k-200k)
Earned income credit: $2,162 (reported on 12.0% of returns)
Here:
$2,162
State:
$2,138
(% of AGI for various income ranges: 82.7% for AGIs below $25k, 53.1% for AGIs $25k-50k)
Percentage of individuals using paid preparers for their 2020 taxes: 94.2%
Here:
94%
State:
95%
(% for various income ranges: 91.2% for AGIs below $25k, 93.8% for AGIs $25k-50k, 97.6% for AGIs $50k-75k, 96.0% for AGIs $75k-100k, 94.3% for AGIs $100k-200k, 100.0% for AGIs over 200k)
Averages for the 2012 tax year for zip code 12522, filed in 2013:
Average Adjusted Gross Income (AGI) in 2012: $51,781 (Individual Income Tax Returns)
Here:
$51,781
State:
$77,088
Salary/wage: $46,083 (reported on 78.1% of returns)
Here:
$46,083
State:
$60,593
(% of AGI for various income ranges: 61.7% for AGIs below $25k, 70.5% for AGIs $25k-50k, 71.7% for AGIs $50k-75k, 68.1% for AGIs $75k-100k, 77.7% for AGIs $100k-200k, 49.5% for AGIs over 200k)
Taxable interest for individuals: $760 (reported on 39.7% of returns)
This zip code:
$760
New York:
$3,125
(% of AGI for various income ranges: 1.2% for AGIs below $25k, 0.6% for AGIs $25k-50k, 0.5% for AGIs $50k-75k, 0.7% for AGIs $75k-100k, 0.5% for AGIs $100k-200k, 0.4% for AGIs over 200k)
Ordinary dividends: $3,138 (reported on 17.9% of returns)
Here:
$3,138
State:
$10,299
(% of AGI for various income ranges: 0.8% for AGIs below $25k, 0.9% for AGIs $25k-50k, 0.8% for AGIs $50k-75k, 0.6% for AGIs $75k-100k, 1.0% for AGIs $100k-200k, 3.0% for AGIs over 200k)
Net capital gain/loss in AGI: +$2,609 (reported on 10.3% of returns)
Here:
+$2,609
State:
+$42,474
(% of AGI for various income ranges: 0.3% for AGIs $75k-100k, 1.8% for AGIs $100k-200k)
Profit/loss from business: +$11,650 (reported on 12.5% of returns)
Here:
+$11,650
State:
+$16,168
(% of AGI for various income ranges: 6.9% for AGIs below $25k, 2.0% for AGIs $25k-50k, 2.8% for AGIs $50k-75k, 2.9% for AGIs $75k-100k, 3.0% for AGIs $100k-200k)
Taxable individual retirement arrangement distribution: $11,261 (reported on 10.3% of returns)
12522:
$11,261
New York:
$17,621
(% of AGI for various income ranges: 2.5% for AGIs below $25k, 2.6% for AGIs $25k-50k, 2.6% for AGIs $50k-75k, 2.3% for AGIs $75k-100k, 2.4% for AGIs $100k-200k)
Total itemized deductions: $23,235 (25% of AGI, reported on 32.1% of returns)
Here:
$23,235
State:
$34,985
Here:
25.3% of AGI
State:
21.3% of AGI
(% of AGI for various income ranges: 11.9% for AGIs below $25k, 10.5% for AGIs $25k-50k, 13.6% for AGIs $50k-75k, 14.7% for AGIs $75k-100k, 18.3% for AGIs $100k-200k, 13.7% for AGIs over 200k)
Charity contributions: $2,089 (reported on 25.4% of returns)
Here:
$2,089
State:
$5,572
(% of AGI for various income ranges: 0.3% for AGIs below $25k, 0.7% for AGIs $25k-50k, 1.0% for AGIs $50k-75k, 1.0% for AGIs $75k-100k, 1.4% for AGIs $100k-200k, 1.2% for AGIs over 200k)
Taxes paid: $10,423 (reported on 31.7% of returns)
12522:
$10,423
State:
$18,656
(% of AGI for various income ranges: 3.4% for AGIs below $25k, 3.6% for AGIs $25k-50k, 5.2% for AGIs $50k-75k, 6.5% for AGIs $75k-100k, 9.0% for AGIs $100k-200k, 8.4% for AGIs over 200k)
Earned income credit: $1,967 (reported on 13.4% of returns)
Here:
$1,967
State:
$2,230
(% of AGI for various income ranges: 4.3% for AGIs below $25k, 0.7% for AGIs $25k-50k)
Percentage of individuals using paid preparers for their 2012 taxes: 62.1%
Here:
62%
State:
66%
(% for various income ranges: 52.4% for AGIs below $25k, 61.4% for AGIs $25k-50k, 68.6% for AGIs $50k-75k, 66.7% for AGIs $75k-100k, 76.9% for AGIs $100k-200k, 100.0% for AGIs over 200k)
Averages for the 2004 tax year for zip code 12522, filed in 2005:
Average Adjusted Gross Income (AGI) in 2004: $45,695 (Individual Income Tax Returns)
Here:
$45,695
State:
$59,519
Salary/wage: $41,751 (reported on 81.0% of returns)
Here:
$41,751
State:
$50,673
(% of AGI for various income ranges: 100.1% for AGIs below $10k, 63.4% for AGIs $10k-25k, 79.3% for AGIs $25k-50k, 80.1% for AGIs $50k-75k, 85.0% for AGIs $75k-100k, 62.0% for AGIs over 100k)
Taxable interest for individuals: $1,036 (reported on 51.1% of returns)
This zip code:
$1,036
New York:
$2,377
(% of AGI for various income ranges: 6.8% for AGIs below $10k, 2.9% for AGIs $10k-25k, 1.0% for AGIs $25k-50k, 1.1% for AGIs $50k-75k, 0.7% for AGIs $75k-100k, 0.9% for AGIs over 100k)
Taxable dividends: $2,876 (reported on 21.0% of returns)
Here:
$2,876
State:
$5,394
(% of AGI for various income ranges: 4.0% for AGIs below $10k, 1.4% for AGIs $10k-25k, 0.9% for AGIs $25k-50k, 0.4% for AGIs $50k-75k, 0.4% for AGIs $75k-100k, 2.6% for AGIs over 100k)
Net capital gain/loss: +$7,830 (reported on 13.7% of returns)
Here:
+$7,830
State:
+$23,581
(% of AGI for various income ranges: -3.0% for AGIs below $10k, -0.1% for AGIs $10k-25k, -0.1% for AGIs $25k-50k, 0.7% for AGIs $50k-75k, -0.0% for AGIs $75k-100k, 7.5% for AGIs over 100k)
Profit/loss from business: +$11,862 (reported on 12.0% of returns)
Here:
+$11,862
State:
+$13,809
(% of AGI for various income ranges: 13.8% for AGIs below $10k, 6.0% for AGIs $10k-25k, 3.3% for AGIs $25k-50k, 3.3% for AGIs $50k-75k, 1.1% for AGIs $75k-100k, 2.7% for AGIs over 100k)
IRA payment deduction: $2,674 (reported on 1.9% of returns)
12522:
$2,674
New York:
$3,115
Total itemized deductions: $18,914 (23% of AGI, reported on 34.9% of returns)
Here:
$18,914
State:
$25,864
Here:
23.0% of AGI
State:
21.9% of AGI
(% of AGI for various income ranges: 20.5% for AGIs below $10k, 9.6% for AGIs $10k-25k, 11.1% for AGIs $25k-50k, 15.2% for AGIs $50k-75k, 17.5% for AGIs $75k-100k, 15.7% for AGIs over 100k)
Charity contributions deductions: $1,944 (2% of AGI, reported on 31.2% of returns)
Here:
$1,944
State:
$4,439
Here:
2.4% of AGI
State:
3.6% of AGI
(% of AGI for various income ranges: 0.8% for AGIs below $10k, 0.7% for AGIs $10k-25k, 0.9% for AGIs $25k-50k, 1.4% for AGIs $50k-75k, 1.9% for AGIs $75k-100k, 1.5% for AGIs over 100k)
Total tax: $6,095 (reported on 78.4% of returns)
12522:
$6,095
State:
$11,730
(% of AGI for various income ranges: 3.6% for AGIs below $10k, 4.1% for AGIs $10k-25k, 7.1% for AGIs $25k-50k, 8.8% for AGIs $50k-75k, 10.5% for AGIs $75k-100k, 15.9% for AGIs over 100k)
Earned income credit: $1,662 (reported on 11.7% of returns)
Here:
$1,662
State:
$1,757
Percentage of individuals using paid preparers for their 2004 taxes: 66.7%
Here:
67%
State:
67%
(% for various income ranges: 58.1% for AGIs below $10k, 63.2% for AGIs $10k-25k, 67.1% for AGIs $25k-50k, 69.9% for AGIs $50k-75k, 73.4% for AGIs $75k-100k, 79.6% for AGIs over 100k)
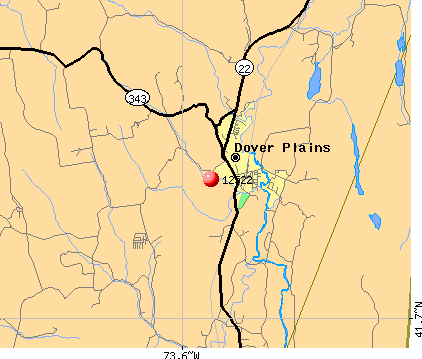
Notable locations in zip code 12522: Dover Plains Station (A), Tenmile River Station (B), Metropolitan Camps (C), East Mountain Farm And Stables (D), Dover Town Hall (E), Crystal House Manor Assisted Living Facility (F), Dover Fire Department - J H Ketcham Hose Company (G). Display/hide their locations on the map
Churches in zip code 12522 include: Dover Plains United Methodist Church (A), Saint James Episcopal Church (B), Saint Charles Church (C), Dover Plains Second Baptist Church (D). Display/hide their locations on the map
In group quarters: 82 (-1 institutionalized population)
Size of family households: 547 2-persons, 260 3-persons, 267 4-persons, 93 5-persons, 20 6-persons, 47 7-or-more-persons
Size of nonfamily households: 552 1-person, 77 2-persons
374 married couples with children.
169 single-parent households (13 men, 156 women).
83.0% of residents of 12522 zip code speak English at home.
5.3% of residents speak Spanish at home (35% very well, 46% well, 12% not well, 7% not at all).
8.4% of residents speak other Indo-European language at home (97% very well, 3% not well).
2.5% of residents speak Asian or Pacific Island language at home (24% very well, 52% well, 23% not well).
0.5% of residents speak other language at home (100% very well).
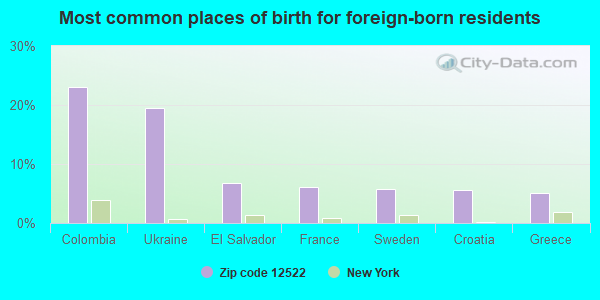
Foreign born population: 640 (13.6%) (68.3% of them are naturalized citizens)
This zip code:
13.6%
Whole state:
22.7%
23%Colombia
19%Ukraine
7%El Salvador
6%France
6%Sweden
6%Croatia
5%Greece
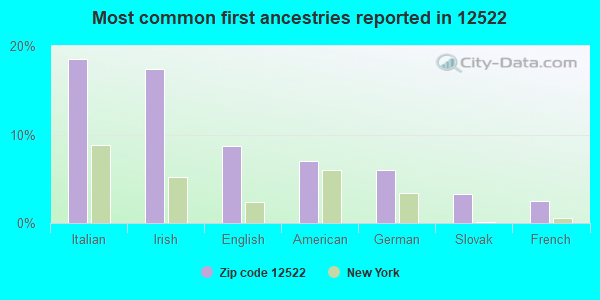
19%Italian
17%Irish
9%English
7%American
6%German
3%Slovak
2%French
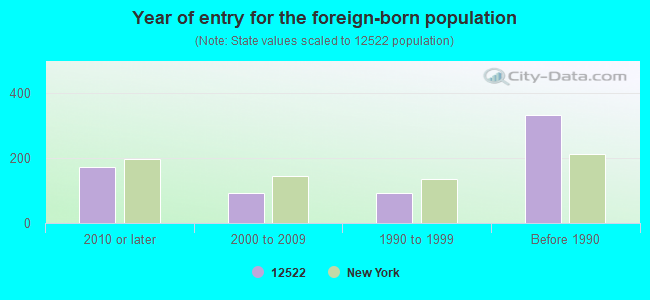
Year of entry for the foreign-born population
1742010 or later
932000 to 2009
911990 to 1999
333Before 1990
Facilities with environmental interests located in this zip code:
HOLSAPPLE RD ( in DOVER PLAINS, NY)
National Pollutant Discharge Elimination System NON-MAJOR (Tracking pollutant discharge elimination systems) - permit Organizations: HIGH MEADOWS COOPERATIVE CORP (CONTACT/OWNER)
Alternative names: HIGH MEADOWS MOBILE HOME PARK
IROQUOIS GAS TRANMISSION SYSTEM (186 DOVER FURNACE RD in DOVER PLAINS, NY)
Conditionally Exempt Small Quantity Generators, less than 100 kg/month of hazardous waste (Resource Conservation and Recovery Act (tracking hazardous waste)) Organizations: IROQUOIS PIPELINE OPERATING CO (CONTACT/OPERATOR)
, IROQUOIS GAS TRANSMISSION SYSTEM (CONTACT/OWNER)
A T & T - DOVER PLAINS NY4550 (E MOUNTAIN RD AT AIRMONT in DOVER PLAINS, NY)
Conditionally Exempt Small Quantity Generators, less than 100 kg/month of hazardous waste (Resource Conservation and Recovery Act (tracking hazardous waste)) - notification Organizations: A T & T COMMUNICATIONS (CONTACT/OWNER)
Housing units lacking complete plumbing facilities: 2.8% Housing units lacking complete kitchen facilities: 3.8%
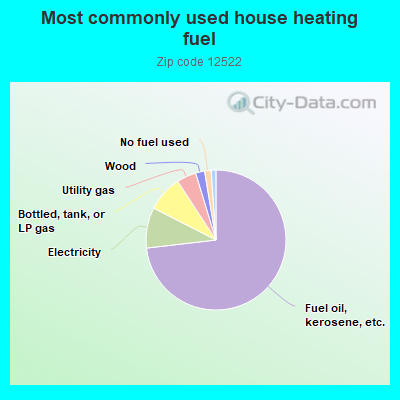
73.3%Fuel oil, kerosene, etc.
9.4%Electricity
8.3%Bottled, tank, or LP gas
4.5%Utility gas
2.1%Wood
1.5%No fuel used
0.6%Coal or coke
0.5%Other fuel
Population in 1990: 4,775. Population change in the 1990s: +916 (+19.2%).
Place of birth for U.S.-born residents:
This state: 2,718
Northeast: 1,142
Midwest: 42
South: 37
West: 59
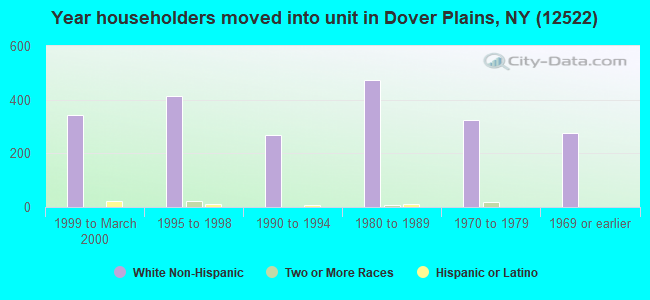
67% of the 12522 zip code residents lived in the same house 5 years ago. Out of people who lived in different houses, 69% lived in this county. Out of people who lived in different counties, 50% lived in New York.
96% of the 12522 zip code residents lived in the same house 1 year ago. Out of people who lived in different houses, 43% moved from this county. Out of people who lived in different houses, 46% moved from different county within same state. Out of people who lived in different houses, 9% moved from different state.
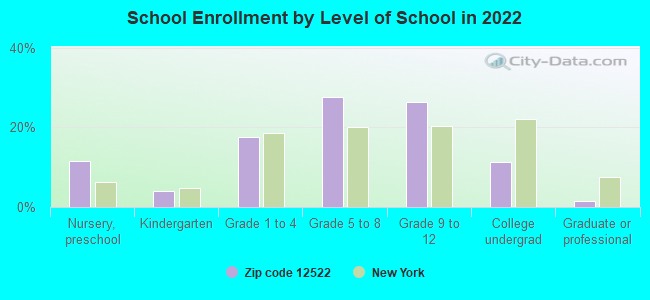
Private vs. public school enrollment:
Students in private schools in grades 1 to 8 (elementary and middle school): 87
Here:
26.6%
New York:
15.6%
Students in private schools in grades 9 to 12 (high school): 28
Here:
15.1%
New York:
15.0%
Students in private undergraduate colleges: 4
Here:
6.0%
New York:
39.2%
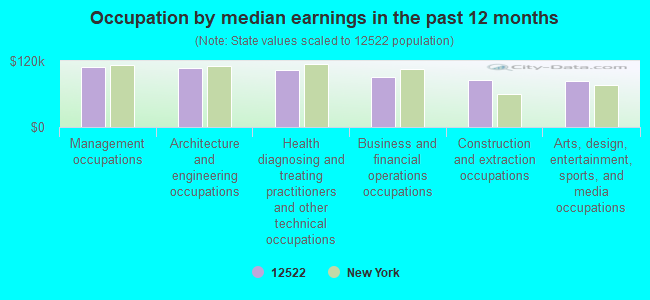
Occupation by median earnings in the past 12 months ($)
108,384Management occupations
106,960Architecture and engineering occupations
103,999Health diagnosing and treating practitioners and other technical occupations
91,310Business and financial operations occupations
86,085Construction and extraction occupations
82,882Arts, design, entertainment, sports, and media occupations
Top industries in this zip code by the number of employees in 2005:
Administrative and Support and Waste Management and Remediation Services: Security Systems Services (except Locksmiths) (50-99 employees: 1 establishment)
Accommodation and Food Services: Recreational and Vacation Camps (except Campgrounds) (20-49: 1)
Arts, Entertainment, and Recreation: All Other Amusement and Recreation Industries (20-49: 1)
Accommodation and Food Services: Limited-Service Restaurants (10-19: 2, 1-4: 1)
Accommodation and Food Services: Full-Service Restaurants (10-19: 1, 1-4: 3)
People in group quarters in 2010:
18 people in group homes intended for adults
6 people in residential treatment centers for adults
People in group quarters in 2000:
34 people in other noninstitutional group quarters
24 people in homes for the mentally retarded
Fatal accident statistics in 2013:
Fatal accident count: 1
Vehicles involved in fatal accidents: 2
Fatal accidents caused by drunken drivers: 0
Fatalities: 1
Persons involved in fatal accidents: 2
Pedestrians involved in fatal accidents: 0
Fatal accident statistics in 2010:
Fatal accident count: 1
Vehicles involved in fatal accidents: 1
Fatal accidents caused by drunken drivers: 0
Fatalities: 1
Persons involved in fatal accidents: 1
Pedestrians involved in fatal accidents: 0
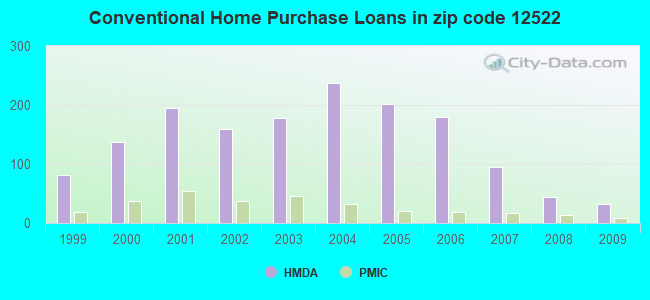
Home Mortgage Disclosure Act Aggregated Statistics For Year 2009 (Based on 6 partial tracts)
A) FHA, FSA/RHS & VA Home Purchase Loans
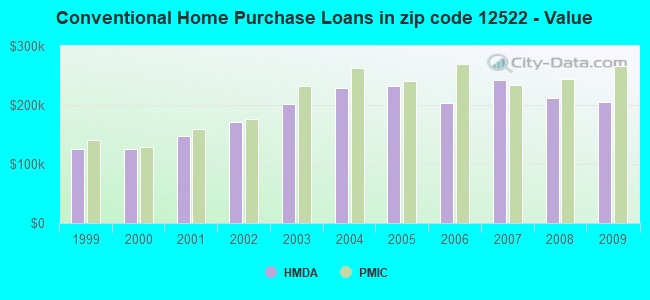
B) Conventional Home Purchase Loans
C) Refinancings
D) Home Improvement Loans
E) Loans on Dwellings For 5+ Families
F) Non-occupant Loans on < 5 Family Dwellings (A B C & D)
G) Loans On Manufactured Home Dwelling (A B C & D)
Number
Average Value
Number
Average Value
Number
Average Value
Number
Average Value
Number
Average Value
Number
Average Value
Number
Average Value
LOANS ORIGINATED
31
$227,398
33
$204,764
117
$225,207
11
$153,688
0
$0
8
$295,371
3
$42,833
APPLICATIONS APPROVED, NOT ACCEPTED
0
$0
4
$192,498
10
$243,489
0
$0
1
$119,820
1
$111,910
3
$126,523
APPLICATIONS DENIED
14
$229,131
18
$397,674
82
$238,392
14
$53,151
0
$0
10
$535,407
3
$64,673
APPLICATIONS WITHDRAWN
5
$187,082
10
$196,882
66
$243,043
5
$145,456
0
$0
4
$540,502
0
$0
FILES CLOSED FOR INCOMPLETENESS
0
$0
1
$204,940
19
$275,478
0
$0
0
$0
2
$731,470
0
$0
Aggregated Statistics For Year 2008 (Based on 6 partial tracts)
A) FHA, FSA/RHS & VA Home Purchase Loans
B) Conventional Home Purchase Loans
C) Refinancings
D) Home Improvement Loans
E) Loans on Dwellings For 5+ Families
F) Non-occupant Loans on < 5 Family Dwellings (A B C & D)
G) Loans On Manufactured Home Dwelling (A B C & D)
Number
Average Value
Number
Average Value
Number
Average Value
Number
Average Value
Number
Average Value
Number
Average Value
Number
Average Value
LOANS ORIGINATED
16
$269,757
44
$211,859
80
$225,744
27
$50,188
1
$386,500
8
$206,459
9
$37,426
APPLICATIONS APPROVED, NOT ACCEPTED
2
$179,225
11
$221,089
21
$220,095
6
$58,235
0
$0
1
$146,590
1
$75,650
APPLICATIONS DENIED
3
$289,980
18
$198,625
120
$241,162
33
$83,693
0
$0
3
$123,887
9
$43,431
APPLICATIONS WITHDRAWN
9
$300,853
10
$243,371
51
$248,187
7
$193,629
0
$0
3
$147,417
1
$38,650
FILES CLOSED FOR INCOMPLETENESS
0
$0
1
$223,960
16
$265,699
0
$0
0
$0
0
$0
0
$0
Aggregated Statistics For Year 2007 (Based on 6 partial tracts)
A) FHA, FSA/RHS & VA Home Purchase Loans
B) Conventional Home Purchase Loans
C) Refinancings
D) Home Improvement Loans
E) Loans on Dwellings For 5+ Families
F) Non-occupant Loans on < 5 Family Dwellings (A B C & D)
G) Loans On Manufactured Home Dwelling (A B C & D)
Number
Average Value
Number
Average Value
Number
Average Value
Number
Average Value
Number
Average Value
Number
Average Value
Number
Average Value
LOANS ORIGINATED
5
$236,384
95
$242,619
195
$217,934
58
$87,782
2
$78,125
19
$265,695
13
$50,301
APPLICATIONS APPROVED, NOT ACCEPTED
0
$0
20
$387,042
46
$288,075
10
$56,626
0
$0
2
$245,730
6
$45,590
APPLICATIONS DENIED
2
$378,870
50
$307,588
208
$244,550
61
$80,006
0
$0
19
$195,609
18
$60,359
APPLICATIONS WITHDRAWN
2
$225,180
12
$472,592
96
$260,948
13
$144,557
0
$0
4
$329,680
3
$35,853
FILES CLOSED FOR INCOMPLETENESS
0
$0
8
$121,186
31
$247,790
7
$81,213
0
$0
4
$336,262
6
$49,325
Aggregated Statistics For Year 2006 (Based on 6 partial tracts)
A) FHA, FSA/RHS & VA Home Purchase Loans
B) Conventional Home Purchase Loans
C) Refinancings
D) Home Improvement Loans
E) Loans on Dwellings For 5+ Families
F) Non-occupant Loans on < 5 Family Dwellings (A B C & D)
G) Loans On Manufactured Home Dwelling (A B C & D)
Number
Average Value
Number
Average Value
Number
Average Value
Number
Average Value
Number
Average Value
Number
Average Value
Number
Average Value
LOANS ORIGINATED
4
$242,908
180
$202,689
265
$206,049
43
$94,954
0
$0
22
$275,647
9
$52,519
APPLICATIONS APPROVED, NOT ACCEPTED
2
$149,815
25
$176,472
43
$185,515
10
$38,796
0
$0
4
$208,180
9
$39,807
APPLICATIONS DENIED
0
$0
80
$177,900
230
$230,380
71
$89,248
0
$0
16
$116,686
15
$67,718
APPLICATIONS WITHDRAWN
0
$0
31
$185,635
119
$210,993
24
$117,476
2
$160,840
8
$288,028
1
$91,210
FILES CLOSED FOR INCOMPLETENESS
0
$0
11
$213,132
36
$249,209
0
$0
0
$0
0
$0
4
$70,538
Aggregated Statistics For Year 2005 (Based on 6 partial tracts)
A) FHA, FSA/RHS & VA Home Purchase Loans
B) Conventional Home Purchase Loans
C) Refinancings
D) Home Improvement Loans
F) Non-occupant Loans on < 5 Family Dwellings (A B C & D)
G) Loans On Manufactured Home Dwelling (A B C & D)
Number
Average Value
Number
Average Value
Number
Average Value
Number
Average Value
Number
Average Value
Number
Average Value
LOANS ORIGINATED
0
$0
201
$232,720
309
$213,316
53
$90,246
24
$226,210
11
$92,888
APPLICATIONS APPROVED, NOT ACCEPTED
4
$148,895
25
$225,988
83
$219,815
9
$125,640
4
$564,268
6
$69,667
APPLICATIONS DENIED
0
$0
66
$158,707
193
$216,687
60
$70,227
7
$211,291
31
$63,280
APPLICATIONS WITHDRAWN
0
$0
34
$198,079
178
$209,767
33
$112,946
10
$200,398
6
$118,308
FILES CLOSED FOR INCOMPLETENESS
0
$0
13
$181,444
103
$235,758
2
$161,760
2
$438,150
3
$68,203
Aggregated Statistics For Year 2004 (Based on 6 partial tracts)
A) FHA, FSA/RHS & VA Home Purchase Loans
B) Conventional Home Purchase Loans
C) Refinancings
D) Home Improvement Loans
E) Loans on Dwellings For 5+ Families
F) Non-occupant Loans on < 5 Family Dwellings (A B C & D)
G) Loans On Manufactured Home Dwelling (A B C & D)
Number
Average Value
Number
Average Value
Number
Average Value
Number
Average Value
Number
Average Value
Number
Average Value
Number
Average Value
LOANS ORIGINATED
1
$198,660
238
$229,439
270
$203,163
50
$74,022
3
$609,437
23
$288,782
11
$72,021
APPLICATIONS APPROVED, NOT ACCEPTED
2
$141,540
36
$164,573
61
$178,133
17
$48,249
0
$0
8
$247,676
17
$62,966
APPLICATIONS DENIED
0
$0
61
$194,430
188
$171,643
41
$57,262
0
$0
16
$153,827
28
$65,857
APPLICATIONS WITHDRAWN
4
$159,465
36
$242,266
148
$194,505
26
$90,443
1
$162,330
3
$518,867
11
$41,100
FILES CLOSED FOR INCOMPLETENESS
0
$0
9
$248,983
60
$199,476
9
$91,800
0
$0
0
$0
0
$0
Aggregated Statistics For Year 2003 (Based on 6 partial tracts)
A) FHA, FSA/RHS & VA Home Purchase Loans
B) Conventional Home Purchase Loans
C) Refinancings
D) Home Improvement Loans
F) Non-occupant Loans on < 5 Family Dwellings (A B C & D)
Number
Average Value
Number
Average Value
Number
Average Value
Number
Average Value
Number
Average Value
LOANS ORIGINATED
4
$232,955
178
$202,445
514
$159,338
24
$50,469
31
$197,171
APPLICATIONS APPROVED, NOT ACCEPTED
4
$141,542
24
$125,153
86
$144,036
6
$51,792
6
$166,572
APPLICATIONS DENIED
2
$238,045
64
$107,509
257
$153,222
34
$47,024
8
$105,259
APPLICATIONS WITHDRAWN
2
$136,025
24
$227,030
159
$164,428
12
$45,618
1
$320,120
FILES CLOSED FOR INCOMPLETENESS
0
$0
4
$249,355
31
$163,485
4
$38,422
6
$130,512
Aggregated Statistics For Year 2002 (Based on 6 partial tracts)
A) FHA, FSA/RHS & VA Home Purchase Loans
B) Conventional Home Purchase Loans
C) Refinancings
D) Home Improvement Loans
F) Non-occupant Loans on < 5 Family Dwellings (A B C & D)
Number
Average Value
Number
Average Value
Number
Average Value
Number
Average Value
Number
Average Value
LOANS ORIGINATED
10
$165,183
160
$171,523
299
$147,996
35
$27,315
21
$178,933
APPLICATIONS APPROVED, NOT ACCEPTED
3
$197,720
26
$171,591
57
$126,758
11
$34,506
4
$242,100
APPLICATIONS DENIED
1
$166,190
77
$71,278
147
$127,599
36
$25,338
6
$24,708
APPLICATIONS WITHDRAWN
2
$113,970
16
$103,721
137
$144,504
24
$35,916
1
$432,950
FILES CLOSED FOR INCOMPLETENESS
0
$0
3
$349,447
74
$156,320
4
$18,382
3
$112,840
Aggregated Statistics For Year 2001 (Based on 6 partial tracts)
A) FHA, FSA/RHS & VA Home Purchase Loans
B) Conventional Home Purchase Loans
C) Refinancings
D) Home Improvement Loans
E) Loans on Dwellings For 5+ Families
F) Non-occupant Loans on < 5 Family Dwellings (A B C & D)
Number
Average Value
Number
Average Value
Number
Average Value
Number
Average Value
Number
Average Value
Number
Average Value
LOANS ORIGINATED
14
$158,109
195
$148,266
223
$131,579
41
$24,433
2
$186,615
14
$140,147
APPLICATIONS APPROVED, NOT ACCEPTED
3
$111,220
32
$93,355
27
$108,487
7
$37,241
0
$0
2
$29,410
APPLICATIONS DENIED
1
$134,500
76
$89,627
167
$121,576
44
$29,484
0
$0
12
$104,052
APPLICATIONS WITHDRAWN
6
$151,958
20
$129,723
112
$125,023
14
$27,519
0
$0
3
$70,893
FILES CLOSED FOR INCOMPLETENESS
0
$0
3
$161,287
33
$121,206
1
$11,600
0
$0
1
$109,770
Aggregated Statistics For Year 2000 (Based on 6 partial tracts)
A) FHA, FSA/RHS & VA Home Purchase Loans
B) Conventional Home Purchase Loans
C) Refinancings
D) Home Improvement Loans
E) Loans on Dwellings For 5+ Families
F) Non-occupant Loans on < 5 Family Dwellings (A B C & D)
Number
Average Value
Number
Average Value
Number
Average Value
Number
Average Value
Number
Average Value
Number
Average Value
LOANS ORIGINATED
19
$149,121
138
$125,473
68
$120,337
45
$27,569
1
$154,080
17
$175,568
APPLICATIONS APPROVED, NOT ACCEPTED
2
$133,270
30
$80,557
31
$104,098
20
$34,172
2
$221,505
4
$137,500
APPLICATIONS DENIED
5
$113,170
100
$79,442
107
$113,255
35
$31,643
2
$111,285
11
$123,624
APPLICATIONS WITHDRAWN
10
$144,275
43
$67,175
71
$77,980
8
$17,262
0
$0
0
$0
FILES CLOSED FOR INCOMPLETENESS
0
$0
2
$133,080
39
$135,083
0
$0
0
$0
2
$104,775
Aggregated Statistics For Year 1999 (Based on 4 partial tracts)
A) FHA, FSA/RHS & VA Home Purchase Loans
B) Conventional Home Purchase Loans
C) Refinancings
D) Home Improvement Loans
F) Non-occupant Loans on < 5 Family Dwellings (A B C & D)
2002 - 2018 National Fire Incident Reporting System (NFIRS) incidents
Based on the data from the years 2002 - 2018 the average number of fires per year is 14. The highest number of reported fires - 26 took place in 2018, and the least - 7 in 2013. The data has a rising trend.
When looking into fire subcategories, the most reports belonged to: Structure Fires (55.3%), and Outside Fires (20.4%).
Fire incident types reported to NFIRS in Zip Code 12522


 Nearest zip codes: 12594, 12592, 12585, 12545, 12570, 12540.
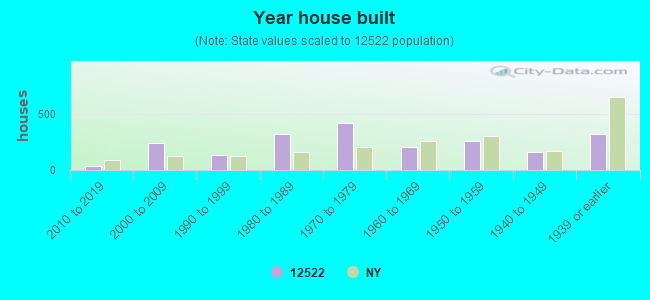


 Based on the data from the years 2002 - 2018 the average number of fires per year is 14. The highest number of reported fires - 26 took place in 2018, and the least - 7 in 2013. The data has a rising trend.
 When looking into fire subcategories, the most reports belonged to: Structure Fires (55.3%), and Outside Fires (20.4%).