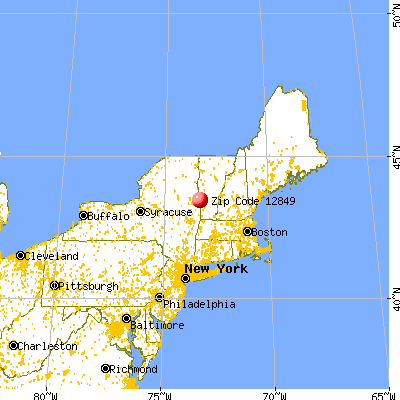
According to our research of New York and other state lists, there was 1 registered sex offender living in 12849 zip code as of May 29, 2024. The ratio of all residents to sex offenders in zip code 12849 is 268 to 1.
Median resident age:
This zip code:
49.9 years
New York median age:
40.0 years
Average household size:
This zip code:
2.5 people
New York:
2.5 people
Averages for the 2020 tax year for zip code 12849, filed in 2021:
Average Adjusted Gross Income (AGI) in 2020: $57,326 (Individual Income Tax Returns)
Here:
$57,326
State:
$90,930
Salary/wage: $51,686 (reported on 77.8% of returns)
Here:
$51,686
State:
$72,104
(% of AGI for various income ranges: 730.0% for AGIs below $25k, 3558.3% for AGIs $25k-50k, 5880.0% for AGIs $50k-75k, 9030.0% for AGIs $75k-100k, 16190.0% for AGIs $100k-200k)
Taxable interest for individuals: $440 (reported on 37.0% of returns)
This zip code:
$440
New York:
$3,075
(% of AGI for various income ranges: 5.0% for AGIs below $25k, 48.3% for AGIs $25k-50k, 23.3% for AGIs $50k-75k, 20.0% for AGIs $100k-200k)
Ordinary dividends: $1,440 (reported on 18.5% of returns)
Here:
$1,440
State:
$11,095
(% of AGI for various income ranges: 55.0% for AGIs below $25k, 166.7% for AGIs $50k-75k)
Net capital gain/loss in AGI: +$1,475 (reported on 14.8% of returns)
Here:
+$1,475
State:
+$44,925
(% of AGI for various income ranges: 233.3% for AGIs $50k-75k)
Profit/loss from business: +$3,850 (reported on 7.4% of returns)
Here:
+$3,850
State:
+$14,940
(% of AGI for various income ranges: 192.5% for AGIs below $25k)
Earned income credit: $2,233 (reported on 11.1% of returns)
Here:
$2,233
State:
$2,138
(% of AGI for various income ranges: 167.5% for AGIs below $25k)
Percentage of individuals using paid preparers for their 2020 taxes: 96.3%
Here:
96%
State:
95%
(% for various income ranges: 100.0% for AGIs below $25k, 100.0% for AGIs $25k-50k, 80.0% for AGIs $50k-75k, 100.0% for AGIs $75k-100k, 100.0% for AGIs $100k-200k)
Averages for the 2012 tax year for zip code 12849, filed in 2013:
Average Adjusted Gross Income (AGI) in 2012: $45,879 (Individual Income Tax Returns)
Here:
$45,879
State:
$77,088
Salary/wage: $41,296 (reported on 75.8% of returns)
Here:
$41,296
State:
$60,593
(% of AGI for various income ranges: 74.1% for AGIs below $25k, 65.0% for AGIs $25k-50k, 68.0% for AGIs $50k-75k, 76.9% for AGIs $75k-100k, 64.5% for AGIs $100k-200k)
Taxable interest for individuals: $450 (reported on 36.4% of returns)
This zip code:
$450
New York:
$3,125
(% of AGI for various income ranges: 1.2% for AGIs below $25k, 0.3% for AGIs $50k-75k, 0.5% for AGIs $100k-200k)
Ordinary dividends: $1,350 (reported on 18.2% of returns)
Here:
$1,350
State:
$10,299
Profit/loss from business: +$6,067 (reported on 9.1% of returns)
Here:
+$6,067
State:
+$16,168
Taxable individual retirement arrangement distribution: $4,433 (reported on 9.1% of returns)
12849:
$4,433
New York:
$17,621
Total itemized deductions: $18,950 (20% of AGI, reported on 24.2% of returns)
Here:
$18,950
State:
$34,985
Here:
20.0% of AGI
State:
21.3% of AGI
Charity contributions: $1,640 (reported on 15.2% of returns)
Here:
$1,640
State:
$5,572
Taxes paid: $9,100 (reported on 24.2% of returns)
12849:
$9,100
State:
$18,656
Earned income credit: $1,475 (reported on 12.1% of returns)
Here:
$1,475
State:
$2,230
(% of AGI for various income ranges: 3.8% for AGIs below $25k)
Percentage of individuals using paid preparers for their 2012 taxes: 51.5%
Here:
52%
State:
66%
(% for various income ranges: 46.2% for AGIs below $25k, 57.1% for AGIs $25k-50k, 83.3% for AGIs $50k-75k, 50.0% for AGIs $100k-200k)
Averages for the 2004 tax year for zip code 12849, filed in 2005:
Average Adjusted Gross Income (AGI) in 2004: $38,444 (Individual Income Tax Returns)
Here:
$38,444
State:
$59,519
Salary/wage: $34,624 (reported on 84.4% of returns)
Here:
$34,624
State:
$50,673
(% of AGI for various income ranges: 79.5% for AGIs below $10k, 78.4% for AGIs $10k-25k, 77.4% for AGIs $25k-50k, 78.4% for AGIs $50k-75k, 82.6% for AGIs $75k-100k, 69.0% for AGIs over 100k)
Taxable interest for individuals: $457 (reported on 41.2% of returns)
This zip code:
$457
New York:
$2,377
(% of AGI for various income ranges: 2.0% for AGIs below $10k, 1.1% for AGIs $10k-25k, 0.3% for AGIs $25k-50k, 0.4% for AGIs $50k-75k, 0.1% for AGIs $75k-100k, 0.5% for AGIs over 100k)
Taxable dividends: $1,847 (reported on 17.4% of returns)
Here:
$1,847
State:
$5,394
(% of AGI for various income ranges: 0.4% for AGIs $10k-25k, 0.1% for AGIs $25k-50k, 0.4% for AGIs $50k-75k, 2.4% for AGIs over 100k)
Net capital gain/loss: +$1,841 (reported on 12.9% of returns)
Here:
+$1,841
State:
+$23,581
(% of AGI for various income ranges: 0.3% for AGIs $10k-25k, 0.5% for AGIs $50k-75k, 1.7% for AGIs over 100k)
Profit/loss from business: +$7,156 (reported on 13.2% of returns)
Here:
+$7,156
State:
+$13,809
Total itemized deductions: $16,945 (22% of AGI, reported on 26.8% of returns)
Here:
$16,945
State:
$25,864
Here:
22.2% of AGI
State:
21.9% of AGI
(% of AGI for various income ranges: 38.0% for AGIs below $10k, 7.6% for AGIs $25k-50k, 15.3% for AGIs $50k-75k, 14.3% for AGIs $75k-100k, 14.6% for AGIs over 100k)
Charity contributions deductions: $1,108 (1% of AGI, reported on 21.8% of returns)
Here:
$1,108
State:
$4,439
Here:
1.4% of AGI
State:
3.6% of AGI
(% of AGI for various income ranges: 0.6% for AGIs $25k-50k, 0.8% for AGIs $50k-75k, 0.7% for AGIs $75k-100k, 0.8% for AGIs over 100k)
Total tax: $5,091 (reported on 74.1% of returns)
12849:
$5,091
State:
$11,730
(% of AGI for various income ranges: 2.9% for AGIs below $10k, 4.3% for AGIs $10k-25k, 6.3% for AGIs $25k-50k, 8.0% for AGIs $50k-75k, 9.5% for AGIs $75k-100k, 17.4% for AGIs over 100k)
Earned income credit: $1,255 (reported on 16.2% of returns)
Here:
$1,255
State:
$1,757
Percentage of individuals using paid preparers for their 2004 taxes: 65.3%
Here:
65%
State:
67%
(% for various income ranges: 57.5% for AGIs below $10k, 74.2% for AGIs $10k-25k, 71.7% for AGIs $25k-50k, 68.9% for AGIs $50k-75k, 70.8% for AGIs over 100k)
Household received Food Stamps/SNAP in the past 12 months: 0 Household did not receive Food Stamps/SNAP in the past 12 months: 159
Women who had a birth in the past 12 months: 21 (0 now married, 22 unmarried) Women who did not have a birth in the past 12 months: 112 (29 now married, 83 unmarried)
Housing units in zip code 12849 with a mortgage: 54 (15 second mortgage, 16 both second mortgage and home equity loan) Residents with income below the poverty level in 2022:
This zip code:
24.4%
Whole state:
14.3%
Residents with income below 50% of the poverty level in 2022:
This zip code:
23.8%
Whole state:
6.8%
Median number of rooms in houses and condos:
Here:
4.7
State:
6.3
Notable locations in this zip code not listed on our city pages
In group quarters: 7 (-1 institutionalized population)
Size of family households: 53 2-persons, 11 3-persons, 17 4-persons, 27 5-persons
Size of nonfamily households: 51 1-person
29 married couples with children.
0 single-parent households ().
101.5% of residents of 12849 zip code speak English at home.
Foreign born population: 0 (0.0%)
:
0.0%
Whole state:
22.7%
34%Welsh
31%English
28%French
9%Irish
Year of entry for the foreign-born population
02010 or later
02000 to 2009
01990 to 1999
8Before 1990
40.6%Bottled, tank, or LP gas
29.2%Fuel oil, kerosene, etc.
25.4%Electricity
5.7%Wood
Population in 1990: 249. Population change in the 1990s: +196 (+78.7%).
Place of birth for U.S.-born residents:
This state: 212
Northeast: 183
Midwest: 13
75% of the 12849 zip code residents lived in the same house 5 years ago. Out of people who lived in different houses, 75% lived in this county. Out of people who lived in different counties, 50% lived in New York.
100% of the 12849 zip code residents lived in the same house 1 year ago.
Students in private schools in grades 9 to 12 (high school):
Here:
0.0%
New York:
15.0%
Students in private undergraduate colleges:
Here:
0.0%
New York:
39.2%
Top industries in this zip code by the number of employees in 2005:
Wholesale Trade: Farm and Garden Machinery and Equipment Merchant Wholesalers (10-19 employees: 1 establishment)
Professional, Scientific, and Technical Services: Veterinary Services (10-19: 1)
Other Services (except Public Administration): Cemeteries and Crematories (1-4: 1)
Construction: Site Preparation Contractors (1-4: 1)
Construction: Masonry Contractors (1-4: 1)
Construction: Drywall and Insulation Contractors (1-4: 1)
Construction: Plumbing, Heating, and Air-Conditioning Contractors (1-4: 1)
People in group quarters in 2010:
12 people in group homes intended for adults
People in group quarters in 2000:
12 people in homes for the mentally retarded
Home Mortgage Disclosure Act Aggregated Statistics For Year 2009 (Based on 2 partial tracts)
A) FHA, FSA/RHS & VA Home Purchase Loans
B) Conventional Home Purchase Loans
C) Refinancings
D) Home Improvement Loans
F) Non-occupant Loans on < 5 Family Dwellings (A B C & D)
G) Loans On Manufactured Home Dwelling (A B C & D)
Number
Average Value
Number
Average Value
Number
Average Value
Number
Average Value
Number
Average Value
Number
Average Value
LOANS ORIGINATED
4
$101,625
2
$83,495
7
$116,573
2
$56,705
1
$184,590
1
$37,990
APPLICATIONS APPROVED, NOT ACCEPTED
0
$0
1
$50,350
1
$125,330
0
$0
0
$0
0
$0
APPLICATIONS DENIED
0
$0
1
$73,410
7
$105,846
2
$56,200
1
$70,630
1
$70,850
APPLICATIONS WITHDRAWN
0
$0
0
$0
2
$126,660
0
$0
0
$0
0
$0
FILES CLOSED FOR INCOMPLETENESS
0
$0
0
$0
1
$160,420
0
$0
0
$0
0
$0
Aggregated Statistics For Year 2008 (Based on 2 partial tracts)
A) FHA, FSA/RHS & VA Home Purchase Loans
B) Conventional Home Purchase Loans
C) Refinancings
D) Home Improvement Loans
F) Non-occupant Loans on < 5 Family Dwellings (A B C & D)
G) Loans On Manufactured Home Dwelling (A B C & D)
Number
Average Value
Number
Average Value
Number
Average Value
Number
Average Value
Number
Average Value
Number
Average Value
LOANS ORIGINATED
2
$123,095
3
$102,043
5
$109,862
4
$16,542
1
$75,970
1
$20,940
APPLICATIONS APPROVED, NOT ACCEPTED
0
$0
1
$74,970
1
$147,490
0
$0
1
$35,980
0
$0
APPLICATIONS DENIED
1
$113,070
2
$96,080
9
$104,852
6
$35,667
1
$38,990
2
$79,260
APPLICATIONS WITHDRAWN
0
$0
1
$57,370
5
$108,258
0
$0
0
$0
0
$0
FILES CLOSED FOR INCOMPLETENESS
0
$0
0
$0
1
$175,120
0
$0
0
$0
0
$0
Aggregated Statistics For Year 2007 (Based on 2 partial tracts)
A) FHA, FSA/RHS & VA Home Purchase Loans
B) Conventional Home Purchase Loans
C) Refinancings
D) Home Improvement Loans
F) Non-occupant Loans on < 5 Family Dwellings (A B C & D)
G) Loans On Manufactured Home Dwelling (A B C & D)
Number
Average Value
Number
Average Value
Number
Average Value
Number
Average Value
Number
Average Value
Number
Average Value
LOANS ORIGINATED
3
$102,043
5
$105,362
11
$98,842
5
$34,356
2
$74,190
2
$56,480
APPLICATIONS APPROVED, NOT ACCEPTED
0
$0
2
$92,295
2
$130,395
1
$49,570
0
$0
1
$53,470
APPLICATIONS DENIED
0
$0
3
$109,097
13
$132,703
10
$47,401
1
$48,120
2
$78,925
APPLICATIONS WITHDRAWN
1
$38,990
1
$55,920
7
$97,809
2
$79,705
0
$0
1
$29,080
FILES CLOSED FOR INCOMPLETENESS
0
$0
0
$0
1
$114,070
0
$0
0
$0
0
$0
Aggregated Statistics For Year 2006 (Based on 2 partial tracts)
A) FHA, FSA/RHS & VA Home Purchase Loans
B) Conventional Home Purchase Loans
C) Refinancings
D) Home Improvement Loans
F) Non-occupant Loans on < 5 Family Dwellings (A B C & D)
G) Loans On Manufactured Home Dwelling (A B C & D)
Number
Average Value
Number
Average Value
Number
Average Value
Number
Average Value
Number
Average Value
Number
Average Value
LOANS ORIGINATED
2
$110,565
7
$90,361
13
$100,260
6
$26,903
3
$73,673
1
$93,350
APPLICATIONS APPROVED, NOT ACCEPTED
0
$0
1
$63,500
3
$102,227
1
$30,410
0
$0
0
$0
APPLICATIONS DENIED
0
$0
3
$82,583
17
$95,935
10
$29,042
1
$78,760
3
$39,063
APPLICATIONS WITHDRAWN
0
$0
2
$73,080
9
$106,499
1
$90,570
1
$51,470
0
$0
FILES CLOSED FOR INCOMPLETENESS
0
$0
0
$0
3
$131,303
0
$0
0
$0
0
$0
Aggregated Statistics For Year 2005 (Based on 2 partial tracts)
A) FHA, FSA/RHS & VA Home Purchase Loans
B) Conventional Home Purchase Loans
C) Refinancings
D) Home Improvement Loans
F) Non-occupant Loans on < 5 Family Dwellings (A B C & D)
G) Loans On Manufactured Home Dwelling (A B C & D)
Number
Average Value
Number
Average Value
Number
Average Value
Number
Average Value
Number
Average Value
Number
Average Value
LOANS ORIGINATED
2
$121,425
9
$96,051
15
$78,760
5
$58,930
2
$95,915
1
$69,510
APPLICATIONS APPROVED, NOT ACCEPTED
0
$0
1
$55,370
3
$91,867
0
$0
0
$0
0
$0
APPLICATIONS DENIED
0
$0
3
$76,457
14
$73,723
8
$35,064
1
$58,710
2
$57,930
APPLICATIONS WITHDRAWN
0
$0
1
$92,570
8
$88,368
1
$86,780
0
$0
1
$46,570
FILES CLOSED FOR INCOMPLETENESS
0
$0
1
$43,450
2
$64,670
0
$0
0
$0
0
$0
Aggregated Statistics For Year 2004 (Based on 2 partial tracts)
A) FHA, FSA/RHS & VA Home Purchase Loans
B) Conventional Home Purchase Loans
C) Refinancings
D) Home Improvement Loans
F) Non-occupant Loans on < 5 Family Dwellings (A B C & D)
G) Loans On Manufactured Home Dwelling (A B C & D)
Number
Average Value
Number
Average Value
Number
Average Value
Number
Average Value
Number
Average Value
Number
Average Value
LOANS ORIGINATED
1
$108,500
10
$91,081
12
$79,066
4
$28,045
2
$73,190
1
$75,080
APPLICATIONS APPROVED, NOT ACCEPTED
0
$0
2
$69,180
3
$68,327
1
$19,050
0
$0
0
$0
APPLICATIONS DENIED
1
$67,840
2
$75,750
13
$74,672
4
$21,582
1
$29,740
1
$78,090
APPLICATIONS WITHDRAWN
0
$0
0
$0
6
$88,563
0
$0
0
$0
1
$36,320
FILES CLOSED FOR INCOMPLETENESS
0
$0
0
$0
1
$88,230
0
$0
0
$0
0
$0
Aggregated Statistics For Year 2003 (Based on 2 partial tracts)
A) FHA, FSA/RHS & VA Home Purchase Loans
B) Conventional Home Purchase Loans
C) Refinancings
D) Home Improvement Loans
F) Non-occupant Loans on < 5 Family Dwellings (A B C & D)
Number
Average Value
Number
Average Value
Number
Average Value
Number
Average Value
Number
Average Value
LOANS ORIGINATED
2
$85,110
6
$81,842
16
$71,310
2
$14,705
2
$63,610
APPLICATIONS APPROVED, NOT ACCEPTED
0
$0
1
$61,380
3
$80,467
1
$14,590
0
$0
APPLICATIONS DENIED
0
$0
1
$134,010
11
$74,020
2
$12,255
0
$0
APPLICATIONS WITHDRAWN
0
$0
0
$0
8
$77,075
0
$0
1
$70,070
FILES CLOSED FOR INCOMPLETENESS
0
$0
0
$0
1
$41,890
0
$0
0
$0
Aggregated Statistics For Year 2002 (Based on 2 partial tracts)
A) FHA, FSA/RHS & VA Home Purchase Loans
B) Conventional Home Purchase Loans
C) Refinancings
D) Home Improvement Loans
F) Non-occupant Loans on < 5 Family Dwellings (A B C & D)
Number
Average Value
Number
Average Value
Number
Average Value
Number
Average Value
Number
Average Value
LOANS ORIGINATED
1
$89,790
6
$75,158
10
$71,207
2
$10,860
1
$70,070
APPLICATIONS APPROVED, NOT ACCEPTED
0
$0
1
$31,410
2
$70,515
1
$16,930
0
$0
APPLICATIONS DENIED
0
$0
1
$45,340
10
$71,196
3
$8,280
0
$0
APPLICATIONS WITHDRAWN
0
$0
1
$72,300
5
$70,628
0
$0
0
$0
FILES CLOSED FOR INCOMPLETENESS
0
$0
0
$0
1
$42,440
0
$0
0
$0
Aggregated Statistics For Year 2001 (Based on 2 partial tracts)
A) FHA, FSA/RHS & VA Home Purchase Loans
B) Conventional Home Purchase Loans
C) Refinancings
D) Home Improvement Loans
F) Non-occupant Loans on < 5 Family Dwellings (A B C & D)
Number
Average Value
Number
Average Value
Number
Average Value
Number
Average Value
Number
Average Value
LOANS ORIGINATED
2
$63,500
5
$62,028
9
$58,436
3
$14,483
1
$38,880
APPLICATIONS APPROVED, NOT ACCEPTED
0
$0
1
$46,900
3
$56,777
1
$10,030
0
$0
APPLICATIONS DENIED
0
$0
3
$48,607
9
$66,469
4
$14,872
1
$44,340
APPLICATIONS WITHDRAWN
0
$0
1
$38,770
5
$55,478
1
$17,040
0
$0
FILES CLOSED FOR INCOMPLETENESS
0
$0
0
$0
1
$61,270
0
$0
0
$0
Aggregated Statistics For Year 2000 (Based on 2 partial tracts)
A) FHA, FSA/RHS & VA Home Purchase Loans
B) Conventional Home Purchase Loans
C) Refinancings
D) Home Improvement Loans
F) Non-occupant Loans on < 5 Family Dwellings (A B C & D)
Number
Average Value
Number
Average Value
Number
Average Value
Number
Average Value
Number
Average Value
LOANS ORIGINATED
2
$75,865
5
$65,860
5
$63,944
2
$13,590
1
$87,000
APPLICATIONS APPROVED, NOT ACCEPTED
0
$0
1
$105,940
2
$76,365
1
$21,720
0
$0
APPLICATIONS DENIED
0
$0
5
$48,280
9
$52,444
3
$11,030
2
$60,435
APPLICATIONS WITHDRAWN
1
$30,520
1
$39,100
4
$68,400
0
$0
0
$0
FILES CLOSED FOR INCOMPLETENESS
0
$0
1
$30,630
2
$48,625
0
$0
0
$0
Aggregated Statistics For Year 1999 (Based on 1 partial tract)


 Nearest zip codes: 12837, 12832, 05774, 05775, 12887, 12821.


