Estimated zip code population in 2022: 2,340 Zip code population in 2010: 2,750 Zip code population in 2000: 3,219
Houses and condos: 123 Renter-occupied apartments: 51
% of renters here:
41%
State:
46%
March 2022 cost of living index in zip code 12821: 98.2 (near average, U.S. average is 100)
Land area: 5.5 sq. mi. Water area: 0.1 sq. mi.
Population density: 422 people per square mile
(low).
OSM Map
General Map
Google Map
MSN Map
OSM Map
General Map
Google Map
MSN Map
OSM Map
General Map
Google Map
MSN Map
OSM Map
General Map
Google Map
MSN Map
Please wait while loading the map...
Real estate property taxes paid for housing units in 2022:
This zip code:
1.6% ($3,505)
New York:
1.5% ($6,180)
Median real estate property taxes paid for housing units with mortgages in 2022: $3,502 (1.9%) Median real estate property taxes paid for housing units with no mortgage in 2022: $3,506 (1.5%)
Business Search- 14 Million verified businesses
Males: 2,176
(93.0%)
Females: 164
(7.0%)
For population 25 years and over in 12821:
High school or higher: 58.8%
Bachelor's degree or higher: 3.3%
Graduate or professional degree: 0.3%
Unemployed: 3.9%
Mean travel time to work (commute): 25.3 minutes
For population 15 years and over in 12821:
Never married: 60.7%
Now married: 21.3%
Separated: 4.0%
Widowed: 3.2%
Divorced: 10.8%
Zip code 12821 compared to state average:
Median household income significantly below state average.
Median house value below state average.
Black race population percentage significantly above state average.
Foreign-born population percentage significantly below state average.
Length of stay since moving in above state average.
House age below state average.
Number of college students significantly below state average.
Percentage of population with a bachelor's degree or higher significantly below state average.
Averages for the 2020 tax year for zip code 12821, filed in 2021:
Average Adjusted Gross Income (AGI) in 2020: $39,611 (Individual Income Tax Returns)
Here:
$39,611
State:
$90,930
Salary/wage: $46,925 (reported on 63.2% of returns)
Here:
$46,925
State:
$72,104
(% of AGI for various income ranges: 1003.3% for AGIs below $25k, 2967.5% for AGIs $25k-50k, 7845.0% for AGIs $50k-75k, 12870.0% for AGIs $75k-100k)
Earned income credit: $1,700 (reported on 10.5% of returns)
Here:
$1,700
State:
$2,138
(% of AGI for various income ranges: 113.3% for AGIs below $25k)
Percentage of individuals using paid preparers for their 2020 taxes: 73.7%
Here:
74%
State:
95%
(% for various income ranges: 44.4% for AGIs below $25k, 100.0% for AGIs $25k-50k, 100.0% for AGIs $50k-75k, 100.0% for AGIs $75k-100k)
Averages for the 2012 tax year for zip code 12821, filed in 2013:
Average Adjusted Gross Income (AGI) in 2012: $40,531 (Individual Income Tax Returns)
Here:
$40,531
State:
$77,088
Salary/wage: $38,908 (reported on 81.2% of returns)
Here:
$38,908
State:
$60,593
(% of AGI for various income ranges: 74.2% for AGIs below $25k, 80.4% for AGIs $25k-50k, 82.7% for AGIs $50k-75k, 75.1% for AGIs $75k-100k)
Taxable interest for individuals: $133 (reported on 18.8% of returns)
This zip code:
$133
New York:
$3,125
Total itemized deductions: $13,933 (19% of AGI, reported on 18.8% of returns)
Here:
$13,933
State:
$34,985
Here:
18.6% of AGI
State:
21.3% of AGI
Taxes paid: $6,433 (reported on 18.8% of returns)
12821:
$6,433
State:
$18,656
Earned income credit: $2,333 (reported on 18.8% of returns)
Here:
$2,333
State:
$2,230
(% of AGI for various income ranges: 9.4% for AGIs below $25k)
Percentage of individuals using paid preparers for their 2012 taxes: 43.8%
Here:
44%
State:
66%
(% for various income ranges: 33.3% for AGIs below $25k, 60.0% for AGIs $25k-50k, 100.0% for AGIs $50k-75k)
Averages for the 2004 tax year for zip code 12821, filed in 2005:
Average Adjusted Gross Income (AGI) in 2004: $31,135 (Individual Income Tax Returns)
Here:
$31,135
State:
$59,519
Salary/wage: $30,515 (reported on 87.7% of returns)
Here:
$30,515
State:
$50,673
(% of AGI for various income ranges: 92.3% for AGIs below $10k, 74.3% for AGIs $10k-25k, 92.5% for AGIs $25k-50k, 134.1% for AGIs $50k-75k)
Taxable interest for individuals: $158 (reported on 24.5% of returns)
This zip code:
$158
New York:
$2,377
Total itemized deductions: $12,718 (24% of AGI, reported on 25.2% of returns)
Here:
$12,718
State:
$25,864
Here:
24.3% of AGI
State:
21.9% of AGI
Charity contributions deductions: $2,067 (4% of AGI, reported on 19.4% of returns)
Here:
$2,067
State:
$4,439
Here:
3.7% of AGI
State:
3.6% of AGI
Total tax: $3,243 (reported on 69.0% of returns)
12821:
$3,243
State:
$11,730
(% of AGI for various income ranges: 0.7% for AGIs below $10k, 2.8% for AGIs $10k-25k, 5.7% for AGIs $25k-50k, 8.6% for AGIs $50k-75k, 11.5% for AGIs $75k-100k)
Earned income credit: $1,759 (reported on 18.7% of returns)
Here:
$1,759
State:
$1,757
Percentage of individuals using paid preparers for their 2004 taxes: 61.3%
Here:
61%
State:
67%
(% for various income ranges: 35.9% for AGIs below $10k, 83.8% for AGIs $10k-25k, 56.8% for AGIs $25k-50k, 100.0% for AGIs $50k-75k)
Notable locations in zip code 12821: Great Meadow State Correctional Facility (A), Washington State Correctional Facility (B). Display/hide their locations on the map
In group quarters: 2,116 (-1 institutionalized population)
Size of family households: 80 2-persons, 15 4-persons, 7 6-persons
Size of nonfamily households: 22 2-persons
4 married couples with children.
32 single-parent households (32 men).
82.5% of residents of 12821 zip code speak English at home.
12.2% of residents speak Spanish at home (55% very well, 13% well, 29% not well, 3% not at all).
1.6% of residents speak other Indo-European language at home (51% very well, 49% well).
2.7% of residents speak other language at home (27% very well, 73% not well).
Foreign born population: 193 (8.3%) (16.2% of them are naturalized citizens)
This zip code:
8.3%
Whole state:
22.7%
14%Dominica
10%Ecuador
9%Germany
9%St. Vincent and the Grenadines
8%Cuba
8%Costa Rica
6%Afghanistan
20%American
3%Ethiopian
1%Guyanese
1%Dutch
1%Irish
1%Trinidadian and Tobagonian
0%Polish
Year of entry for the foreign-born population
1062010 or later
372000 to 2009
331990 to 1999
121Before 1990
Facilities with environmental interests located in this zip code:
GREAT MEADOWS CORRECTIONAL FACILITY (ROUTE 22, BOX 51 in COMSTOCK, NY)
COMPLIANCE ACTIVITY (Tracking inspections of insecticide, fungicide, and rodenticide, and toxic substances) Alternative names: GREAT MEADOW CORR FACIL
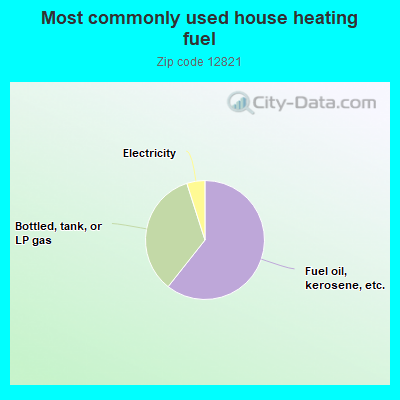
61.5%Fuel oil, kerosene, etc.
34.9%Bottled, tank, or LP gas
5.0%Electricity
Population in 1990: 1,226. Population change in the 1990s: +1,993 (+162.6%).
Place of birth for U.S.-born residents:
This state: 1,680
Northeast: 101
Midwest: 62
South: 163
West: 33
12% of the 12821 zip code residents lived in the same house 5 years ago. Out of people who lived in different houses, 3% lived in this county. Out of people who lived in different counties, 50% lived in New York.
58% of the 12821 zip code residents lived in the same house 1 year ago. Out of people who lived in different houses, 1% moved from this county. Out of people who lived in different houses, 102% moved from different county within same state.
Private vs. public school enrollment:
Students in private schools in grades 1 to 8 (elementary and middle school): 42
Here:
55.5%
New York:
15.6%
Students in private schools in grades 9 to 12 (high school): 262
Here:
100.0%
New York:
15.0%
Students in private undergraduate colleges: 24
Here:
68.8%
New York:
39.2%
Top industries in this zip code by the number of employees in 2005:
Accommodation and Food Services: Limited-Service Restaurants (1-4 employees: 1 establishment)
Professional, Scientific, and Technical Services: Other Services Related to Advertising (1-4: 1)
People in group quarters in 2010:
2,433 people in state prisons
People in group quarters in 2000:
2,719 people in state prisons
Home Mortgage Disclosure Act Aggregated Statistics For Year 2009 (Based on 2 partial tracts)
A) FHA, FSA/RHS & VA Home Purchase Loans
B) Conventional Home Purchase Loans
C) Refinancings
D) Home Improvement Loans
F) Non-occupant Loans on < 5 Family Dwellings (A B C & D)
G) Loans On Manufactured Home Dwelling (A B C & D)
Number
Average Value
Number
Average Value
Number
Average Value
Number
Average Value
Number
Average Value
Number
Average Value
LOANS ORIGINATED
3
$119,573
4
$231,182
10
$208,696
2
$94,620
3
$449,413
1
$41,800
APPLICATIONS APPROVED, NOT ACCEPTED
0
$0
1
$110,390
1
$91,960
0
$0
0
$0
0
$0
APPLICATIONS DENIED
0
$0
2
$73,055
8
$146,466
3
$12,033
1
$142,120
0
$0
APPLICATIONS WITHDRAWN
0
$0
1
$88,160
5
$245,328
0
$0
1
$653,410
0
$0
FILES CLOSED FOR INCOMPLETENESS
0
$0
0
$0
0
$0
0
$0
0
$0
0
$0
Aggregated Statistics For Year 2008 (Based on 2 partial tracts)
A) FHA, FSA/RHS & VA Home Purchase Loans
B) Conventional Home Purchase Loans
C) Refinancings
D) Home Improvement Loans
F) Non-occupant Loans on < 5 Family Dwellings (A B C & D)
G) Loans On Manufactured Home Dwelling (A B C & D)
Number
Average Value
Number
Average Value
Number
Average Value
Number
Average Value
Number
Average Value
Number
Average Value
LOANS ORIGINATED
1
$167,390
4
$244,625
9
$154,576
3
$47,310
2
$308,845
0
$0
APPLICATIONS APPROVED, NOT ACCEPTED
0
$0
1
$319,390
2
$137,180
0
$0
0
$0
0
$0
APPLICATIONS DENIED
0
$0
1
$54,340
9
$143,281
4
$66,880
1
$79,800
1
$86,450
APPLICATIONS WITHDRAWN
0
$0
0
$0
4
$147,012
1
$98,610
0
$0
0
$0
FILES CLOSED FOR INCOMPLETENESS
0
$0
0
$0
2
$137,085
0
$0
0
$0
0
$0
Aggregated Statistics For Year 2007 (Based on 2 partial tracts)
A) FHA, FSA/RHS & VA Home Purchase Loans
B) Conventional Home Purchase Loans
C) Refinancings
D) Home Improvement Loans
F) Non-occupant Loans on < 5 Family Dwellings (A B C & D)
G) Loans On Manufactured Home Dwelling (A B C & D)
Number
Average Value
Number
Average Value
Number
Average Value
Number
Average Value
Number
Average Value
Number
Average Value
LOANS ORIGINATED
1
$133,950
7
$159,573
13
$131,875
5
$36,024
3
$289,560
1
$63,650
APPLICATIONS APPROVED, NOT ACCEPTED
0
$0
1
$82,080
3
$253,523
1
$67,830
1
$173,850
0
$0
APPLICATIONS DENIED
0
$0
2
$88,350
15
$160,563
7
$50,133
2
$225,150
2
$65,550
APPLICATIONS WITHDRAWN
0
$0
1
$101,460
8
$131,076
1
$76,380
0
$0
0
$0
FILES CLOSED FOR INCOMPLETENESS
0
$0
0
$0
2
$199,785
0
$0
0
$0
0
$0
Aggregated Statistics For Year 2006 (Based on 2 partial tracts)
A) FHA, FSA/RHS & VA Home Purchase Loans
B) Conventional Home Purchase Loans
C) Refinancings
D) Home Improvement Loans
F) Non-occupant Loans on < 5 Family Dwellings (A B C & D)
G) Loans On Manufactured Home Dwelling (A B C & D)
Number
Average Value
Number
Average Value
Number
Average Value
Number
Average Value
Number
Average Value
Number
Average Value
LOANS ORIGINATED
1
$153,330
9
$172,879
16
$112,231
8
$45,814
3
$229,583
2
$86,355
APPLICATIONS APPROVED, NOT ACCEPTED
0
$0
2
$123,690
5
$146,072
1
$38,950
1
$174,800
0
$0
APPLICATIONS DENIED
0
$0
2
$76,950
16
$164,778
10
$32,490
1
$91,580
2
$57,000
APPLICATIONS WITHDRAWN
0
$0
2
$108,110
9
$102,938
2
$47,120
1
$83,600
0
$0
FILES CLOSED FOR INCOMPLETENESS
0
$0
1
$243,960
3
$205,833
1
$35,530
1
$282,150
0
$0
Aggregated Statistics For Year 2005 (Based on 2 partial tracts)
A) FHA, FSA/RHS & VA Home Purchase Loans
B) Conventional Home Purchase Loans
C) Refinancings
D) Home Improvement Loans
F) Non-occupant Loans on < 5 Family Dwellings (A B C & D)
G) Loans On Manufactured Home Dwelling (A B C & D)
Number
Average Value
Number
Average Value
Number
Average Value
Number
Average Value
Number
Average Value
Number
Average Value
LOANS ORIGINATED
2
$107,350
10
$187,017
15
$114,253
6
$28,975
2
$302,575
1
$42,370
APPLICATIONS APPROVED, NOT ACCEPTED
0
$0
2
$121,125
3
$176,573
1
$5,890
0
$0
0
$0
APPLICATIONS DENIED
0
$0
4
$82,175
12
$148,802
7
$92,123
1
$15,200
3
$63,587
APPLICATIONS WITHDRAWN
0
$0
2
$96,710
12
$138,589
2
$46,550
1
$50,160
0
$0
FILES CLOSED FOR INCOMPLETENESS
0
$0
0
$0
1
$312,170
0
$0
0
$0
0
$0
Aggregated Statistics For Year 2004 (Based on 2 partial tracts)
A) FHA, FSA/RHS & VA Home Purchase Loans
B) Conventional Home Purchase Loans
C) Refinancings
D) Home Improvement Loans
F) Non-occupant Loans on < 5 Family Dwellings (A B C & D)
G) Loans On Manufactured Home Dwelling (A B C & D)
Number
Average Value
Number
Average Value
Number
Average Value
Number
Average Value
Number
Average Value
Number
Average Value
LOANS ORIGINATED
2
$101,935
10
$192,166
16
$85,666
6
$23,813
3
$313,120
1
$63,080
APPLICATIONS APPROVED, NOT ACCEPTED
0
$0
1
$77,520
5
$104,044
1
$39,900
0
$0
0
$0
APPLICATIONS DENIED
0
$0
2
$80,845
14
$96,384
5
$17,974
1
$213,560
1
$68,780
APPLICATIONS WITHDRAWN
1
$77,330
1
$50,920
8
$82,412
1
$38,000
0
$0
1
$51,300
FILES CLOSED FOR INCOMPLETENESS
0
$0
1
$44,270
1
$68,210
0
$0
0
$0
0
$0
Aggregated Statistics For Year 2003 (Based on 2 partial tracts)
A) FHA, FSA/RHS & VA Home Purchase Loans
B) Conventional Home Purchase Loans
C) Refinancings
D) Home Improvement Loans
F) Non-occupant Loans on < 5 Family Dwellings (A B C & D)
Number
Average Value
Number
Average Value
Number
Average Value
Number
Average Value
Number
Average Value
LOANS ORIGINATED
2
$93,005
6
$196,112
25
$91,078
3
$24,573
4
$227,525
APPLICATIONS APPROVED, NOT ACCEPTED
0
$0
1
$154,470
5
$91,314
1
$25,650
0
$0
APPLICATIONS DENIED
0
$0
2
$66,215
13
$90,279
4
$27,740
0
$0
APPLICATIONS WITHDRAWN
0
$0
1
$41,800
6
$96,932
1
$31,730
0
$0
FILES CLOSED FOR INCOMPLETENESS
0
$0
0
$0
1
$96,710
0
$0
0
$0
Aggregated Statistics For Year 2002 (Based on 2 partial tracts)
A) FHA, FSA/RHS & VA Home Purchase Loans
B) Conventional Home Purchase Loans
C) Refinancings
D) Home Improvement Loans
F) Non-occupant Loans on < 5 Family Dwellings (A B C & D)
Number
Average Value
Number
Average Value
Number
Average Value
Number
Average Value
Number
Average Value
LOANS ORIGINATED
2
$90,535
6
$141,867
11
$93,670
3
$13,300
2
$210,425
APPLICATIONS APPROVED, NOT ACCEPTED
0
$0
1
$88,540
4
$100,652
1
$31,350
0
$0
APPLICATIONS DENIED
0
$0
2
$172,805
11
$74,083
3
$23,940
1
$85,880
APPLICATIONS WITHDRAWN
0
$0
1
$50,920
6
$75,240
1
$24,890
1
$32,110
FILES CLOSED FOR INCOMPLETENESS
0
$0
0
$0
1
$69,920
0
$0
0
$0
Aggregated Statistics For Year 2001 (Based on 2 partial tracts)
A) FHA, FSA/RHS & VA Home Purchase Loans
B) Conventional Home Purchase Loans
C) Refinancings
D) Home Improvement Loans
F) Non-occupant Loans on < 5 Family Dwellings (A B C & D)
Number
Average Value
Number
Average Value
Number
Average Value
Number
Average Value
Number
Average Value
LOANS ORIGINATED
2
$79,325
4
$102,790
13
$81,671
2
$9,595
1
$257,450
APPLICATIONS APPROVED, NOT ACCEPTED
0
$0
1
$45,030
4
$52,298
1
$20,330
1
$47,120
APPLICATIONS DENIED
0
$0
2
$57,475
10
$77,653
3
$16,720
0
$0
APPLICATIONS WITHDRAWN
0
$0
1
$59,090
6
$84,993
1
$13,490
0
$0
FILES CLOSED FOR INCOMPLETENESS
0
$0
0
$0
1
$61,370
0
$0
0
$0
Aggregated Statistics For Year 2000 (Based on 2 partial tracts)
A) FHA, FSA/RHS & VA Home Purchase Loans
B) Conventional Home Purchase Loans
C) Refinancings
D) Home Improvement Loans
F) Non-occupant Loans on < 5 Family Dwellings (A B C & D)
Number
Average Value
Number
Average Value
Number
Average Value
Number
Average Value
Number
Average Value
LOANS ORIGINATED
2
$67,355
4
$98,990
5
$66,044
3
$19,190
1
$45,030
APPLICATIONS APPROVED, NOT ACCEPTED
0
$0
2
$80,275
2
$50,350
1
$19,570
0
$0
APPLICATIONS DENIED
0
$0
3
$71,440
10
$57,133
2
$42,085
1
$110,200
APPLICATIONS WITHDRAWN
0
$0
0
$0
4
$67,878
0
$0
0
$0
FILES CLOSED FOR INCOMPLETENESS
0
$0
0
$0
1
$49,210
0
$0
0
$0
Aggregated Statistics For Year 1999 (Based on 1 partial tract)
A) FHA, FSA/RHS & VA Home Purchase Loans
B) Conventional Home Purchase Loans
C) Refinancings
D) Home Improvement Loans
F) Non-occupant Loans on < 5 Family Dwellings (A B C & D)

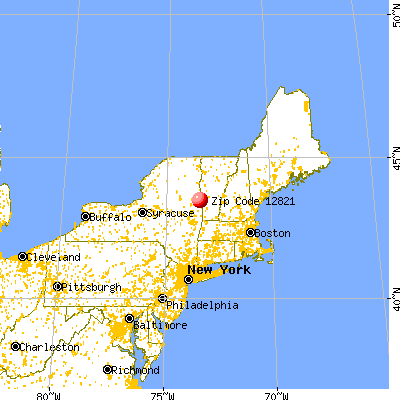


 Nearest zip codes: 12887, 12827, 12849, 12838, 12832, 12819.