Estimated zip code population in 2022: 2,288 Zip code population in 2010: 2,208 Zip code population in 2000: 2,083
Houses and condos: 1,119 Renter-occupied apartments: 217
% of renters here:
21%
State:
46%
March 2022 cost of living index in zip code 12926: 93.7 (less than average, U.S. average is 100)
Land area: 48.5 sq. mi. Water area: 0.0 sq. mi.
Population density: 47 people per square mile
(very low).
OSM Map
General Map
Google Map
MSN Map
OSM Map
General Map
Google Map
MSN Map
OSM Map
General Map
Google Map
MSN Map
OSM Map
General Map
Google Map
MSN Map
Please wait while loading the map...
Real estate property taxes paid for housing units in 2022:
This zip code:
1.7% ($1,952)
New York:
1.5% ($6,180)
Median real estate property taxes paid for housing units with mortgages in 2022: $2,570 (1.5%) Median real estate property taxes paid for housing units with no mortgage in 2022: $1,395 (2.0%)
Business Search- 14 Million verified businesses
Males: 1,104
(48.3%)
Females: 1,183
(51.7%)
For population 25 years and over in 12926:
High school or higher: 86.4%
Bachelor's degree or higher: 12.5%
Graduate or professional degree: 5.3%
Unemployed: 3.5%
Mean travel time to work (commute): 24.5 minutes
For population 15 years and over in 12926:
Never married: 20.4%
Now married: 59.6%
Separated: 3.6%
Widowed: 6.0%
Divorced: 10.4%
Zip code 12926 compared to state average:
Median house value significantly below state average.
Black race population percentage significantly below state average.
Hispanic race population percentage significantly below state average.
Foreign-born population percentage significantly below state average.
Renting percentage below state average.
Number of rooms per house above state average.
Number of college students below state average.
Percentage of population with a bachelor's degree or higher significantly below state average.
Averages for the 2020 tax year for zip code 12926, filed in 2021:
Average Adjusted Gross Income (AGI) in 2020: $47,030 (Individual Income Tax Returns)
Here:
$47,030
State:
$90,930
Salary/wage: $42,944 (reported on 81.1% of returns)
Here:
$42,944
State:
$72,104
(% of AGI for various income ranges: 1323.2% for AGIs below $25k, 3341.2% for AGIs $25k-50k, 5784.2% for AGIs $50k-75k, 8480.0% for AGIs $75k-100k, 15878.0% for AGIs $100k-200k)
Taxable interest for individuals: $538 (reported on 28.9% of returns)
This zip code:
$538
New York:
$3,075
(% of AGI for various income ranges: 16.8% for AGIs below $25k, 25.4% for AGIs $25k-50k, 16.7% for AGIs $50k-75k, 25.7% for AGIs $75k-100k, 18.0% for AGIs $100k-200k)
Ordinary dividends: $562 (reported on 8.9% of returns)
Here:
$562
State:
$11,095
(% of AGI for various income ranges: 6.8% for AGIs below $25k, 26.7% for AGIs $50k-75k)
Net capital gain/loss in AGI: +$4,750 (reported on 6.7% of returns)
Here:
+$4,750
State:
+$44,925
(% of AGI for various income ranges: 48.3% for AGIs $25k-50k, 140.8% for AGIs $50k-75k)
Profit/loss from business: +$4,390 (reported on 11.1% of returns)
Here:
+$4,390
State:
+$14,940
(% of AGI for various income ranges: 14.7% for AGIs below $25k, 75.8% for AGIs $25k-50k, 40.0% for AGIs $50k-75k, 258.6% for AGIs $75k-100k)
Taxable individual retirement arrangement distribution: $8,567 (reported on 6.7% of returns)
12926:
$8,567
New York:
$19,609
(% of AGI for various income ranges: 81.6% for AGIs below $25k, 299.2% for AGIs $50k-75k)
Earned income credit: $2,040 (reported on 16.7% of returns)
Here:
$2,040
State:
$2,138
(% of AGI for various income ranges: 82.1% for AGIs below $25k, 62.5% for AGIs $25k-50k)
Percentage of individuals using paid preparers for their 2020 taxes: 97.8%
Here:
98%
State:
95%
(% for various income ranges: 92.9% for AGIs below $25k, 100.0% for AGIs $25k-50k, 100.0% for AGIs $50k-75k, 100.0% for AGIs $75k-100k, 100.0% for AGIs $100k-200k)
Averages for the 2012 tax year for zip code 12926, filed in 2013:
Average Adjusted Gross Income (AGI) in 2012: $37,300 (Individual Income Tax Returns)
Here:
$37,300
State:
$77,088
Salary/wage: $36,350 (reported on 82.2% of returns)
Here:
$36,350
State:
$60,593
(% of AGI for various income ranges: 74.6% for AGIs below $25k, 77.8% for AGIs $25k-50k, 81.5% for AGIs $50k-75k, 79.4% for AGIs $75k-100k, 88.2% for AGIs $100k-200k)
Taxable interest for individuals: $661 (reported on 25.6% of returns)
This zip code:
$661
New York:
$3,125
(% of AGI for various income ranges: 1.3% for AGIs below $25k, 0.3% for AGIs $25k-50k, 0.2% for AGIs $50k-75k, 0.5% for AGIs $75k-100k, 0.1% for AGIs $100k-200k)
Ordinary dividends: $456 (reported on 10.0% of returns)
Here:
$456
State:
$10,299
(% of AGI for various income ranges: 0.3% for AGIs below $25k, 0.2% for AGIs $25k-50k)
Net capital gain/loss in AGI: +$2,983 (reported on 6.7% of returns)
Here:
+$2,983
State:
+$42,474
Profit/loss from business: +$2,608 (reported on 14.4% of returns)
Here:
+$2,608
State:
+$16,168
(% of AGI for various income ranges: 2.6% for AGIs below $25k, 1.3% for AGIs $25k-50k, 1.0% for AGIs $50k-75k)
Taxable individual retirement arrangement distribution: $6,443 (reported on 7.8% of returns)
12926:
$6,443
New York:
$17,621
Total itemized deductions: $14,808 (21% of AGI, reported on 14.4% of returns)
Here:
$14,808
State:
$34,985
Here:
21.4% of AGI
State:
21.3% of AGI
(% of AGI for various income ranges: 6.3% for AGIs $25k-50k, 6.1% for AGIs $50k-75k, 5.6% for AGIs $75k-100k, 10.0% for AGIs $100k-200k)
Charity contributions: $1,325 (reported on 8.9% of returns)
Here:
$1,325
State:
$5,572
(% of AGI for various income ranges: 0.4% for AGIs below $25k, 0.5% for AGIs $50k-75k, 0.8% for AGIs $100k-200k)
Taxes paid: $5,577 (reported on 14.4% of returns)
12926:
$5,577
State:
$18,656
(% of AGI for various income ranges: 1.2% for AGIs $25k-50k, 2.4% for AGIs $50k-75k, 2.6% for AGIs $75k-100k, 5.1% for AGIs $100k-200k)
Earned income credit: $2,157 (reported on 23.3% of returns)
Here:
$2,157
State:
$2,230
(% of AGI for various income ranges: 6.6% for AGIs below $25k, 1.1% for AGIs $25k-50k)
Percentage of individuals using paid preparers for their 2012 taxes: 60.0%
Here:
60%
State:
66%
(% for various income ranges: 52.5% for AGIs below $25k, 64.0% for AGIs $25k-50k, 69.2% for AGIs $50k-75k, 57.1% for AGIs $75k-100k, 80.0% for AGIs $100k-200k)
Averages for the 2004 tax year for zip code 12926, filed in 2005:
Average Adjusted Gross Income (AGI) in 2004: $29,690 (Individual Income Tax Returns)
Here:
$29,690
State:
$59,519
Salary/wage: $29,060 (reported on 84.5% of returns)
Here:
$29,060
State:
$50,673
(% of AGI for various income ranges: 126.1% for AGIs below $10k, 75.9% for AGIs $10k-25k, 83.8% for AGIs $25k-50k, 82.1% for AGIs $50k-75k, 82.1% for AGIs $75k-100k, 81.6% for AGIs over 100k)
Taxable interest for individuals: $638 (reported on 38.3% of returns)
This zip code:
$638
New York:
$2,377
(% of AGI for various income ranges: 4.2% for AGIs below $10k, 1.3% for AGIs $10k-25k, 0.9% for AGIs $25k-50k, 0.5% for AGIs $50k-75k, 0.2% for AGIs $75k-100k, 0.1% for AGIs over 100k)
Taxable dividends: $449 (reported on 11.6% of returns)
Here:
$449
State:
$5,394
(% of AGI for various income ranges: 0.9% for AGIs below $10k, 0.2% for AGIs $10k-25k, 0.1% for AGIs $25k-50k, 0.3% for AGIs $50k-75k, 0.2% for AGIs $75k-100k)
Net capital gain/loss: +$1,274 (reported on 8.7% of returns)
Here:
+$1,274
State:
+$23,581
(% of AGI for various income ranges: 0.2% for AGIs below $10k, 0.3% for AGIs $10k-25k, 0.4% for AGIs $25k-50k, 0.7% for AGIs $50k-75k)
Profit/loss from business: +$2,465 (reported on 15.1% of returns)
Here:
+$2,465
State:
+$13,809
(% of AGI for various income ranges: -1.9% for AGIs below $10k, 1.9% for AGIs $10k-25k, 2.4% for AGIs $25k-50k, 0.6% for AGIs $50k-75k)
Profit/loss from farming: +$278 (reported on 4.3% of returns)
Here:
+$278
State:
-$2,666
IRA payment deduction: $2,167 (reported on 1.4% of returns)
12926:
$2,167
New York:
$3,115
Total itemized deductions: $14,697 (23% of AGI, reported on 12.9% of returns)
Here:
$14,697
State:
$25,864
Here:
23.5% of AGI
State:
21.9% of AGI
(% of AGI for various income ranges: 3.4% for AGIs $10k-25k, 3.8% for AGIs $25k-50k, 9.2% for AGIs $50k-75k, 9.1% for AGIs $75k-100k, 14.1% for AGIs over 100k)
Charity contributions deductions: $1,642 (3% of AGI, reported on 11.3% of returns)
Here:
$1,642
State:
$4,439
Here:
2.5% of AGI
State:
3.6% of AGI
(% of AGI for various income ranges: 0.4% for AGIs $25k-50k, 1.3% for AGIs $50k-75k, 0.7% for AGIs $75k-100k, 1.2% for AGIs over 100k)
Total tax: $3,212 (reported on 68.7% of returns)
12926:
$3,212
State:
$11,730
(% of AGI for various income ranges: 3.1% for AGIs below $10k, 3.6% for AGIs $10k-25k, 6.4% for AGIs $25k-50k, 8.3% for AGIs $50k-75k, 10.6% for AGIs $75k-100k, 14.5% for AGIs over 100k)
Earned income credit: $1,670 (reported on 24.1% of returns)
Here:
$1,670
State:
$1,757
Percentage of individuals using paid preparers for their 2004 taxes: 69.0%
Here:
69%
State:
67%
(% for various income ranges: 59.1% for AGIs below $10k, 66.4% for AGIs $10k-25k, 74.2% for AGIs $25k-50k, 76.3% for AGIs $50k-75k, 82.2% for AGIs $75k-100k, 71.4% for AGIs over 100k)
Household received Food Stamps/SNAP in the past 12 months: 210 Household did not receive Food Stamps/SNAP in the past 12 months: 823
Women who had a birth in the past 12 months: 47 (39 now married, 8 unmarried) Women who did not have a birth in the past 12 months: 469 (251 now married, 214 unmarried)
Housing units in zip code 12926 with a mortgage: 464 (49 second mortgage, 46 both second mortgage and home equity loan) Houses without a mortgage: 10
Median monthly owner costs for units with a mortgage: $1,181 Median monthly owner costs for units without a mortgage: $426
Residents with income below the poverty level in 2022:
This zip code:
16.5%
Whole state:
14.3%
Residents with income below 50% of the poverty level in 2022:
This zip code:
6.5%
Whole state:
6.8%
Median number of rooms in houses and condos:
Here:
6.5
State:
6.3
Median number of rooms in apartments:
Here:
4.8
State:
3.8
Notable locations in this zip code not listed on our city pages
Notable locations in zip code 12926: Pine Ridge Park Campsite (A), Trout River Port of Entry (B), Westville Volunteer Fire Association (C), Constable Volunteer Firemen (D). Display/hide their locations on the map
Cemeteries: Riverside Cemetery (1), Briggs Street Cemetery (2), Saint Francis of Assisi Cemetery (3), Saint Bridget's Roman Catholic Cemetery (4), Pine Grove Cemetery (5), United Methodist Cemetery (6). Display/hide their locations on the map
304 married couples with children.
114 single-parent households (50 men, 64 women).
97.3% of residents of 12926 zip code speak English at home.
0.1% of residents speak Spanish at home (100% very well).
1.9% of residents speak other Indo-European language at home (77% very well, 23% well).
0.1% of residents speak Asian or Pacific Island language at home (100% very well).
0.4% of residents speak other language at home (50% very well, 50% not well).
Foreign born population: 47 (2.1%) (35.9% of them are naturalized citizens)
This zip code:
2.1%
Whole state:
22.7%
8%Ecuador
14%American
14%French
13%English
11%French Canadian
9%Italian
7%Irish
5%Dutch
Year of entry for the foreign-born population
82010 or later
72000 to 2009
81990 to 1999
31Before 1990
Facilities with environmental interests located in this zip code:
FRANKLIN COUNTY REGIONAL LANDFILL (828 CR 20 in CONSTABLE, NY)
CRITERIA AND HAZARDOUS AIR POLLUTANT INVENTORY (Inventory of air pollution sources) Business SIC classification: REFUSE SYSTEMS Business NAICS classification: SOLID WASTE LANDFILL.
BARRETT PAVING WESTVILLE PLANT (FERRIS RD in WESTVILLE CENTER, NY)
AIR SYNTHETIC MINOR (AIRS/AFS) Business SIC classification: ASPHALT PAVING MIXTURES AND BLOCKS
Housing units lacking complete plumbing facilities: 4.5% Housing units lacking complete kitchen facilities: 1.2%
50.0%Fuel oil, kerosene, etc.
21.2%Wood
15.8%Bottled, tank, or LP gas
6.8%Electricity
4.6%Utility gas
1.1%Other fuel
0.7%No fuel used
Population in 1990: 1,949. Population change in the 1990s: +134 (+6.9%).
Place of birth for U.S.-born residents:
This state: 1,789
Northeast: 296
Midwest: 66
South: 56
West: 16
69% of the 12926 zip code residents lived in the same house 5 years ago. Out of people who lived in different houses, 80% lived in this county. Out of people who lived in different counties, 50% lived in New York.
90% of the 12926 zip code residents lived in the same house 1 year ago. Out of people who lived in different houses, 52% moved from this county. Out of people who lived in different houses, 35% moved from different county within same state. Out of people who lived in different houses, 11% moved from different state.
Private vs. public school enrollment:
Students in private schools in grades 1 to 8 (elementary and middle school): 19
Here:
10.0%
New York:
15.6%
Students in private schools in grades 9 to 12 (high school):
Here:
0.0%
New York:
15.0%
Students in private undergraduate colleges: 12
Here:
20.1%
New York:
39.2%
Occupation by median earnings in the past 12 months ($)
102,216Health diagnosing and treating practitioners and other technical occupations
66,306Law enforcement workers including supervisors
66,171Life, physical, and social science occupations
53,122Installation, maintenance, and repair occupations
52,398Construction and extraction occupations
52,283Education, training, and library occupations
Companies with federal contracts located in this zip code:
STEVEN COOK (10 RIVERSIDE DR in CONSTABLE, NY; small business) 2 employees, $110000 revenue.
$3,000 with Public Buildings Service for Maintenance, Repair or Alteration of Real Property -- Office Buildings. Signed on 1999-11-15. Completion date: 1999-12-15.
Top industries in this zip code by the number of employees in 2005:
Other Services (except Public Administration): Religious Organizations (20-49 employees: 1 establishment, 1-4 employees: 1 establishment)
Accommodation and Food Services: Full-Service Restaurants (10-19: 1, 1-4: 1)
Real Estate and Rental and Leasing: Lessors of Residential Buildings and Dwellings (5-9: 1)
Accommodation and Food Services: Drinking Places (Alcoholic Beverages) (1-4: 2)
Other Services (except Public Administration): Automotive Body, Paint, and Interior Repair and Maintenance (1-4: 2)
Wholesale Trade: Tobacco and Tobacco Product Merchant Wholesalers (1-4: 1)
Information: Periodical Publishers (1-4: 1)
Wholesale Trade: Wholesale Trade Agents and Brokers (1-4: 1)
People in group quarters in 2010:
10 people in emergency and transitional shelters (with sleeping facilities) for people experiencing homelessness
People in group quarters in 2000:
6 people in homes for the mentally retarded
Fatal accident statistics in 2014:
Fatal accident count: 1
Vehicles involved in fatal accidents: 2
Fatal accidents caused by drunken drivers: 0
Fatalities: 1
Persons involved in fatal accidents: 4
Pedestrians involved in fatal accidents: 0
2002 - 2018 National Fire Incident Reporting System (NFIRS) incidents
Based on the data from the years 2002 - 2018 the average number of fires per year is 15. The highest number of reported fire incidents - 42 took place in 2007, and the least - 1 in 2010. The data has a growing trend.
When looking into fire subcategories, the most reports belonged to: Structure Fires (59.1%), and Outside Fires (28.4%).
Fire incident types reported to NFIRS in Zip Code 12926


+$278
-$2,666
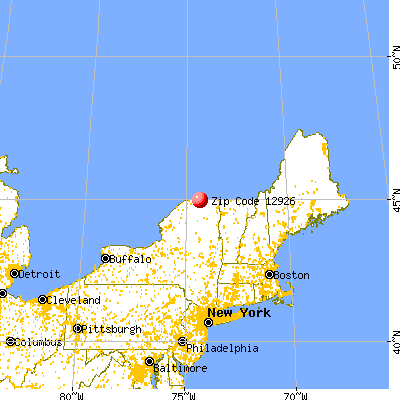
 Nearest zip codes: 12937, 12917, 12966, 12953, 12916, 12957.


 Based on the data from the years 2002 - 2018 the average number of fires per year is 15. The highest number of reported fire incidents - 42 took place in 2007, and the least - 1 in 2010. The data has a growing trend.
 When looking into fire subcategories, the most reports belonged to: Structure Fires (59.1%), and Outside Fires (28.4%).