Estimated zip code population in 2022: 617 Zip code population in 2010: 1,040 Zip code population in 2000: 930
Houses and condos: 582 Renter-occupied apartments: 28
% of renters here:
10%
State:
46%
March 2022 cost of living index in zip code 13061: 94.2 (less than average, U.S. average is 100)
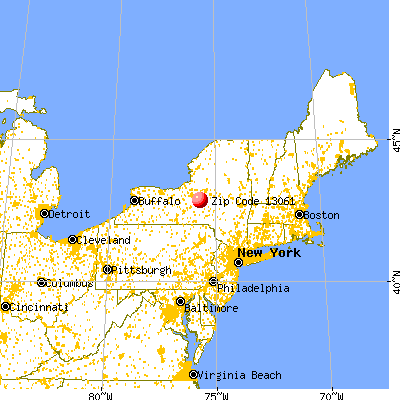
Land area: 26.0 sq. mi. Water area: 1.0 sq. mi.
Population density: 24 people per square mile
(very low).
OSM Map
General Map
Google Map
MSN Map
OSM Map
General Map
Google Map
MSN Map
OSM Map
General Map
Google Map
MSN Map
OSM Map
General Map
Google Map
MSN Map
Please wait while loading the map...
Real estate property taxes paid for housing units in 2022:
This zip code:
1.5% ($3,344)
New York:
1.5% ($6,180)
Median real estate property taxes paid for housing units with mortgages in 2022: $4,510 (1.8%) Median real estate property taxes paid for housing units with no mortgage in 2022: $2,335 (1.2%)
Business Search- 14 Million verified businesses
Males: 313
(50.7%)
Females: 304
(49.3%)
For population 25 years and over in 13061:
High school or higher: 96.4%
Bachelor's degree or higher: 35.6%
Graduate or professional degree: 19.4%
Unemployed: 1.0%
Mean travel time to work (commute): 24.4 minutes
For population 15 years and over in 13061:
Never married: 18.3%
Now married: 60.6%
Separated: 2.0%
Widowed: 3.6%
Divorced: 15.5%
Zip code 13061 compared to state average:
Median house value below state average.
Unemployed percentage significantly below state average.
Black race population percentage below state average.
Hispanic race population percentage significantly below state average.
Median age significantly above state average.
Foreign-born population percentage significantly below state average.
Renting percentage significantly below state average.
Estimated median house/condo value in 2022: $220,580
13061:
$220,580
New York:
$400,400
According to our research of New York and other state lists, there was 1 registered sex offender living in 13061 zip code as of May 28, 2024. The ratio of all residents to sex offenders in zip code 13061 is 1,116 to 1. The ratio of registered sex offenders to all residents in this zip code is near the state average.
Median resident age:
This zip code:
54.7 years
New York median age:
40.0 years
Average household size:
This zip code:
2.1 people
New York:
2.5 people
Averages for the 2020 tax year for zip code 13061, filed in 2021:
Average Adjusted Gross Income (AGI) in 2020: $96,719 (Individual Income Tax Returns)
Here:
$96,719
State:
$90,930
Salary/wage: $60,646 (reported on 78.8% of returns)
Here:
$60,646
State:
$72,104
(% of AGI for various income ranges: 1194.3% for AGIs below $25k, 3618.9% for AGIs $25k-50k, 5607.5% for AGIs $50k-75k, 8672.5% for AGIs $75k-100k, 21361.7% for AGIs $100k-200k)
Taxable interest for individuals: $1,605 (reported on 38.5% of returns)
This zip code:
$1,605
New York:
$3,075
(% of AGI for various income ranges: 4.3% for AGIs below $25k, 7.8% for AGIs $25k-50k, 58.8% for AGIs $50k-75k, 22.5% for AGIs $75k-100k, 425.0% for AGIs $100k-200k)
Ordinary dividends: $3,707 (reported on 26.9% of returns)
Here:
$3,707
State:
$11,095
(% of AGI for various income ranges: 48.6% for AGIs below $25k, 42.2% for AGIs $25k-50k, 112.5% for AGIs $50k-75k, 595.0% for AGIs $100k-200k)
Net capital gain/loss in AGI: +$6,633 (reported on 23.1% of returns)
Here:
+$6,633
State:
+$44,925
(% of AGI for various income ranges: 12.2% for AGIs $25k-50k, 140.0% for AGIs $50k-75k, 1121.7% for AGIs $100k-200k)
Profit/loss from business: +$20,870 (reported on 19.2% of returns)
Here:
+$20,870
State:
+$14,940
(% of AGI for various income ranges: 393.3% for AGIs $25k-50k, 408.8% for AGIs $50k-75k, 2343.3% for AGIs $100k-200k)
Taxable individual retirement arrangement distribution: $14,817 (reported on 11.5% of returns)
13061:
$14,817
New York:
$19,609
(% of AGI for various income ranges: 152.9% for AGIs below $25k, 350.0% for AGIs $50k-75k, 836.7% for AGIs $100k-200k)
Total itemized deductions: $21,633 (reported on 5.8% of returns)
Here:
$21,633
State:
$39,326
(% of AGI for various income ranges: 811.3% for AGIs $50k-75k)
Taxes paid: $8,000 (reported on 5.8% of returns)
13061:
$8,000
State:
$9,183
(% of AGI for various income ranges: 300.0% for AGIs $50k-75k)
Earned income credit: $1,667 (reported on 11.5% of returns)
Here:
$1,667
State:
$2,138
(% of AGI for various income ranges: 67.1% for AGIs below $25k, 58.9% for AGIs $25k-50k)
Percentage of individuals using paid preparers for their 2020 taxes: 94.2%
Here:
94%
State:
95%
(% for various income ranges: 91.7% for AGIs below $25k, 100.0% for AGIs $25k-50k, 90.0% for AGIs $50k-75k, 100.0% for AGIs $75k-100k, 90.0% for AGIs $100k-200k, 100.0% for AGIs over 200k)
Averages for the 2012 tax year for zip code 13061, filed in 2013:
Average Adjusted Gross Income (AGI) in 2012: $50,606 (Individual Income Tax Returns)
Here:
$50,606
State:
$77,088
Salary/wage: $45,632 (reported on 78.8% of returns)
Here:
$45,632
State:
$60,593
(% of AGI for various income ranges: 73.1% for AGIs below $25k, 71.9% for AGIs $25k-50k, 70.9% for AGIs $50k-75k, 74.8% for AGIs $75k-100k, 68.5% for AGIs $100k-200k)
Taxable interest for individuals: $320 (reported on 38.5% of returns)
This zip code:
$320
New York:
$3,125
(% of AGI for various income ranges: 0.7% for AGIs below $25k, 0.2% for AGIs $25k-50k, 0.4% for AGIs $50k-75k, 0.2% for AGIs $75k-100k)
Ordinary dividends: $2,500 (reported on 25.0% of returns)
Here:
$2,500
State:
$10,299
(% of AGI for various income ranges: 2.0% for AGIs below $25k, 1.0% for AGIs $25k-50k, 1.5% for AGIs $50k-75k, 1.7% for AGIs $100k-200k)
Net capital gain/loss in AGI: +$4,286 (reported on 13.5% of returns)
Here:
+$4,286
State:
+$42,474
(% of AGI for various income ranges: 0.6% for AGIs $50k-75k, 3.0% for AGIs $100k-200k)
Profit/loss from business: +$9,940 (reported on 19.2% of returns)
Here:
+$9,940
State:
+$16,168
(% of AGI for various income ranges: 4.1% for AGIs below $25k, 10.0% for AGIs $25k-50k, 3.6% for AGIs $50k-75k, 5.9% for AGIs $75k-100k)
Taxable individual retirement arrangement distribution: $11,350 (reported on 11.5% of returns)
13061:
$11,350
New York:
$17,621
Total itemized deductions: $20,812 (23% of AGI, reported on 32.7% of returns)
Here:
$20,812
State:
$34,985
Here:
22.5% of AGI
State:
21.3% of AGI
(% of AGI for various income ranges: 14.7% for AGIs $25k-50k, 13.3% for AGIs $50k-75k, 14.6% for AGIs $75k-100k, 15.5% for AGIs $100k-200k)
Charity contributions: $1,543 (reported on 26.9% of returns)
Here:
$1,543
State:
$5,572
(% of AGI for various income ranges: 0.6% for AGIs below $25k, 0.7% for AGIs $50k-75k, 0.6% for AGIs $75k-100k, 1.4% for AGIs $100k-200k)
Taxes paid: $9,565 (reported on 32.7% of returns)
13061:
$9,565
State:
$18,656
(% of AGI for various income ranges: 5.0% for AGIs $25k-50k, 5.8% for AGIs $50k-75k, 5.6% for AGIs $75k-100k, 8.6% for AGIs $100k-200k)
Earned income credit: $1,933 (reported on 11.5% of returns)
Here:
$1,933
State:
$2,230
(% of AGI for various income ranges: 5.2% for AGIs below $25k)
Percentage of individuals using paid preparers for their 2012 taxes: 59.6%
Here:
60%
State:
66%
(% for various income ranges: 55.6% for AGIs below $25k, 58.3% for AGIs $25k-50k, 66.7% for AGIs $50k-75k, 66.7% for AGIs $75k-100k, 57.1% for AGIs $100k-200k)
Averages for the 2004 tax year for zip code 13061, filed in 2005:
Average Adjusted Gross Income (AGI) in 2004: $42,303 (Individual Income Tax Returns)
Here:
$42,303
State:
$59,519
Salary/wage: $37,912 (reported on 84.3% of returns)
Here:
$37,912
State:
$50,673
(% of AGI for various income ranges: 91.6% for AGIs below $10k, 67.9% for AGIs $10k-25k, 78.6% for AGIs $25k-50k, 83.4% for AGIs $50k-75k, 75.9% for AGIs $75k-100k, 66.5% for AGIs over 100k)
Taxable interest for individuals: $628 (reported on 50.9% of returns)
This zip code:
$628
New York:
$2,377
(% of AGI for various income ranges: 5.4% for AGIs below $10k, 2.0% for AGIs $10k-25k, 0.5% for AGIs $25k-50k, 0.2% for AGIs $50k-75k, 1.3% for AGIs $75k-100k, 0.3% for AGIs over 100k)
Taxable dividends: $920 (reported on 28.2% of returns)
Here:
$920
State:
$5,394
(% of AGI for various income ranges: 8.4% for AGIs below $10k, 0.7% for AGIs $10k-25k, 0.7% for AGIs $25k-50k, 0.2% for AGIs $50k-75k, 0.3% for AGIs $75k-100k, 0.6% for AGIs over 100k)
Net capital gain/loss: +$585 (reported on 19.4% of returns)
Here:
+$585
State:
+$23,581
(% of AGI for various income ranges: 0.5% for AGIs below $10k, -0.6% for AGIs $10k-25k, 0.4% for AGIs $25k-50k, 0.0% for AGIs $50k-75k, -0.3% for AGIs $75k-100k, 1.2% for AGIs over 100k)
Profit/loss from business: +$8,916 (reported on 19.6% of returns)
Here:
+$8,916
State:
+$13,809
(% of AGI for various income ranges: 11.7% for AGIs below $10k, 13.7% for AGIs $10k-25k, 6.6% for AGIs $25k-50k, 2.3% for AGIs $50k-75k, 4.1% for AGIs $75k-100k)
IRA payment deduction: $2,000 (reported on 3.1% of returns)
13061:
$2,000
New York:
$3,115
Total itemized deductions: $16,477 (22% of AGI, reported on 30.7% of returns)
Here:
$16,477
State:
$25,864
Here:
21.7% of AGI
State:
21.9% of AGI
(% of AGI for various income ranges: 10.8% for AGIs $25k-50k, 15.0% for AGIs $50k-75k, 13.6% for AGIs $75k-100k, 13.6% for AGIs over 100k)
Charity contributions deductions: $1,586 (2% of AGI, reported on 27.4% of returns)
Here:
$1,586
State:
$4,439
Here:
2.1% of AGI
State:
3.6% of AGI
(% of AGI for various income ranges: 0.9% for AGIs $25k-50k, 0.7% for AGIs $50k-75k, 1.7% for AGIs $75k-100k, 1.4% for AGIs over 100k)
Total tax: $5,126 (reported on 78.6% of returns)
13061:
$5,126
State:
$11,730
(% of AGI for various income ranges: 3.8% for AGIs below $10k, 5.8% for AGIs $10k-25k, 7.1% for AGIs $25k-50k, 8.6% for AGIs $50k-75k, 10.2% for AGIs $75k-100k, 13.6% for AGIs over 100k)
Earned income credit: $1,203 (reported on 13.2% of returns)
Here:
$1,203
State:
$1,757
Percentage of individuals using paid preparers for their 2004 taxes: 66.0%
Here:
66%
State:
67%
(% for various income ranges: 58.6% for AGIs below $10k, 69.8% for AGIs $10k-25k, 68.8% for AGIs $25k-50k, 68.7% for AGIs $50k-75k, 58.3% for AGIs $75k-100k, 74.3% for AGIs over 100k)
Household received Food Stamps/SNAP in the past 12 months: 18 Household did not receive Food Stamps/SNAP in the past 12 months: 271
Women who had a birth in the past 12 months: 8 (8 now married, 0 unmarried) Women who did not have a birth in the past 12 months: 89 (52 now married, 35 unmarried)
Housing units in zip code 13061 with a mortgage: 145 (32 second mortgage, 8 home equity loan, 25 both second mortgage and home equity loan) Houses without a mortgage: 7
Median monthly owner costs for units with a mortgage: $1,760 Median monthly owner costs for units without a mortgage: $529
Residents with income below the poverty level in 2022:
This zip code:
11.0%
Whole state:
14.3%
Residents with income below 50% of the poverty level in 2022:
This zip code:
3.7%
Whole state:
6.8%
Median number of rooms in houses and condos:
Here:
6.3
State:
6.3
Median number of rooms in apartments:
Here:
5.2
State:
3.8
Notable locations in this zip code not listed on our city pages
Size of family households: 130 2-persons, 1 3-persons, 34 4-persons, 8 5-persons
Size of nonfamily households: 84 1-person, 31 2-persons, 4 3-persons
54 married couples with children.
11 single-parent households (9 men, 2 women).
99.7% of residents of 13061 zip code speak English at home.
0.8% of residents speak Spanish at home (100% very well).
Foreign born population: 17 (2.8%) (0.0% of them are naturalized citizens)
:
2.8%
Whole state:
22.7%
141%Congo
20%American
17%Irish
13%German
11%English
10%Italian
7%European
6%African
Year of entry for the foreign-born population
202010 or later
02000 to 2009
01990 to 1999
0Before 1990
Facilities with environmental interests located in this zip code:
FOTOCUT (7 ERIEVILLE ROAD in ERIEVILLE, NY)
AIR MINOR (AIRS/AFS) National Pollutant Discharge Elimination System NON-MAJOR (Tracking pollutant discharge elimination systems) - permit (Resource Conservation and Recovery Act (tracking hazardous waste)) Business SIC classification: PHOTOFINISHING LABORATORIES
Housing units lacking complete plumbing facilities: 5.6%
33.6%Bottled, tank, or LP gas
33.6%Fuel oil, kerosene, etc.
16.8%Wood
10.2%Electricity
4.9%Coal or coke
1.4%Other fuel
Population in 1990: 1,100.
Place of birth for U.S.-born residents:
This state: 506
Northeast: 51
Midwest: 13
South: 19
West: 7
73% of the 13061 zip code residents lived in the same house 5 years ago. Out of people who lived in different houses, 57% lived in this county. Out of people who lived in different counties, 50% lived in New York.
93% of the 13061 zip code residents lived in the same house 1 year ago. Out of people who lived in different houses, 43% moved from this county. Out of people who lived in different houses, 29% moved from different county within same state. Out of people who lived in different houses, 26% moved from different state.
Private vs. public school enrollment:
Students in private schools in grades 1 to 8 (elementary and middle school):
Here:
0.0%
New York:
15.6%
Students in private schools in grades 9 to 12 (high school):
Here:
0.0%
New York:
15.0%
Students in private undergraduate colleges:
Here:
0.0%
New York:
39.2%
Occupation by median earnings in the past 12 months ($)
138,113Health diagnosing and treating practitioners and other technical occupations
90,610Management occupations
67,739Construction and extraction occupations
48,531Health technologists and technicians
44,859Installation, maintenance, and repair occupations
42,481Production occupations
Top industries in this zip code by the number of employees in 2005:
Arts, Entertainment, and Recreation: Fitness and Recreational Sports Centers (20-49 employees: 1 establishment)
Professional, Scientific, and Technical Services: Administrative Management and General Management Consulting Services (10-19: 1)
Other Services (except Public Administration): Civic and Social Organizations (10-19: 1)
Wholesale Trade: Electrical Apparatus and Equipment, Wiring Supplies, and Related Equipment Merchant Wholesalers (10-19: 1)
Accommodation and Food Services: Full-Service Restaurants (10-19: 1)
Professional, Scientific, and Technical Services: Engineering Services (5-9: 1)
Administrative and Support and Waste Management and Remediation Services: Solid Waste Collection (1-4: 2)
Construction: New Single-Family Housing Construction (except Operative Builders) (1-4: 1)
Professional, Scientific, and Technical Services: Veterinary Services (1-4: 1)
Fatal accident statistics in 2011:
Fatal accident count: 1
Vehicles involved in fatal accidents: 1
Fatal accidents caused by drunken drivers: 0
Fatalities: 1
Persons involved in fatal accidents: 2
Pedestrians involved in fatal accidents: 0
Home Mortgage Disclosure Act Aggregated Statistics For Year 2009 (Based on 2 partial tracts)
A) FHA, FSA/RHS & VA Home Purchase Loans
B) Conventional Home Purchase Loans
C) Refinancings
D) Home Improvement Loans
F) Non-occupant Loans on < 5 Family Dwellings (A B C & D)
G) Loans On Manufactured Home Dwelling (A B C & D)
Number
Average Value
Number
Average Value
Number
Average Value
Number
Average Value
Number
Average Value
Number
Average Value
LOANS ORIGINATED
5
$111,632
11
$127,801
42
$109,823
11
$42,235
4
$146,370
2
$69,945
APPLICATIONS APPROVED, NOT ACCEPTED
0
$0
0
$0
3
$96,653
1
$101,900
0
$0
0
$0
APPLICATIONS DENIED
0
$0
2
$58,365
13
$146,478
2
$5,790
1
$84,770
1
$88,010
APPLICATIONS WITHDRAWN
0
$0
0
$0
9
$137,159
1
$18,530
0
$0
0
$0
FILES CLOSED FOR INCOMPLETENESS
0
$0
0
$0
1
$144,520
0
$0
0
$0
0
$0
Aggregated Statistics For Year 2008 (Based on 2 partial tracts)
A) FHA, FSA/RHS & VA Home Purchase Loans
B) Conventional Home Purchase Loans
C) Refinancings
D) Home Improvement Loans
F) Non-occupant Loans on < 5 Family Dwellings (A B C & D)
G) Loans On Manufactured Home Dwelling (A B C & D)
Number
Average Value
Number
Average Value
Number
Average Value
Number
Average Value
Number
Average Value
Number
Average Value
LOANS ORIGINATED
4
$128,190
15
$113,361
27
$89,809
9
$48,739
7
$99,191
2
$88,240
APPLICATIONS APPROVED, NOT ACCEPTED
1
$91,710
2
$73,415
2
$151,005
2
$9,495
1
$198,710
2
$68,320
APPLICATIONS DENIED
1
$82,450
3
$146,527
20
$103,224
18
$20,072
1
$49,560
4
$46,552
APPLICATIONS WITHDRAWN
0
$0
1
$133,400
9
$106,536
2
$65,080
1
$76,430
2
$103,990
FILES CLOSED FOR INCOMPLETENESS
0
$0
1
$85,690
1
$183,430
0
$0
0
$0
0
$0
Aggregated Statistics For Year 2007 (Based on 2 partial tracts)
A) FHA, FSA/RHS & VA Home Purchase Loans
B) Conventional Home Purchase Loans
C) Refinancings
D) Home Improvement Loans
F) Non-occupant Loans on < 5 Family Dwellings (A B C & D)
G) Loans On Manufactured Home Dwelling (A B C & D)
Number
Average Value
Number
Average Value
Number
Average Value
Number
Average Value
Number
Average Value
Number
Average Value
LOANS ORIGINATED
4
$82,680
20
$112,094
33
$96,626
16
$56,250
5
$104,034
6
$45,548
APPLICATIONS APPROVED, NOT ACCEPTED
0
$0
3
$54,967
13
$113,199
2
$49,560
0
$0
1
$48,640
APPLICATIONS DENIED
0
$0
11
$68,175
33
$111,842
20
$48,219
1
$53,730
9
$69,326
APPLICATIONS WITHDRAWN
1
$100,050
3
$65,003
13
$134,898
4
$54,658
0
$0
0
$0
FILES CLOSED FOR INCOMPLETENESS
0
$0
1
$69,480
1
$233,450
0
$0
0
$0
0
$0
Aggregated Statistics For Year 2006 (Based on 2 partial tracts)
A) FHA, FSA/RHS & VA Home Purchase Loans
B) Conventional Home Purchase Loans
C) Refinancings
D) Home Improvement Loans
F) Non-occupant Loans on < 5 Family Dwellings (A B C & D)
G) Loans On Manufactured Home Dwelling (A B C & D)
Number
Average Value
Number
Average Value
Number
Average Value
Number
Average Value
Number
Average Value
Number
Average Value
LOANS ORIGINATED
4
$108,390
27
$105,781
36
$96,822
18
$42,408
8
$104,451
6
$42,073
APPLICATIONS APPROVED, NOT ACCEPTED
0
$0
4
$86,735
5
$159,526
3
$11,733
0
$0
1
$75,960
APPLICATIONS DENIED
0
$0
11
$98,830
32
$98,054
20
$23,832
2
$95,190
7
$49,231
APPLICATIONS WITHDRAWN
0
$0
6
$89,938
23
$96,346
3
$75,657
2
$109,085
2
$65,080
FILES CLOSED FOR INCOMPLETENESS
0
$0
2
$111,400
4
$152,045
0
$0
0
$0
0
$0
Aggregated Statistics For Year 2005 (Based on 2 partial tracts)
A) FHA, FSA/RHS & VA Home Purchase Loans
B) Conventional Home Purchase Loans
C) Refinancings
D) Home Improvement Loans
F) Non-occupant Loans on < 5 Family Dwellings (A B C & D)
G) Loans On Manufactured Home Dwelling (A B C & D)
Number
Average Value
Number
Average Value
Number
Average Value
Number
Average Value
Number
Average Value
Number
Average Value
LOANS ORIGINATED
3
$84,457
27
$115,611
42
$87,214
18
$35,152
6
$110,318
6
$58,132
APPLICATIONS APPROVED, NOT ACCEPTED
0
$0
2
$81,290
9
$94,184
2
$33,120
1
$43,540
0
$0
APPLICATIONS DENIED
1
$87,080
9
$72,928
27
$95,110
19
$24,233
1
$13,900
9
$43,438
APPLICATIONS WITHDRAWN
2
$95,880
5
$81,430
27
$103,414
3
$74,420
0
$0
2
$44,005
FILES CLOSED FOR INCOMPLETENESS
0
$0
0
$0
5
$144,056
0
$0
0
$0
0
$0
Aggregated Statistics For Year 2004 (Based on 2 partial tracts)
A) FHA, FSA/RHS & VA Home Purchase Loans
B) Conventional Home Purchase Loans
C) Refinancings
D) Home Improvement Loans
F) Non-occupant Loans on < 5 Family Dwellings (A B C & D)
G) Loans On Manufactured Home Dwelling (A B C & D)
Number
Average Value
Number
Average Value
Number
Average Value
Number
Average Value
Number
Average Value
Number
Average Value
LOANS ORIGINATED
1
$75,500
30
$103,896
38
$85,473
19
$22,380
8
$110,126
5
$47,894
APPLICATIONS APPROVED, NOT ACCEPTED
0
$0
1
$81,060
2
$53,270
4
$21,655
0
$0
0
$0
APPLICATIONS DENIED
0
$0
6
$76,428
29
$96,042
11
$25,813
1
$79,670
3
$53,267
APPLICATIONS WITHDRAWN
0
$0
1
$42,150
22
$73,838
2
$14,130
0
$0
1
$44,000
FILES CLOSED FOR INCOMPLETENESS
1
$113,480
1
$128,770
7
$113,683
1
$67,160
0
$0
0
$0
Aggregated Statistics For Year 2003 (Based on 2 partial tracts)
A) FHA, FSA/RHS & VA Home Purchase Loans
B) Conventional Home Purchase Loans
C) Refinancings
D) Home Improvement Loans
E) Loans on Dwellings For 5+ Families
F) Non-occupant Loans on < 5 Family Dwellings (A B C & D)
Number
Average Value
Number
Average Value
Number
Average Value
Number
Average Value
Number
Average Value
Number
Average Value
LOANS ORIGINATED
5
$70,776
24
$86,406
65
$87,481
7
$11,844
1
$118,580
7
$131,284
APPLICATIONS APPROVED, NOT ACCEPTED
0
$0
3
$71,023
7
$85,294
1
$9,260
0
$0
1
$17,600
APPLICATIONS DENIED
0
$0
4
$70,870
31
$80,821
8
$15,344
0
$0
1
$63,000
APPLICATIONS WITHDRAWN
0
$0
2
$63,225
22
$90,619
2
$24,550
0
$0
0
$0
FILES CLOSED FOR INCOMPLETENESS
0
$0
0
$0
4
$65,427
0
$0
0
$0
0
$0
Aggregated Statistics For Year 2002 (Based on 2 partial tracts)
A) FHA, FSA/RHS & VA Home Purchase Loans
B) Conventional Home Purchase Loans
C) Refinancings
D) Home Improvement Loans
F) Non-occupant Loans on < 5 Family Dwellings (A B C & D)
Number
Average Value
Number
Average Value
Number
Average Value
Number
Average Value
Number
Average Value
LOANS ORIGINATED
4
$84,188
20
$68,623
42
$81,236
12
$18,644
4
$43,425
APPLICATIONS APPROVED, NOT ACCEPTED
0
$0
5
$56,418
6
$85,538
2
$8,340
0
$0
APPLICATIONS DENIED
0
$0
4
$59,638
26
$83,002
8
$12,506
1
$46,320
APPLICATIONS WITHDRAWN
0
$0
2
$37,290
27
$73,083
2
$28,025
0
$0
FILES CLOSED FOR INCOMPLETENESS
0
$0
1
$37,060
2
$69,480
0
$0
0
$0
Aggregated Statistics For Year 2001 (Based on 2 partial tracts)
A) FHA, FSA/RHS & VA Home Purchase Loans
B) Conventional Home Purchase Loans
C) Refinancings
D) Home Improvement Loans
F) Non-occupant Loans on < 5 Family Dwellings (A B C & D)
Number
Average Value
Number
Average Value
Number
Average Value
Number
Average Value
Number
Average Value
LOANS ORIGINATED
7
$83,839
25
$71,833
36
$72,156
18
$14,102
3
$54,193
APPLICATIONS APPROVED, NOT ACCEPTED
0
$0
6
$62,610
6
$73,417
3
$22,543
0
$0
APPLICATIONS DENIED
0
$0
9
$59,650
20
$53,476
8
$11,406
0
$0
APPLICATIONS WITHDRAWN
0
$0
2
$33,120
16
$62,851
6
$18,760
0
$0
FILES CLOSED FOR INCOMPLETENESS
0
$0
0
$0
2
$59,985
0
$0
0
$0
Aggregated Statistics For Year 2000 (Based on 2 partial tracts)
A) FHA, FSA/RHS & VA Home Purchase Loans
B) Conventional Home Purchase Loans
C) Refinancings
D) Home Improvement Loans
F) Non-occupant Loans on < 5 Family Dwellings (A B C & D)
Number
Average Value
Number
Average Value
Number
Average Value
Number
Average Value
Number
Average Value
LOANS ORIGINATED
5
$70,500
24
$69,306
16
$56,481
16
$15,199
3
$68,707
APPLICATIONS APPROVED, NOT ACCEPTED
0
$0
8
$74,980
4
$69,942
4
$24,898
0
$0
APPLICATIONS DENIED
0
$0
12
$54,851
23
$48,314
9
$13,793
0
$0
APPLICATIONS WITHDRAWN
0
$0
3
$42,770
11
$46,994
2
$11,810
0
$0
FILES CLOSED FOR INCOMPLETENESS
0
$0
0
$0
1
$75,040
0
$0
0
$0
Aggregated Statistics For Year 1999 (Based on 1 partial tract)
A) FHA, FSA/RHS & VA Home Purchase Loans
B) Conventional Home Purchase Loans
C) Refinancings
D) Home Improvement Loans
F) Non-occupant Loans on < 5 Family Dwellings (A B C & D)


 Nearest zip codes: 13035, 13408, 13484, 13122, 13072, 13334.


