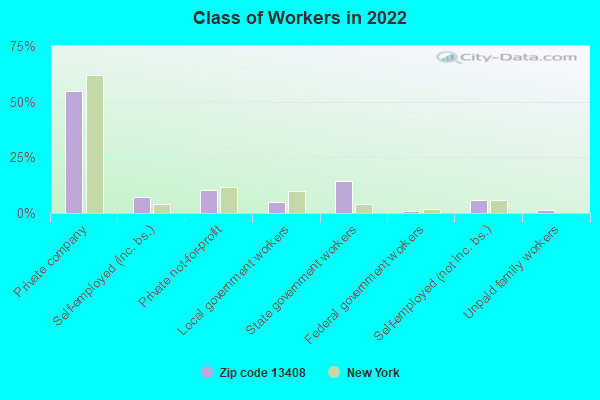
Estimated zip code population in 2022: 3,329 Zip code population in 2010: 4,280 Zip code population in 2000: 3,908
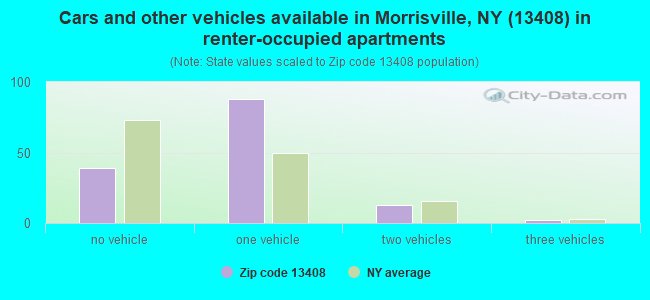
Houses and condos: 1,035 Renter-occupied apartments: 140
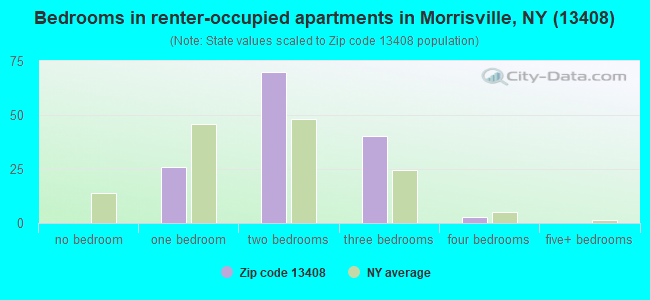
% of renters here:
17%
State:
46%
March 2022 cost of living index in zip code 13408: 95.0 (less than average, U.S. average is 100)
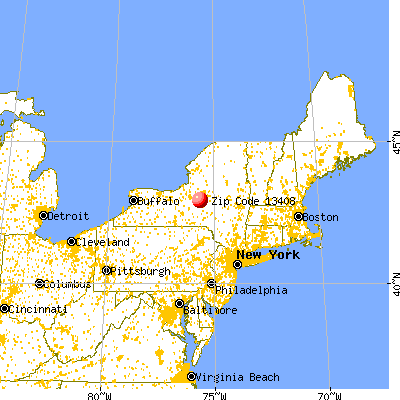
Land area: 37.6 sq. mi. Water area: 0.1 sq. mi.
Population density: 88 people per square mile
(very low).
OSM Map
General Map
Google Map
MSN Map
OSM Map
General Map
Google Map
MSN Map
OSM Map
General Map
Google Map
MSN Map
OSM Map
General Map
Google Map
MSN Map
Please wait while loading the map...
Real estate property taxes paid for housing units in 2022:
This zip code:
2.1% ($3,474)
New York:
1.5% ($6,180)
Median real estate property taxes paid for housing units with mortgages in 2022: $3,441 (2.1%) Median real estate property taxes paid for housing units with no mortgage in 2022: $3,642 (2.3%)
Business Search- 14 Million verified businesses
Males: 1,633
(49.1%)
Females: 1,696
(50.9%)
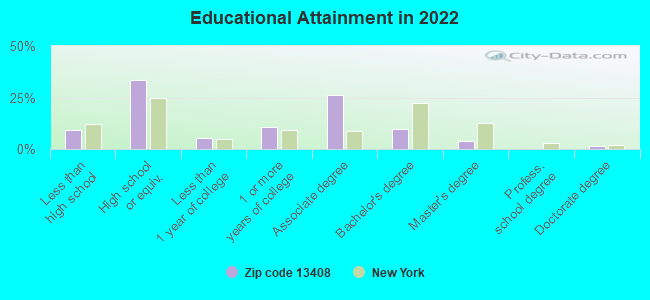
For population 25 years and over in 13408:
High school or higher: 89.9%
Bachelor's degree or higher: 15.0%
Graduate or professional degree: 5.5%
Unemployed: 3.6%
Mean travel time to work (commute): 18.4 minutes
For population 15 years and over in 13408:
Never married: 57.9%
Now married: 28.5%
Separated: 0.5%
Widowed: 3.7%
Divorced: 9.5%
Zip code 13408 compared to state average:
Median house value significantly below state average.
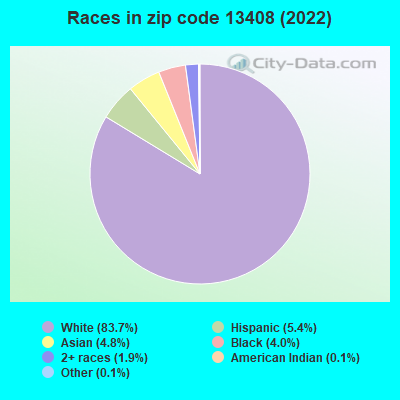
Black race population percentage significantly below state average.
Hispanic race population percentage significantly below state average.
Median age significantly below state average.
Foreign-born population percentage significantly below state average.
Renting percentage significantly below state average.
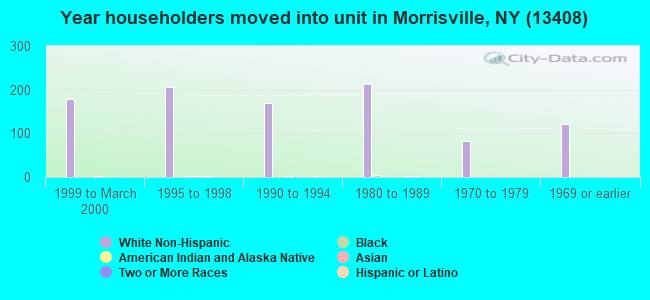
Length of stay since moving in above state average.
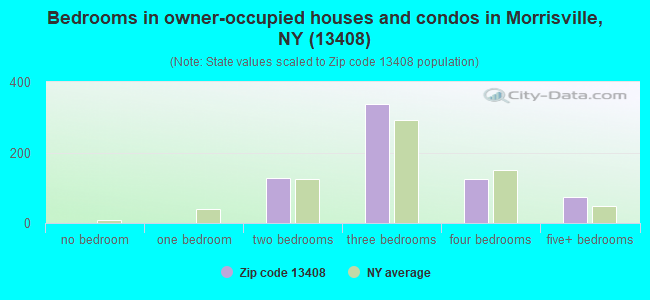
Number of rooms per house above state average.
Number of college students significantly above state average.
Percentage of population with a bachelor's degree or higher significantly below state average.
Estimated median house/condo value in 2022: $163,037
13408:
$163,037
New York:
$400,400
According to our research of New York and other state lists, there were 4 registered sex offenders living in 13408 zip code as of May 28, 2024. The ratio of all residents to sex offenders in zip code 13408 is 1,039 to 1. The ratio of registered sex offenders to all residents in this zip code is near the state average.
Median resident age:
This zip code:
22.0 years
New York median age:
40.0 years
Average household size:
This zip code:
2.2 people
New York:
2.5 people
Averages for the 2020 tax year for zip code 13408, filed in 2021:
Average Adjusted Gross Income (AGI) in 2020: $55,253 (Individual Income Tax Returns)
Here:
$55,253
State:
$90,930
Salary/wage: $47,604 (reported on 80.2% of returns)
Here:
$47,604
State:
$72,104
(% of AGI for various income ranges: 1153.5% for AGIs below $25k, 3261.2% for AGIs $25k-50k, 6317.7% for AGIs $50k-75k, 8837.8% for AGIs $75k-100k, 17127.8% for AGIs $100k-200k)
Taxable interest for individuals: $829 (reported on 31.5% of returns)
This zip code:
$829
New York:
$3,075
(% of AGI for various income ranges: 20.5% for AGIs below $25k, 27.3% for AGIs $25k-50k, 27.7% for AGIs $50k-75k, 24.4% for AGIs $75k-100k, 133.3% for AGIs $100k-200k)
Ordinary dividends: $1,665 (reported on 15.3% of returns)
Here:
$1,665
State:
$11,095
(% of AGI for various income ranges: 13.5% for AGIs below $25k, 27.7% for AGIs $25k-50k, 30.8% for AGIs $50k-75k, 42.2% for AGIs $75k-100k, 117.8% for AGIs $100k-200k)
Net capital gain/loss in AGI: +$7,355 (reported on 9.9% of returns)
Here:
+$7,355
State:
+$44,925
(% of AGI for various income ranges: 55.4% for AGIs $25k-50k, 120.0% for AGIs $50k-75k, 565.6% for AGIs $100k-200k)
Profit/loss from business: +$6,607 (reported on 12.6% of returns)
Here:
+$6,607
State:
+$14,940
(% of AGI for various income ranges: 75.0% for AGIs below $25k, 79.2% for AGIs $25k-50k, 413.8% for AGIs $50k-75k, 34.4% for AGIs $100k-200k)
Taxable individual retirement arrangement distribution: $11,812 (reported on 7.2% of returns)
13408:
$11,812
New York:
$19,609
(% of AGI for various income ranges: 63.0% for AGIs below $25k, 139.2% for AGIs $25k-50k, 507.8% for AGIs $75k-100k)
Total itemized deductions: $21,233 (reported on 2.7% of returns)
Here:
$21,233
State:
$39,326
(% of AGI for various income ranges: 707.8% for AGIs $75k-100k)
Charity contributions: $5,350 (reported on 1.8% of returns)
Here:
$5,350
State:
$15,420
(% of AGI for various income ranges: 82.3% for AGIs $50k-75k)
Taxes paid: $6,950 (reported on 3.6% of returns)
13408:
$6,950
State:
$9,183
(% of AGI for various income ranges: 308.9% for AGIs $75k-100k)
Earned income credit: $1,838 (reported on 14.4% of returns)
Here:
$1,838
State:
$2,138
(% of AGI for various income ranges: 66.0% for AGIs below $25k, 62.3% for AGIs $25k-50k)
Percentage of individuals using paid preparers for their 2020 taxes: 96.4%
Here:
96%
State:
95%
(% for various income ranges: 93.3% for AGIs below $25k, 100.0% for AGIs $25k-50k, 100.0% for AGIs $50k-75k, 92.9% for AGIs $75k-100k, 93.3% for AGIs $100k-200k)
Averages for the 2012 tax year for zip code 13408, filed in 2013:
Average Adjusted Gross Income (AGI) in 2012: $46,468 (Individual Income Tax Returns)
Here:
$46,468
State:
$77,088
Salary/wage: $40,055 (reported on 85.7% of returns)
Here:
$40,055
State:
$60,593
(% of AGI for various income ranges: 73.1% for AGIs below $25k, 78.3% for AGIs $25k-50k, 75.7% for AGIs $50k-75k, 79.0% for AGIs $75k-100k, 67.3% for AGIs $100k-200k)
Taxable interest for individuals: $598 (reported on 37.5% of returns)
This zip code:
$598
New York:
$3,125
(% of AGI for various income ranges: 0.5% for AGIs below $25k, 0.7% for AGIs $25k-50k, 0.7% for AGIs $50k-75k, 0.2% for AGIs $75k-100k, 0.4% for AGIs $100k-200k)
Ordinary dividends: $2,105 (reported on 17.9% of returns)
Here:
$2,105
State:
$10,299
(% of AGI for various income ranges: 0.7% for AGIs below $25k, 0.8% for AGIs $25k-50k, 0.5% for AGIs $50k-75k, 0.2% for AGIs $75k-100k, 1.4% for AGIs $100k-200k)
Net capital gain/loss in AGI: +$5,383 (reported on 10.7% of returns)
Here:
+$5,383
State:
+$42,474
(% of AGI for various income ranges: 0.1% for AGIs below $25k, 1.1% for AGIs $25k-50k, 0.5% for AGIs $50k-75k, 2.8% for AGIs $100k-200k)
Profit/loss from business: +$6,500 (reported on 12.5% of returns)
Here:
+$6,500
State:
+$16,168
(% of AGI for various income ranges: 9.0% for AGIs below $25k, 2.2% for AGIs $25k-50k, 1.7% for AGIs $75k-100k)
Taxable individual retirement arrangement distribution: $9,680 (reported on 8.9% of returns)
13408:
$9,680
New York:
$17,621
(% of AGI for various income ranges: 1.9% for AGIs below $25k, 3.4% for AGIs $25k-50k, 5.0% for AGIs $75k-100k)
Total itemized deductions: $16,500 (19% of AGI, reported on 25.0% of returns)
Here:
$16,500
State:
$34,985
Here:
19.2% of AGI
State:
21.3% of AGI
(% of AGI for various income ranges: 6.0% for AGIs below $25k, 6.6% for AGIs $25k-50k, 7.6% for AGIs $50k-75k, 8.7% for AGIs $75k-100k, 12.2% for AGIs $100k-200k)
Charity contributions: $2,705 (reported on 17.9% of returns)
Here:
$2,705
State:
$5,572
(% of AGI for various income ranges: 1.1% for AGIs $25k-50k, 0.8% for AGIs $50k-75k, 0.8% for AGIs $75k-100k, 1.7% for AGIs $100k-200k)
Taxes paid: $7,982 (reported on 25.0% of returns)
13408:
$7,982
State:
$18,656
(% of AGI for various income ranges: 2.1% for AGIs below $25k, 2.4% for AGIs $25k-50k, 3.5% for AGIs $50k-75k, 3.8% for AGIs $75k-100k, 6.9% for AGIs $100k-200k)
Earned income credit: $2,238 (reported on 18.8% of returns)
Here:
$2,238
State:
$2,230
(% of AGI for various income ranges: 6.4% for AGIs below $25k, 1.1% for AGIs $25k-50k)
Percentage of individuals using paid preparers for their 2012 taxes: 54.5%
Here:
54%
State:
66%
(% for various income ranges: 46.7% for AGIs below $25k, 56.7% for AGIs $25k-50k, 60.0% for AGIs $50k-75k, 63.6% for AGIs $75k-100k, 63.6% for AGIs $100k-200k)
Averages for the 2004 tax year for zip code 13408, filed in 2005:
Average Adjusted Gross Income (AGI) in 2004: $35,663 (Individual Income Tax Returns)
Here:
$35,663
State:
$59,519
Salary/wage: $33,543 (reported on 86.8% of returns)
Here:
$33,543
State:
$50,673
(% of AGI for various income ranges: 111.3% for AGIs below $10k, 75.9% for AGIs $10k-25k, 84.1% for AGIs $25k-50k, 83.0% for AGIs $50k-75k, 75.4% for AGIs $75k-100k, 80.8% for AGIs over 100k)
Taxable interest for individuals: $865 (reported on 44.4% of returns)
This zip code:
$865
New York:
$2,377
(% of AGI for various income ranges: 4.4% for AGIs below $10k, 1.1% for AGIs $10k-25k, 1.9% for AGIs $25k-50k, 0.6% for AGIs $50k-75k, 1.0% for AGIs $75k-100k, 0.2% for AGIs over 100k)
Taxable dividends: $1,121 (reported on 17.8% of returns)
Here:
$1,121
State:
$5,394
(% of AGI for various income ranges: 1.7% for AGIs below $10k, 1.0% for AGIs $10k-25k, 0.5% for AGIs $25k-50k, 0.5% for AGIs $50k-75k, 0.6% for AGIs $75k-100k, 0.3% for AGIs over 100k)
Net capital gain/loss: +$1,374 (reported on 13.8% of returns)
Here:
+$1,374
State:
+$23,581
(% of AGI for various income ranges: 3.4% for AGIs below $10k, 1.4% for AGIs $10k-25k, 0.4% for AGIs $25k-50k, 0.2% for AGIs $50k-75k, 0.4% for AGIs $75k-100k, 0.4% for AGIs over 100k)
Profit/loss from business: +$2,340 (reported on 15.2% of returns)
Here:
+$2,340
State:
+$13,809
(% of AGI for various income ranges: 1.4% for AGIs below $10k, 4.5% for AGIs $10k-25k, 0.6% for AGIs $25k-50k, 0.6% for AGIs $50k-75k, -0.1% for AGIs $75k-100k, 0.7% for AGIs over 100k)
IRA payment deduction: $1,800 (reported on 1.4% of returns)
13408:
$1,800
New York:
$3,115
Total itemized deductions: $13,732 (21% of AGI, reported on 24.1% of returns)
Here:
$13,732
State:
$25,864
Here:
20.6% of AGI
State:
21.9% of AGI
(% of AGI for various income ranges: 6.2% for AGIs $10k-25k, 6.4% for AGIs $25k-50k, 10.5% for AGIs $50k-75k, 12.2% for AGIs $75k-100k, 13.1% for AGIs over 100k)
Charity contributions deductions: $2,037 (3% of AGI, reported on 20.5% of returns)
Here:
$2,037
State:
$4,439
Here:
2.9% of AGI
State:
3.6% of AGI
(% of AGI for various income ranges: 1.0% for AGIs $10k-25k, 0.8% for AGIs $25k-50k, 1.2% for AGIs $50k-75k, 1.2% for AGIs $75k-100k, 2.2% for AGIs over 100k)
Total tax: $4,106 (reported on 73.5% of returns)
13408:
$4,106
State:
$11,730
(% of AGI for various income ranges: 2.3% for AGIs below $10k, 4.3% for AGIs $10k-25k, 6.5% for AGIs $25k-50k, 8.0% for AGIs $50k-75k, 10.6% for AGIs $75k-100k, 15.2% for AGIs over 100k)
Earned income credit: $1,561 (reported on 17.5% of returns)
Here:
$1,561
State:
$1,757
Percentage of individuals using paid preparers for their 2004 taxes: 61.5%
Here:
61%
State:
67%
(% for various income ranges: 57.7% for AGIs below $10k, 64.1% for AGIs $10k-25k, 63.2% for AGIs $25k-50k, 57.9% for AGIs $50k-75k, 70.6% for AGIs $75k-100k, 54.5% for AGIs over 100k)
Household received Food Stamps/SNAP in the past 12 months: 78 Household did not receive Food Stamps/SNAP in the past 12 months: 725
Women who had a birth in the past 12 months: 24 (12 now married, 12 unmarried) Women who did not have a birth in the past 12 months: 1,053 (137 now married, 928 unmarried)
Housing units in zip code 13408 with a mortgage: 425 (74 second mortgage, 36 both second mortgage and home equity loan) Houses without a mortgage: 26
Median monthly owner costs for units with a mortgage: $1,489 Median monthly owner costs for units without a mortgage: $622
Residents with income below the poverty level in 2022:
This zip code:
6.5%
Whole state:
14.3%
Residents with income below 50% of the poverty level in 2022:
This zip code:
1.9%
Whole state:
6.8%
Median number of rooms in houses and condos:
Here:
6.8
State:
6.3
Median number of rooms in apartments:
Here:
4.2
State:
3.8
Notable locations in this zip code not listed on our city pages
Notable locations in zip code 13408: Richardson Family Farm (A), Hughes Corners (B), Embury Corners (C), Davis Corners (D), Bucks Corners (E), Morrisville Village Wastewater Treatment Plant (F), Bliss Corners (G), IcePlex (H), Automotive Technology Building (I), Automotive Performance Center (J), Galbreath Hall (K), Charlton Hall (L), Seneca Hall (M), Cayuga Hall (N), Oneida Hall (O), Shannon Hall (P), East Hall (Q), Hamilton Hall (R), Marshall Hall (S), Spader Horticulture Complex (T). Display/hide their locations on the map
Churches in zip code 13408 include: Church of the Resurrection (A), Faith Baptist Church (B), Morrisville Community Church (C). Display/hide their locations on the map
In group quarters: 1,592 (-1 institutionalized population)
Size of family households: 254 2-persons, 130 3-persons, 50 4-persons, 45 5-persons, 5 6-persons, 13 7-or-more-persons
Size of nonfamily households: 272 1-person, 39 2-persons
292 married couples with children.
89 single-parent households (40 men, 49 women).
91.3% of residents of 13408 zip code speak English at home.
2.5% of residents speak Spanish at home (85% very well, 15% well).
2.6% of residents speak other Indo-European language at home (78% very well, 19% well, 4% not well).
2.5% of residents speak Asian or Pacific Island language at home (71% very well, 29% well).
0.3% of residents speak other language at home (100% well).
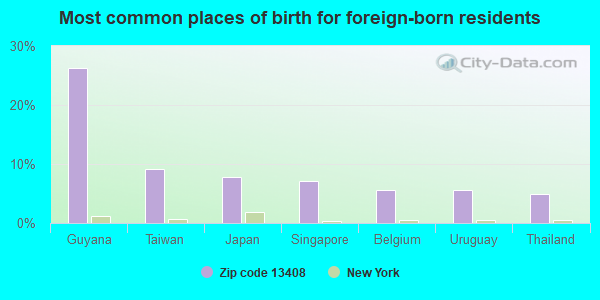
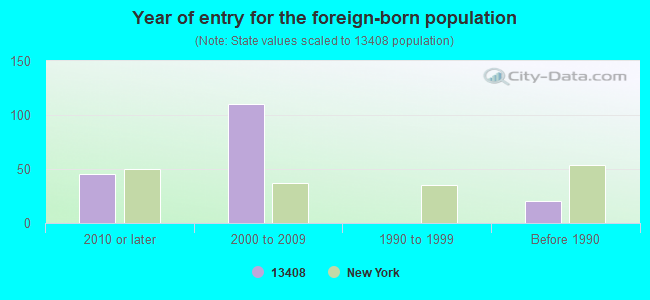
Foreign born population: 140 (4.2%) (53.0% of them are naturalized citizens)
This zip code:
4.2%
Whole state:
22.7%
26%Guyana
9%Taiwan
8%Japan
7%Singapore
6%Belgium
6%Uruguay
5%Thailand
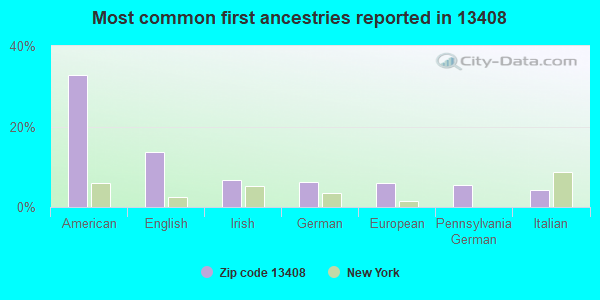
33%American
14%English
7%Irish
6%German
6%European
6%Pennsylvania German
4%Italian
Year of entry for the foreign-born population
452010 or later
1102000 to 2009
01990 to 1999
20Before 1990
Facilities with environmental interests located in this zip code:
AIR-O-TRONICS INC (CROSS AVE in MORRISVILLE, NY)
(Resource Conservation and Recovery Act (tracking hazardous waste))
Housing units lacking complete plumbing facilities: 2.9% Housing units lacking complete kitchen facilities: 0.2%
30.0%Fuel oil, kerosene, etc.
23.7%Utility gas
21.7%Bottled, tank, or LP gas
12.9%Wood
5.7%Electricity
3.9%Other fuel
2.0%Coal or coke
Population in 1990: 4,491.
Place of birth for U.S.-born residents:
This state: 2,313
Northeast: 401
Midwest: 143
South: 178
West: 116
54% of the 13408 zip code residents lived in the same house 5 years ago. Out of people who lived in different houses, 41% lived in this county. Out of people who lived in different counties, 50% lived in New York.
91% of the 13408 zip code residents lived in the same house 1 year ago. Out of people who lived in different houses, 49% moved from this county. Out of people who lived in different houses, 32% moved from different county within same state. Out of people who lived in different houses, 19% moved from different state.
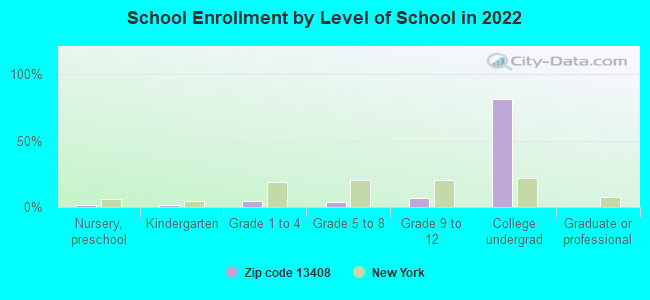
Private vs. public school enrollment:
Students in private schools in grades 1 to 8 (elementary and middle school): 25
Here:
17.3%
New York:
15.6%
Students in private schools in grades 9 to 12 (high school): 17
Here:
15.6%
New York:
15.0%
Students in private undergraduate colleges: 800
Here:
56.4%
New York:
39.2%
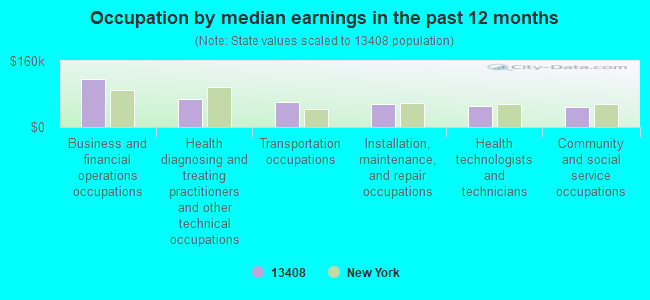
Occupation by median earnings in the past 12 months ($)
116,259Business and financial operations occupations
66,823Health diagnosing and treating practitioners and other technical occupations
61,798Transportation occupations
55,838Installation, maintenance, and repair occupations
50,220Health technologists and technicians
48,012Community and social service occupations
Top industries in this zip code by the number of employees in 2005:
Accommodation and Food Services: Food Service Contractors (100-249 employees: 1 establishment, 50-99 employees: 1 establishment, 1-4 employees: 1 establishment)
Health Care and Social Assistance: Nursing Care Facilities (100-249: 1)
Health Care and Social Assistance: Other Individual and Family Services (20-49: 1, 1-4: 1)
Professional, Scientific, and Technical Services: Research and Development in the Physical, Engineering, and Life Sciences (20-49: 1)
Health Care and Social Assistance: Services for the Elderly and Persons with Disabilities (20-49: 1)
Management of Companies and Enterprises: Corporate, Subsidiary, and Regional Managing Offices (20-49: 1)
Professional, Scientific, and Technical Services: Offices of Lawyers (10-19: 1, 5-9: 1)
People in group quarters in 2010:
1,457 people in college/university student housing
117 people in nursing facilities/skilled-nursing facilities
11 people in residential treatment centers for adults
6 people in emergency and transitional shelters (with sleeping facilities) for people experiencing homelessness
People in group quarters in 2000:
1,198 people in college dormitories (includes college quarters off campus)
117 people in nursing homes
3 people in homes for the mentally retarded
Fatal accident statistics in 2013:
Fatal accident count: 2
Vehicles involved in fatal accidents: 2
Fatal accidents caused by drunken drivers: 1
Fatalities: 2
Persons involved in fatal accidents: 5
Pedestrians involved in fatal accidents: 0
Home Mortgage Disclosure Act Aggregated Statistics For Year 2009 (Based on 4 partial tracts)
A) FHA, FSA/RHS & VA Home Purchase Loans
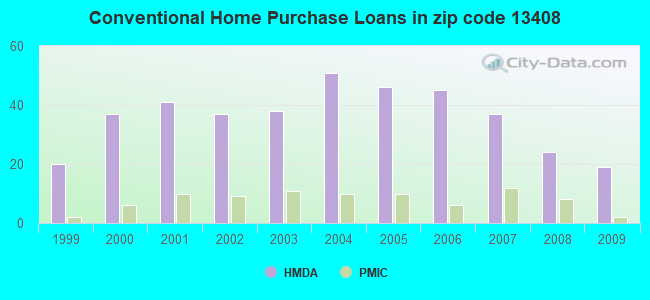
B) Conventional Home Purchase Loans
C) Refinancings
D) Home Improvement Loans
F) Non-occupant Loans on < 5 Family Dwellings (A B C & D)
G) Loans On Manufactured Home Dwelling (A B C & D)
Number
Average Value
Number
Average Value
Number
Average Value
Number
Average Value
Number
Average Value
Number
Average Value
LOANS ORIGINATED
8
$112,008
19
$117,154
66
$109,444
18
$37,674
5
$150,962
4
$77,088
APPLICATIONS APPROVED, NOT ACCEPTED
0
$0
0
$0
6
$94,645
2
$67,485
0
$0
0
$0
APPLICATIONS DENIED
1
$78,720
3
$61,173
23
$132,319
5
$13,610
1
$101,310
3
$64,543
APPLICATIONS WITHDRAWN
0
$0
1
$94,210
14
$136,391
2
$15,325
0
$0
0
$0
FILES CLOSED FOR INCOMPLETENESS
0
$0
1
$43,180
2
$110,600
1
$2,770
1
$93,560
0
$0
Aggregated Statistics For Year 2008 (Based on 4 partial tracts)
A) FHA, FSA/RHS & VA Home Purchase Loans
B) Conventional Home Purchase Loans
C) Refinancings
D) Home Improvement Loans
F) Non-occupant Loans on < 5 Family Dwellings (A B C & D)
G) Loans On Manufactured Home Dwelling (A B C & D)
Number
Average Value
Number
Average Value
Number
Average Value
Number
Average Value
Number
Average Value
Number
Average Value
LOANS ORIGINATED
9
$117,227
24
$109,109
42
$95,380
21
$36,627
9
$96,292
5
$67,782
APPLICATIONS APPROVED, NOT ACCEPTED
1
$118,540
3
$101,867
5
$133,588
4
$10,298
1
$252,380
3
$71,233
APPLICATIONS DENIED
2
$97,850
6
$122,853
35
$105,491
31
$23,716
1
$59,240
8
$63,881
APPLICATIONS WITHDRAWN
1
$78,660
1
$189,200
16
$120,998
3
$61,633
1
$106,650
3
$82,857
FILES CLOSED FOR INCOMPLETENESS
0
$0
1
$102,420
2
$187,955
1
$89,980
0
$0
0
$0
Aggregated Statistics For Year 2007 (Based on 4 partial tracts)
A) FHA, FSA/RHS & VA Home Purchase Loans
B) Conventional Home Purchase Loans
C) Refinancings
D) Home Improvement Loans
F) Non-occupant Loans on < 5 Family Dwellings (A B C & D)
G) Loans On Manufactured Home Dwelling (A B C & D)
Number
Average Value
Number
Average Value
Number
Average Value
Number
Average Value
Number
Average Value
Number
Average Value
LOANS ORIGINATED
8
$94,719
37
$108,111
55
$94,173
29
$51,467
7
$106,124
11
$57,834
APPLICATIONS APPROVED, NOT ACCEPTED
1
$62,000
6
$87,520
19
$103,097
3
$66,137
0
$0
3
$53,393
APPLICATIONS DENIED
1
$70,310
17
$79,560
54
$104,817
37
$41,046
2
$44,225
16
$64,172
APPLICATIONS WITHDRAWN
2
$59,790
5
$109,458
24
$125,767
5
$65,824
1
$31,560
1
$45,280
FILES CLOSED FOR INCOMPLETENESS
1
$171,430
2
$74,475
2
$174,585
1
$23,250
0
$0
1
$23,250
Aggregated Statistics For Year 2006 (Based on 4 partial tracts)
A) FHA, FSA/RHS & VA Home Purchase Loans
B) Conventional Home Purchase Loans
C) Refinancings
D) Home Improvement Loans
F) Non-occupant Loans on < 5 Family Dwellings (A B C & D)
G) Loans On Manufactured Home Dwelling (A B C & D)
Number
Average Value
Number
Average Value
Number
Average Value
Number
Average Value
Number
Average Value
Number
Average Value
LOANS ORIGINATED
7
$94,070
45
$100,990
59
$93,503
32
$42,921
10
$106,864
9
$44,862
APPLICATIONS APPROVED, NOT ACCEPTED
1
$99,650
8
$80,026
8
$142,841
4
$25,452
0
$0
2
$82,815
APPLICATIONS DENIED
1
$51,450
17
$94,338
61
$95,172
32
$24,213
4
$72,242
14
$48,630
APPLICATIONS WITHDRAWN
1
$69,310
8
$97,466
41
$94,271
5
$69,390
3
$98,253
4
$54,305
FILES CLOSED FOR INCOMPLETENESS
1
$125,750
3
$101,020
7
$129,351
1
$22,140
0
$0
0
$0
Aggregated Statistics For Year 2005 (Based on 4 partial tracts)
A) FHA, FSA/RHS & VA Home Purchase Loans
B) Conventional Home Purchase Loans
C) Refinancings
D) Home Improvement Loans
F) Non-occupant Loans on < 5 Family Dwellings (A B C & D)
G) Loans On Manufactured Home Dwelling (A B C & D)
Number
Average Value
Number
Average Value
Number
Average Value
Number
Average Value
Number
Average Value
Number
Average Value
LOANS ORIGINATED
6
$84,097
46
$115,151
67
$87,011
32
$32,548
9
$106,656
11
$59,678
APPLICATIONS APPROVED, NOT ACCEPTED
1
$78,610
4
$93,118
15
$95,673
3
$43,043
1
$52,040
0
$0
APPLICATIONS DENIED
2
$52,040
18
$70,770
50
$92,525
31
$25,329
2
$27,650
17
$48,732
APPLICATIONS WITHDRAWN
2
$123,310
7
$88,164
48
$95,837
6
$87,985
1
$33,770
4
$52,500
FILES CLOSED FOR INCOMPLETENESS
1
$39,310
1
$82,700
9
$134,839
1
$71,260
1
$55,940
1
$53,120
Aggregated Statistics For Year 2004 (Based on 4 partial tracts)
A) FHA, FSA/RHS & VA Home Purchase Loans
B) Conventional Home Purchase Loans
C) Refinancings
D) Home Improvement Loans
E) Loans on Dwellings For 5+ Families
F) Non-occupant Loans on < 5 Family Dwellings (A B C & D)
G) Loans On Manufactured Home Dwelling (A B C & D)
Number
Average Value
Number
Average Value
Number
Average Value
Number
Average Value
Number
Average Value
Number
Average Value
Number
Average Value
LOANS ORIGINATED
5
$73,238
51
$103,449
62
$84,584
31
$23,293
1
$36,540
10
$119,837
11
$56,653
APPLICATIONS APPROVED, NOT ACCEPTED
0
$0
2
$82,245
6
$60,730
5
$23,128
0
$0
1
$45,950
1
$31,460
APPLICATIONS DENIED
0
$0
10
$63,587
54
$87,082
21
$24,087
0
$0
2
$80,565
8
$52,044
APPLICATIONS WITHDRAWN
1
$32,050
3
$56,833
41
$76,982
6
$35,108
0
$0
2
$61,925
3
$44,530
FILES CLOSED FOR INCOMPLETENESS
1
$154,340
2
$93,960
12
$108,064
2
$41,945
0
$0
1
$78,060
0
$0
Aggregated Statistics For Year 2003 (Based on 4 partial tracts)
A) FHA, FSA/RHS & VA Home Purchase Loans
B) Conventional Home Purchase Loans
C) Refinancings
D) Home Improvement Loans
E) Loans on Dwellings For 5+ Families
F) Non-occupant Loans on < 5 Family Dwellings (A B C & D)
Number
Average Value
Number
Average Value
Number
Average Value
Number
Average Value
Number
Average Value
Number
Average Value
LOANS ORIGINATED
9
$76,476
38
$94,108
107
$87,643
14
$32,864
1
$413,850
10
$116,510
APPLICATIONS APPROVED, NOT ACCEPTED
1
$36,540
5
$85,712
11
$89,495
2
$7,130
0
$0
1
$31,670
APPLICATIONS DENIED
1
$54,280
7
$67,383
60
$78,498
14
$13,364
0
$0
3
$48,270
APPLICATIONS WITHDRAWN
1
$96,570
4
$74,402
42
$89,051
5
$24,408
0
$0
1
$42,730
FILES CLOSED FOR INCOMPLETENESS
0
$0
0
$0
5
$77,778
0
$0
0
$0
0
$0
Aggregated Statistics For Year 2002 (Based on 4 partial tracts)
A) FHA, FSA/RHS & VA Home Purchase Loans
B) Conventional Home Purchase Loans
C) Refinancings
D) Home Improvement Loans
F) Non-occupant Loans on < 5 Family Dwellings (A B C & D)
Number
Average Value
Number
Average Value
Number
Average Value
Number
Average Value
Number
Average Value
LOANS ORIGINATED
7
$75,141
37
$73,856
71
$81,859
19
$19,746
5
$44,284
APPLICATIONS APPROVED, NOT ACCEPTED
0
$0
7
$64,260
11
$80,289
3
$16,920
1
$38,410
APPLICATIONS DENIED
1
$49,930
8
$55,542
46
$83,782
13
$13,385
2
$50,430
APPLICATIONS WITHDRAWN
0
$0
3
$53,733
45
$70,970
3
$25,943
1
$47,460
FILES CLOSED FOR INCOMPLETENESS
1
$21,590
1
$44,290
5
$72,504
0
$0
0
$0
Aggregated Statistics For Year 2001 (Based on 4 partial tracts)
A) FHA, FSA/RHS & VA Home Purchase Loans
B) Conventional Home Purchase Loans
C) Refinancings
D) Home Improvement Loans
F) Non-occupant Loans on < 5 Family Dwellings (A B C & D)
Number
Average Value
Number
Average Value
Number
Average Value
Number
Average Value
Number
Average Value
LOANS ORIGINATED
11
$75,515
41
$75,372
62
$73,683
28
$12,520
4
$59,315
APPLICATIONS APPROVED, NOT ACCEPTED
0
$0
9
$65,240
11
$65,913
4
$21,588
1
$55,970
APPLICATIONS DENIED
1
$17,160
14
$57,341
37
$59,669
12
$11,692
0
$0
APPLICATIONS WITHDRAWN
0
$0
2
$46,280
29
$64,624
8
$19,552
1
$33,220
FILES CLOSED FOR INCOMPLETENESS
1
$16,050
1
$29,890
3
$66,077
0
$0
0
$0
Aggregated Statistics For Year 2000 (Based on 4 partial tracts)
A) FHA, FSA/RHS & VA Home Purchase Loans
B) Conventional Home Purchase Loans
C) Refinancings
D) Home Improvement Loans
F) Non-occupant Loans on < 5 Family Dwellings (A B C & D)
Number
Average Value
Number
Average Value
Number
Average Value
Number
Average Value
Number
Average Value
LOANS ORIGINATED
9
$77,850
37
$71,978
29
$59,369
26
$15,839
5
$52,460
APPLICATIONS APPROVED, NOT ACCEPTED
1
$38,100
13
$68,475
7
$70,486
6
$29,192
1
$43,830
APPLICATIONS DENIED
1
$32,660
19
$50,299
37
$50,213
14
$14,591
1
$100,610
APPLICATIONS WITHDRAWN
0
$0
5
$39,938
18
$47,221
4
$15,190
0
$0
FILES CLOSED FOR INCOMPLETENESS
0
$0
1
$41,210
2
$76,095
1
$11,110
0
$0
Aggregated Statistics For Year 1999 (Based on 2 partial tracts)
A) FHA, FSA/RHS & VA Home Purchase Loans
B) Conventional Home Purchase Loans
C) Refinancings
D) Home Improvement Loans
F) Non-occupant Loans on < 5 Family Dwellings (A B C & D)
Detailed PMIC statistics for the following Tracts:0306.00
, 0307.00
2002 - 2018 National Fire Incident Reporting System (NFIRS) incidents
Based on the data from the years 2002 - 2018 the average number of fires per year is 11. The highest number of fire incidents - 26 took place in 2003, and the least - 0 in 2011. The data has a declining trend.
When looking into fire subcategories, the most incidents belonged to: Structure Fires (42.2%), and Outside Fires (34.1%).
Fire incident types reported to NFIRS in Zip Code 13408


 Nearest zip codes: 13134, 13484, 13409, 13334, 13061, 13310.


 Based on the data from the years 2002 - 2018 the average number of fires per year is 11. The highest number of fire incidents - 26 took place in 2003, and the least - 0 in 2011. The data has a declining trend.
 When looking into fire subcategories, the most incidents belonged to: Structure Fires (42.2%), and Outside Fires (34.1%).