Estimated zip code population in 2022: 3,690 Zip code population in 2010: 4,871 Zip code population in 2000: 5,012
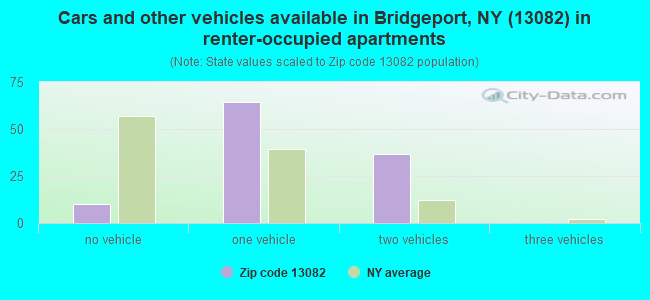
Houses and condos: 1,698 Renter-occupied apartments: 110
% of renters here:
7%
State:
46%
March 2022 cost of living index in zip code 13082: 93.7 (less than average, U.S. average is 100)
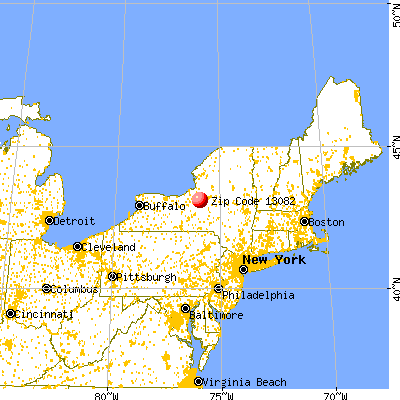
Land area: 23.6 sq. mi. Water area: 0.4 sq. mi.
Population density: 157 people per square mile
(very low).
OSM Map
General Map
Google Map
MSN Map
OSM Map
General Map
Google Map
MSN Map
OSM Map
General Map
Google Map
MSN Map
OSM Map
General Map
Google Map
MSN Map
Please wait while loading the map...
Real estate property taxes paid for housing units in 2022:
This zip code:
2.6% ($4,409)
New York:
1.5% ($6,180)
Median real estate property taxes paid for housing units with mortgages in 2022: $5,182 (3.0%) Median real estate property taxes paid for housing units with no mortgage in 2022: $3,645 (2.1%)
Business Search- 14 Million verified businesses
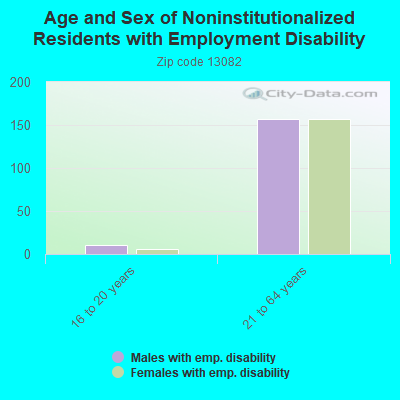
Males: 1,787
(48.4%)
Females: 1,902
(51.6%)
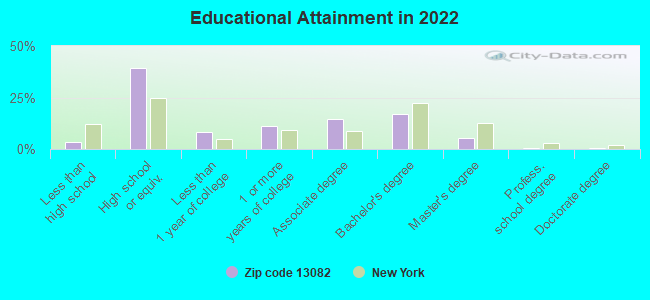
For population 25 years and over in 13082:
High school or higher: 95.9%
Bachelor's degree or higher: 23.6%
Graduate or professional degree: 6.6%
Unemployed: 4.8%
Mean travel time to work (commute): 20.9 minutes
For population 15 years and over in 13082:
Never married: 27.4%
Now married: 52.7%
Separated: 1.0%
Widowed: 7.9%
Divorced: 11.0%
Zip code 13082 compared to state average:
Median house value significantly below state average.
Black race population percentage significantly below state average.
Hispanic race population percentage significantly below state average.
Median age above state average.
Foreign-born population percentage significantly below state average.
Renting percentage significantly below state average.
Length of stay since moving in significantly above state average.
Number of rooms per house above state average.
Percentage of population with a bachelor's degree or higher below state average.
Estimated median house/condo value in 2022: $172,419
13082:
$172,419
New York:
$400,400
According to our research of New York and other state lists, there were 5 registered sex offenders living in 13082 zip code as of May 28, 2024. The ratio of all residents to sex offenders in zip code 13082 is 979 to 1. The ratio of registered sex offenders to all residents in this zip code is near the state average.
Median resident age:
This zip code:
47.1 years
New York median age:
40.0 years
Average household size:
This zip code:
2.4 people
New York:
2.5 people
Averages for the 2020 tax year for zip code 13082, filed in 2021:
Average Adjusted Gross Income (AGI) in 2020: $59,165 (Individual Income Tax Returns)
Here:
$59,165
State:
$90,930
Salary/wage: $51,448 (reported on 81.4% of returns)
Here:
$51,448
State:
$72,104
(% of AGI for various income ranges: 1113.6% for AGIs below $25k, 3246.2% for AGIs $25k-50k, 6422.1% for AGIs $50k-75k, 7963.0% for AGIs $75k-100k, 16062.4% for AGIs $100k-200k)
Taxable interest for individuals: $564 (reported on 36.4% of returns)
This zip code:
$564
New York:
$3,075
(% of AGI for various income ranges: 14.3% for AGIs below $25k, 15.8% for AGIs $25k-50k, 15.4% for AGIs $50k-75k, 38.0% for AGIs $75k-100k, 85.7% for AGIs $100k-200k)
Ordinary dividends: $2,343 (reported on 19.9% of returns)
Here:
$2,343
State:
$11,095
(% of AGI for various income ranges: 22.6% for AGIs below $25k, 37.0% for AGIs $25k-50k, 52.5% for AGIs $50k-75k, 65.0% for AGIs $75k-100k, 188.6% for AGIs $100k-200k)
Net capital gain/loss in AGI: +$6,994 (reported on 15.3% of returns)
Here:
+$6,994
State:
+$44,925
(% of AGI for various income ranges: 9.6% for AGIs below $25k, 23.6% for AGIs $25k-50k, 122.9% for AGIs $50k-75k, 90.0% for AGIs $75k-100k, 310.0% for AGIs $100k-200k)
Profit/loss from business: +$13,285 (reported on 11.4% of returns)
Here:
+$13,285
State:
+$14,940
(% of AGI for various income ranges: 90.4% for AGIs below $25k, 63.8% for AGIs $25k-50k, 139.6% for AGIs $50k-75k, 302.5% for AGIs $75k-100k, 879.5% for AGIs $100k-200k)
Taxable individual retirement arrangement distribution: $14,725 (reported on 11.9% of returns)
13082:
$14,725
New York:
$19,609
(% of AGI for various income ranges: 98.3% for AGIs below $25k, 128.0% for AGIs $25k-50k, 182.9% for AGIs $50k-75k, 574.0% for AGIs $75k-100k, 648.1% for AGIs $100k-200k)
Total itemized deductions: $20,522 (reported on 3.8% of returns)
Here:
$20,522
State:
$39,326
(% of AGI for various income ranges: 417.5% for AGIs $50k-75k, 322.9% for AGIs $100k-200k)
Charity contributions: $2,433 (reported on 2.5% of returns)
Here:
$2,433
State:
$15,420
(% of AGI for various income ranges: 17.5% for AGIs $50k-75k, 46.2% for AGIs $100k-200k)
Taxes paid: $7,811 (reported on 3.8% of returns)
13082:
$7,811
State:
$9,183
(% of AGI for various income ranges: 152.9% for AGIs $50k-75k, 131.0% for AGIs $100k-200k)
Earned income credit: $1,981 (reported on 11.0% of returns)
Here:
$1,981
State:
$2,138
(% of AGI for various income ranges: 56.4% for AGIs below $25k, 50.0% for AGIs $25k-50k)
Percentage of individuals using paid preparers for their 2020 taxes: 95.8%
Here:
96%
State:
95%
(% for various income ranges: 92.8% for AGIs below $25k, 96.8% for AGIs $25k-50k, 97.4% for AGIs $50k-75k, 96.4% for AGIs $75k-100k, 97.0% for AGIs $100k-200k, 100.0% for AGIs over 200k)
Averages for the 2012 tax year for zip code 13082, filed in 2013:
Average Adjusted Gross Income (AGI) in 2012: $46,438 (Individual Income Tax Returns)
Here:
$46,438
State:
$77,088
Salary/wage: $42,488 (reported on 83.7% of returns)
Here:
$42,488
State:
$60,593
(% of AGI for various income ranges: 69.5% for AGIs below $25k, 75.4% for AGIs $25k-50k, 77.3% for AGIs $50k-75k, 75.4% for AGIs $75k-100k, 79.9% for AGIs $100k-200k)
Taxable interest for individuals: $680 (reported on 42.3% of returns)
This zip code:
$680
New York:
$3,125
(% of AGI for various income ranges: 1.0% for AGIs below $25k, 0.8% for AGIs $25k-50k, 0.6% for AGIs $50k-75k, 0.4% for AGIs $75k-100k, 0.5% for AGIs $100k-200k)
Ordinary dividends: $1,862 (reported on 23.0% of returns)
Here:
$1,862
State:
$10,299
(% of AGI for various income ranges: 1.3% for AGIs below $25k, 1.1% for AGIs $25k-50k, 0.6% for AGIs $50k-75k, 0.9% for AGIs $75k-100k, 0.9% for AGIs $100k-200k)
Net capital gain/loss in AGI: +$1,410 (reported on 12.6% of returns)
Here:
+$1,410
State:
+$42,474
(% of AGI for various income ranges: 0.5% for AGIs $25k-50k, 0.6% for AGIs $50k-75k, 0.3% for AGIs $75k-100k, 0.4% for AGIs $100k-200k)
Profit/loss from business: +$7,354 (reported on 11.7% of returns)
Here:
+$7,354
State:
+$16,168
(% of AGI for various income ranges: 5.0% for AGIs below $25k, 2.1% for AGIs $25k-50k, 1.4% for AGIs $50k-75k, 0.9% for AGIs $75k-100k, 1.5% for AGIs $100k-200k)
Taxable individual retirement arrangement distribution: $10,377 (reported on 12.6% of returns)
13082:
$10,377
New York:
$17,621
(% of AGI for various income ranges: 5.9% for AGIs below $25k, 2.9% for AGIs $25k-50k, 3.0% for AGIs $50k-75k, 2.5% for AGIs $75k-100k, 1.8% for AGIs $100k-200k)
Total itemized deductions: $17,749 (21% of AGI, reported on 29.7% of returns)
Here:
$17,749
State:
$34,985
Here:
21.1% of AGI
State:
21.3% of AGI
(% of AGI for various income ranges: 5.0% for AGIs below $25k, 8.9% for AGIs $25k-50k, 11.7% for AGIs $50k-75k, 11.1% for AGIs $75k-100k, 14.9% for AGIs $100k-200k)
Charity contributions: $2,128 (reported on 24.3% of returns)
Here:
$2,128
State:
$5,572
(% of AGI for various income ranges: 0.5% for AGIs below $25k, 0.8% for AGIs $25k-50k, 1.3% for AGIs $50k-75k, 1.1% for AGIs $75k-100k, 1.4% for AGIs $100k-200k)
Taxes paid: $9,166 (reported on 29.7% of returns)
13082:
$9,166
State:
$18,656
(% of AGI for various income ranges: 1.9% for AGIs below $25k, 3.5% for AGIs $25k-50k, 5.5% for AGIs $50k-75k, 5.7% for AGIs $75k-100k, 9.1% for AGIs $100k-200k)
Earned income credit: $2,025 (reported on 15.1% of returns)
Here:
$2,025
State:
$2,230
(% of AGI for various income ranges: 4.8% for AGIs below $25k, 0.8% for AGIs $25k-50k)
Percentage of individuals using paid preparers for their 2012 taxes: 55.6%
Here:
56%
State:
66%
(% for various income ranges: 50.5% for AGIs below $25k, 53.1% for AGIs $25k-50k, 60.0% for AGIs $50k-75k, 66.7% for AGIs $75k-100k, 64.0% for AGIs $100k-200k)
Averages for the 2004 tax year for zip code 13082, filed in 2005:
Average Adjusted Gross Income (AGI) in 2004: $40,442 (Individual Income Tax Returns)
Here:
$40,442
State:
$59,519
Salary/wage: $37,647 (reported on 86.0% of returns)
Here:
$37,647
State:
$50,673
(% of AGI for various income ranges: 123.7% for AGIs below $10k, 69.1% for AGIs $10k-25k, 81.4% for AGIs $25k-50k, 81.6% for AGIs $50k-75k, 85.8% for AGIs $75k-100k, 73.2% for AGIs over 100k)
Taxable interest for individuals: $826 (reported on 53.2% of returns)
This zip code:
$826
New York:
$2,377
(% of AGI for various income ranges: 5.4% for AGIs below $10k, 1.7% for AGIs $10k-25k, 1.3% for AGIs $25k-50k, 0.7% for AGIs $50k-75k, 0.7% for AGIs $75k-100k, 1.1% for AGIs over 100k)
Taxable dividends: $1,318 (reported on 27.0% of returns)
Here:
$1,318
State:
$5,394
(% of AGI for various income ranges: 2.8% for AGIs below $10k, 1.3% for AGIs $10k-25k, 0.8% for AGIs $25k-50k, 0.7% for AGIs $50k-75k, 0.3% for AGIs $75k-100k, 1.3% for AGIs over 100k)
Net capital gain/loss: +$1,770 (reported on 17.8% of returns)
Here:
+$1,770
State:
+$23,581
(% of AGI for various income ranges: -2.2% for AGIs below $10k, -0.1% for AGIs $10k-25k, 0.3% for AGIs $25k-50k, 0.5% for AGIs $50k-75k, 0.1% for AGIs $75k-100k, 3.0% for AGIs over 100k)
Profit/loss from business: +$9,432 (reported on 14.2% of returns)
Here:
+$9,432
State:
+$13,809
(% of AGI for various income ranges: 4.2% for AGIs below $10k, 4.1% for AGIs $10k-25k, 2.6% for AGIs $25k-50k, 3.0% for AGIs $50k-75k, 1.5% for AGIs $75k-100k, 5.8% for AGIs over 100k)
IRA payment deduction: $2,686 (reported on 3.0% of returns)
13082:
$2,686
New York:
$3,115
Total itemized deductions: $15,352 (21% of AGI, reported on 30.2% of returns)
Here:
$15,352
State:
$25,864
Here:
20.9% of AGI
State:
21.9% of AGI
(% of AGI for various income ranges: 9.3% for AGIs below $10k, 6.5% for AGIs $10k-25k, 8.1% for AGIs $25k-50k, 11.2% for AGIs $50k-75k, 14.5% for AGIs $75k-100k, 14.6% for AGIs over 100k)
Charity contributions deductions: $1,917 (3% of AGI, reported on 27.4% of returns)
Here:
$1,917
State:
$4,439
Here:
2.5% of AGI
State:
3.6% of AGI
(% of AGI for various income ranges: 0.7% for AGIs below $10k, 0.7% for AGIs $10k-25k, 1.0% for AGIs $25k-50k, 1.4% for AGIs $50k-75k, 1.6% for AGIs $75k-100k, 1.5% for AGIs over 100k)
Total tax: $4,938 (reported on 77.1% of returns)
13082:
$4,938
State:
$11,730
(% of AGI for various income ranges: 3.2% for AGIs below $10k, 4.1% for AGIs $10k-25k, 6.8% for AGIs $25k-50k, 8.6% for AGIs $50k-75k, 10.3% for AGIs $75k-100k, 15.2% for AGIs over 100k)
Earned income credit: $1,667 (reported on 10.6% of returns)
Here:
$1,667
State:
$1,757
Percentage of individuals using paid preparers for their 2004 taxes: 58.2%
Here:
58%
State:
67%
(% for various income ranges: 44.2% for AGIs below $10k, 57.8% for AGIs $10k-25k, 61.0% for AGIs $25k-50k, 66.2% for AGIs $50k-75k, 59.7% for AGIs $75k-100k, 70.6% for AGIs over 100k)
Household received Food Stamps/SNAP in the past 12 months: 161 Household did not receive Food Stamps/SNAP in the past 12 months: 1,375
Women who had a birth in the past 12 months: 69 (44 now married, 25 unmarried) Women who did not have a birth in the past 12 months: 696 (291 now married, 403 unmarried)
Housing units in zip code 13082 with a mortgage: 799 (112 second mortgage, 114 both second mortgage and home equity loan) Houses without a mortgage: 98
Median monthly owner costs for units with a mortgage: $1,548 Median monthly owner costs for units without a mortgage: $575
Residents with income below the poverty level in 2022:
This zip code:
5.7%
Whole state:
14.3%
Residents with income below 50% of the poverty level in 2022:
This zip code:
1.9%
Whole state:
6.8%
Median number of rooms in houses and condos:
Here:
6.4
State:
6.3
Median number of rooms in apartments:
Here:
4.8
State:
3.8
Notable locations in this zip code not listed on our city pages
Notable locations in zip code 13082: Manlius Center (A), Peck Corners (B), C And M Farm (C), Wilcox Farms (D), Kirkville Fire Department (E). Display/hide their locations on the map
In group quarters: 16 (-1 institutionalized population)
Size of family households: 611 2-persons, 265 3-persons, 116 4-persons, 96 5-persons, 15 6-persons
Size of nonfamily households: 383 1-person, 36 2-persons, 17 3-persons
372 married couples with children.
196 single-parent households (54 men, 142 women).
98.9% of residents of 13082 zip code speak English at home.
0.5% of residents speak Spanish at home (56% very well, 25% well, 19% not well).
0.5% of residents speak other Indo-European language at home (94% very well, 6% well).
0.2% of residents speak Asian or Pacific Island language at home (100% very well).
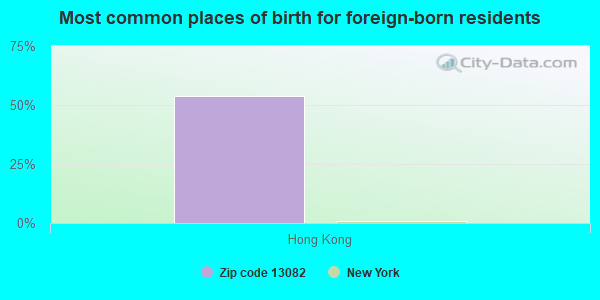
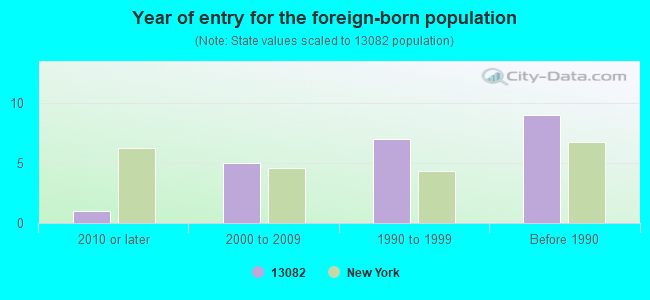
Foreign born population: 13 (0.4%) (58.4% of them are naturalized citizens)
This zip code:
0.4%
Whole state:
22.7%
54%Hong Kong
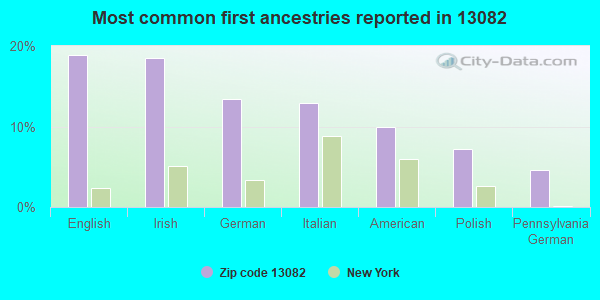
19%English
19%Irish
13%German
13%Italian
10%American
7%Polish
5%Pennsylvania German
Year of entry for the foreign-born population
12010 or later
52000 to 2009
71990 to 1999
9Before 1990
Facilities with environmental interests located in this zip code:
BURNS BROTHERS CONCRETE CONSTRUCTION (6449 MINOA-BRIDGEPORT RD in KIRKVILLE, NY)
Small Quantity Generators, between 100 kg and 1000 kg of hazardous waste/month (Resource Conservation and Recovery Act (tracking hazardous waste)) Organizations: ROBERT LEO (CONTACT/OWNER)
BLOSS MACHINE (6404 KIRKVILLE RD in KIRKVILLE, NY)
Small Quantity Generators, between 100 kg and 1000 kg of hazardous waste/month (Resource Conservation and Recovery Act (tracking hazardous waste)) - notification Organizations: RAYMOND BLOSS (CONTACT/OWNER)
Housing units lacking complete plumbing facilities: 0.1% Housing units lacking complete kitchen facilities: 1.7%
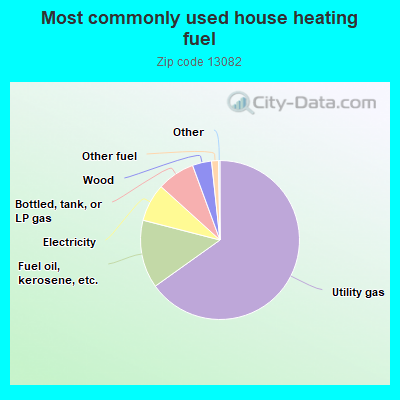
65.2%Utility gas
13.9%Fuel oil, kerosene, etc.
7.7%Electricity
7.7%Bottled, tank, or LP gas
3.9%Wood
1.4%Other fuel
Population in 1990: 4,798. Population change in the 1990s: +214 (+4.5%).
Place of birth for U.S.-born residents:
This state: 3,217
Northeast: 230
Midwest: 36
South: 138
West: 27
68% of the 13082 zip code residents lived in the same house 5 years ago. Out of people who lived in different houses, 53% lived in this county. Out of people who lived in different counties, 50% lived in New York.
96% of the 13082 zip code residents lived in the same house 1 year ago. Out of people who lived in different houses, 69% moved from this county. Out of people who lived in different houses, 13% moved from different county within same state. Out of people who lived in different houses, 15% moved from different state.
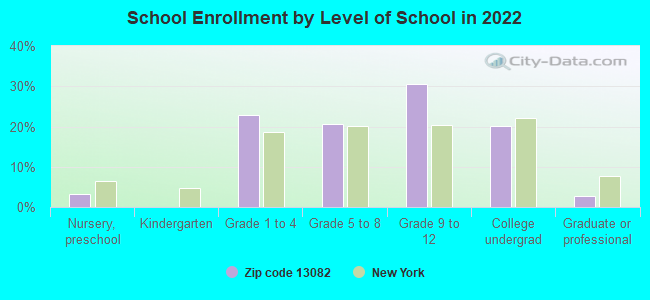
Private vs. public school enrollment:
Students in private schools in grades 1 to 8 (elementary and middle school):
Here:
0.0%
New York:
15.6%
Students in private schools in grades 9 to 12 (high school):
Here:
0.0%
New York:
15.0%
Students in private undergraduate colleges: 49
Here:
38.6%
New York:
39.2%
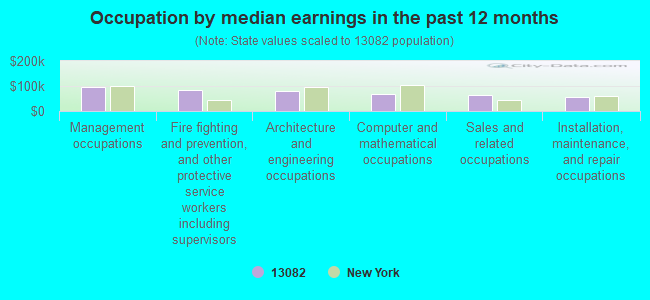
Occupation by median earnings in the past 12 months ($)
97,925Management occupations
85,166Fire fighting and prevention, and other protective service workers including supervisors
81,656Architecture and engineering occupations
66,973Computer and mathematical occupations
64,167Sales and related occupations
57,254Installation, maintenance, and repair occupations
Companies with federal contracts located in this zip code:
MABIE BROTHERS, INC (8571 KINDERHOOK RD in KIRKVILLE, NY; small business)
$5,468 with Army for Track Material, Railroad. Signed on 2003-08-08. Completion date: 2003-08-13.
Top industries in this zip code by the number of employees in 2005:
Administrative and Support and Waste Management and Remediation Services: Landscaping Services (10-19 employees: 1 establishment, 5-9 employees: 1 establishment, 1-4 employees: 6 establishments)
Construction: Other Foundation, Structure, and Building Exterior Contractors (20-49: 1)
Construction: New Single-Family Housing Construction (except Operative Builders) (10-19: 1, 1-4: 1)
Other Services (except Public Administration): Automotive Body, Paint, and Interior Repair and Maintenance (5-9: 2)
Construction: Plumbing, Heating, and Air-Conditioning Contractors (5-9: 1, 1-4: 2)
Construction: Siding Contractors (5-9: 1, 1-4: 1)
People in group quarters in 2010:
5 people in group homes intended for adults
People in group quarters in 2000:
4 people in religious group quarters
Fatal accident statistics in 2013:
Fatal accident count: 1
Vehicles involved in fatal accidents: 2
Fatal accidents caused by drunken drivers: 0
Fatalities: 1
Persons involved in fatal accidents: 2
Pedestrians involved in fatal accidents: 0
Fatal accident statistics in 2010:
Fatal accident count: 1
Vehicles involved in fatal accidents: 1
Fatal accidents caused by drunken drivers: 0
Fatalities: 1
Persons involved in fatal accidents: 1
Pedestrians involved in fatal accidents: 0
Home Mortgage Disclosure Act Aggregated Statistics For Year 2009 (Based on 4 partial tracts)
A) FHA, FSA/RHS & VA Home Purchase Loans
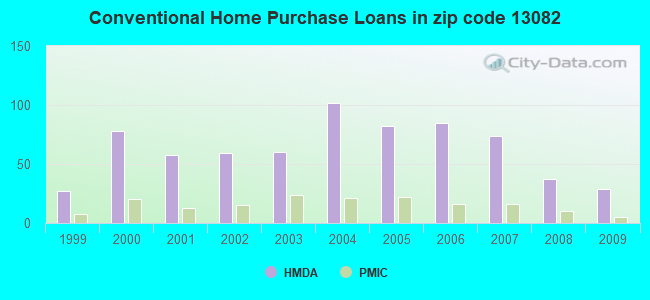
B) Conventional Home Purchase Loans
C) Refinancings
D) Home Improvement Loans
F) Non-occupant Loans on < 5 Family Dwellings (A B C & D)
G) Loans On Manufactured Home Dwelling (A B C & D)
Number
Average Value
Number
Average Value
Number
Average Value
Number
Average Value
Number
Average Value
Number
Average Value
LOANS ORIGINATED
26
$125,495
29
$143,482
103
$116,835
30
$19,201
4
$139,030
8
$55,866
APPLICATIONS APPROVED, NOT ACCEPTED
2
$114,275
5
$129,944
5
$165,592
1
$14,190
0
$0
3
$72,753
APPLICATIONS DENIED
2
$51,280
5
$83,554
48
$127,172
16
$19,117
1
$222,450
5
$46,388
APPLICATIONS WITHDRAWN
7
$106,134
3
$86,130
34
$115,263
1
$176,330
1
$44,760
4
$95,795
FILES CLOSED FOR INCOMPLETENESS
1
$76,640
1
$75,960
4
$164,720
2
$39,310
0
$0
1
$75,960
Aggregated Statistics For Year 2008 (Based on 4 partial tracts)
A) FHA, FSA/RHS & VA Home Purchase Loans
B) Conventional Home Purchase Loans
C) Refinancings
D) Home Improvement Loans
F) Non-occupant Loans on < 5 Family Dwellings (A B C & D)
G) Loans On Manufactured Home Dwelling (A B C & D)
Number
Average Value
Number
Average Value
Number
Average Value
Number
Average Value
Number
Average Value
Number
Average Value
LOANS ORIGINATED
23
$121,003
37
$122,828
79
$114,116
39
$63,158
8
$105,630
7
$73,343
APPLICATIONS APPROVED, NOT ACCEPTED
1
$59,680
10
$69,559
12
$166,122
5
$25,858
0
$0
5
$38,278
APPLICATIONS DENIED
2
$104,105
18
$72,568
70
$132,533
27
$41,409
3
$168,873
19
$42,480
APPLICATIONS WITHDRAWN
0
$0
2
$93,250
30
$156,078
4
$104,902
0
$0
1
$109,870
FILES CLOSED FOR INCOMPLETENESS
1
$121,400
1
$248,220
4
$98,372
1
$34,590
1
$106,480
1
$132,250
Aggregated Statistics For Year 2007 (Based on 4 partial tracts)
A) FHA, FSA/RHS & VA Home Purchase Loans
B) Conventional Home Purchase Loans
C) Refinancings
D) Home Improvement Loans
F) Non-occupant Loans on < 5 Family Dwellings (A B C & D)
G) Loans On Manufactured Home Dwelling (A B C & D)
Number
Average Value
Number
Average Value
Number
Average Value
Number
Average Value
Number
Average Value
Number
Average Value
LOANS ORIGINATED
21
$109,756
74
$109,877
76
$101,183
55
$35,677
8
$128,857
12
$56,404
APPLICATIONS APPROVED, NOT ACCEPTED
0
$0
13
$63,249
13
$98,600
13
$29,930
0
$0
3
$49,283
APPLICATIONS DENIED
1
$133,370
11
$84,924
81
$113,217
60
$42,562
6
$60,787
14
$69,419
APPLICATIONS WITHDRAWN
4
$100,028
9
$134,130
47
$106,315
16
$59,164
3
$179,723
1
$37,300
FILES CLOSED FOR INCOMPLETENESS
0
$0
1
$42,050
8
$168,049
3
$27,753
0
$0
0
$0
Aggregated Statistics For Year 2006 (Based on 4 partial tracts)
A) FHA, FSA/RHS & VA Home Purchase Loans
B) Conventional Home Purchase Loans
C) Refinancings
D) Home Improvement Loans
F) Non-occupant Loans on < 5 Family Dwellings (A B C & D)
G) Loans On Manufactured Home Dwelling (A B C & D)
Number
Average Value
Number
Average Value
Number
Average Value
Number
Average Value
Number
Average Value
Number
Average Value
LOANS ORIGINATED
18
$113,406
85
$98,675
91
$96,460
76
$31,852
16
$96,627
10
$55,273
APPLICATIONS APPROVED, NOT ACCEPTED
2
$110,190
9
$68,423
18
$81,132
9
$20,648
0
$0
7
$49,703
APPLICATIONS DENIED
2
$79,690
23
$82,958
86
$91,715
43
$39,603
5
$60,360
12
$49,904
APPLICATIONS WITHDRAWN
1
$35,940
8
$88,552
71
$97,496
8
$81,126
3
$113,033
1
$101,050
FILES CLOSED FOR INCOMPLETENESS
0
$0
5
$102,008
18
$130,906
1
$50,860
3
$79,143
0
$0
Aggregated Statistics For Year 2005 (Based on 4 partial tracts)
A) FHA, FSA/RHS & VA Home Purchase Loans
B) Conventional Home Purchase Loans
C) Refinancings
D) Home Improvement Loans
F) Non-occupant Loans on < 5 Family Dwellings (A B C & D)
G) Loans On Manufactured Home Dwelling (A B C & D)
Number
Average Value
Number
Average Value
Number
Average Value
Number
Average Value
Number
Average Value
Number
Average Value
LOANS ORIGINATED
19
$91,278
82
$104,691
120
$90,396
55
$43,213
18
$105,762
14
$48,510
APPLICATIONS APPROVED, NOT ACCEPTED
2
$94,110
11
$77,538
17
$115,863
8
$27,581
1
$108,510
3
$44,310
APPLICATIONS DENIED
1
$115,970
18
$72,318
93
$103,155
33
$29,475
1
$128,860
12
$41,770
APPLICATIONS WITHDRAWN
2
$87,855
8
$80,659
85
$96,753
8
$131,666
1
$136,320
10
$53,291
FILES CLOSED FOR INCOMPLETENESS
0
$0
5
$116,254
16
$129,829
0
$0
1
$78,670
0
$0
Aggregated Statistics For Year 2004 (Based on 4 partial tracts)
A) FHA, FSA/RHS & VA Home Purchase Loans
B) Conventional Home Purchase Loans
C) Refinancings
D) Home Improvement Loans
F) Non-occupant Loans on < 5 Family Dwellings (A B C & D)
G) Loans On Manufactured Home Dwelling (A B C & D)
Number
Average Value
Number
Average Value
Number
Average Value
Number
Average Value
Number
Average Value
Number
Average Value
LOANS ORIGINATED
17
$92,474
102
$98,896
125
$82,594
52
$26,401
11
$67,815
12
$46,884
APPLICATIONS APPROVED, NOT ACCEPTED
1
$115,970
15
$90,713
31
$78,818
7
$56,566
2
$79,690
9
$40,466
APPLICATIONS DENIED
3
$80,050
21
$76,590
102
$79,031
37
$21,799
3
$80,707
12
$36,962
APPLICATIONS WITHDRAWN
2
$113,765
12
$91,405
78
$93,785
13
$54,330
1
$77,990
4
$71,560
FILES CLOSED FOR INCOMPLETENESS
1
$38,660
4
$112,275
25
$82,118
0
$0
0
$0
0
$0
Aggregated Statistics For Year 2003 (Based on 4 partial tracts)
A) FHA, FSA/RHS & VA Home Purchase Loans
B) Conventional Home Purchase Loans
C) Refinancings
D) Home Improvement Loans
F) Non-occupant Loans on < 5 Family Dwellings (A B C & D)
Number
Average Value
Number
Average Value
Number
Average Value
Number
Average Value
Number
Average Value
LOANS ORIGINATED
22
$86,525
60
$110,402
246
$80,487
30
$20,724
13
$65,151
APPLICATIONS APPROVED, NOT ACCEPTED
2
$74,010
16
$80,774
32
$76,106
9
$36,014
0
$0
APPLICATIONS DENIED
1
$31,880
18
$56,366
98
$81,402
23
$19,317
3
$75,053
APPLICATIONS WITHDRAWN
1
$104,440
8
$116,760
69
$84,360
1
$11,530
1
$48,150
FILES CLOSED FOR INCOMPLETENESS
0
$0
1
$126,150
9
$103,236
0
$0
1
$45,440
Aggregated Statistics For Year 2002 (Based on 4 partial tracts)
A) FHA, FSA/RHS & VA Home Purchase Loans
B) Conventional Home Purchase Loans
C) Refinancings
D) Home Improvement Loans
E) Loans on Dwellings For 5+ Families
F) Non-occupant Loans on < 5 Family Dwellings (A B C & D)
Number
Average Value
Number
Average Value
Number
Average Value
Number
Average Value
Number
Average Value
Number
Average Value
LOANS ORIGINATED
17
$76,431
59
$88,764
164
$79,010
45
$21,982
0
$0
7
$51,543
APPLICATIONS APPROVED, NOT ACCEPTED
0
$0
10
$118,716
30
$68,714
9
$17,897
1
$47,470
1
$18,310
APPLICATIONS DENIED
4
$95,450
17
$83,465
82
$85,498
20
$14,490
0
$0
3
$19,280
APPLICATIONS WITHDRAWN
1
$96,300
5
$124,396
65
$81,999
4
$29,670
0
$0
1
$40,690
FILES CLOSED FOR INCOMPLETENESS
0
$0
1
$53,580
23
$70,654
0
$0
0
$0
1
$48,830
Aggregated Statistics For Year 2001 (Based on 4 partial tracts)
A) FHA, FSA/RHS & VA Home Purchase Loans
B) Conventional Home Purchase Loans
C) Refinancings
D) Home Improvement Loans
F) Non-occupant Loans on < 5 Family Dwellings (A B C & D)
Number
Average Value
Number
Average Value
Number
Average Value
Number
Average Value
Number
Average Value
LOANS ORIGINATED
26
$73,602
58
$76,631
120
$77,794
32
$18,902
10
$60,185
APPLICATIONS APPROVED, NOT ACCEPTED
0
$0
15
$49,237
24
$56,777
1
$48,150
2
$49,510
APPLICATIONS DENIED
2
$125,600
34
$48,122
91
$64,442
29
$14,412
4
$47,135
APPLICATIONS WITHDRAWN
5
$66,148
8
$62,202
76
$66,299
7
$21,716
1
$76,620
FILES CLOSED FOR INCOMPLETENESS
0
$0
0
$0
8
$77,654
0
$0
0
$0
Aggregated Statistics For Year 2000 (Based on 4 partial tracts)
A) FHA, FSA/RHS & VA Home Purchase Loans
B) Conventional Home Purchase Loans
C) Refinancings
D) Home Improvement Loans
F) Non-occupant Loans on < 5 Family Dwellings (A B C & D)
Number
Average Value
Number
Average Value
Number
Average Value
Number
Average Value
Number
Average Value
LOANS ORIGINATED
21
$76,394
78
$71,577
45
$71,742
54
$15,093
8
$75,625
APPLICATIONS APPROVED, NOT ACCEPTED
2
$116,650
18
$49,546
23
$54,161
14
$22,261
1
$93,590
APPLICATIONS DENIED
1
$18,310
40
$35,404
44
$58,687
22
$17,217
6
$43,553
APPLICATIONS WITHDRAWN
0
$0
2
$60,020
27
$47,200
5
$25,040
2
$59,845
FILES CLOSED FOR INCOMPLETENESS
0
$0
0
$0
12
$73,073
0
$0
1
$16,950
Aggregated Statistics For Year 1999 (Based on 2 partial tracts)
A) FHA, FSA/RHS & VA Home Purchase Loans
B) Conventional Home Purchase Loans
C) Refinancings
D) Home Improvement Loans
F) Non-occupant Loans on < 5 Family Dwellings (A B C & D)
Detailed PMIC statistics for the following Tracts:0156.00
, 0304.01
2002 - 2018 National Fire Incident Reporting System (NFIRS) incidents
According to the data from the years 2002 - 2018 the average number of fires per year is 27. The highest number of reported fires - 79 took place in 2016, and the least - 4 in 2002. The data has a rising trend.
When looking into fire subcategories, the most incidents belonged to: Structure Fires (42.2%), and Outside Fires (42.2%).
Fire incident types reported to NFIRS in Zip Code 13082


 Nearest zip codes: 13030, 13116, 13057, 13066, 13037, 13039.


 According to the data from the years 2002 - 2018 the average number of fires per year is 27. The highest number of reported fires - 79 took place in 2016, and the least - 4 in 2002. The data has a rising trend.
 When looking into fire subcategories, the most incidents belonged to: Structure Fires (42.2%), and Outside Fires (42.2%).