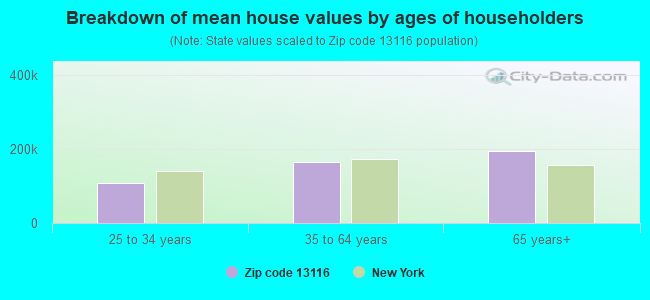
Estimated median house/condo value in 2022: $163,767
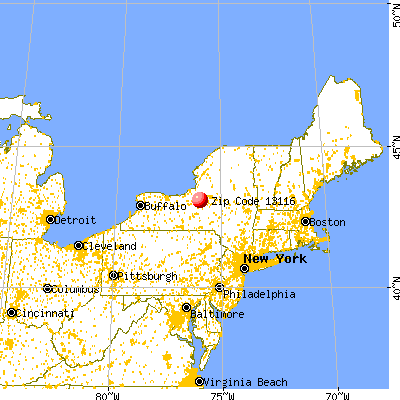
13116:
$163,767
New York:
$400,400
Median resident age:
This zip code:
41.4 years
New York median age:
40.0 years
Average household size:
This zip code:
2.4 people
New York:
2.5 people
Averages for the 2020 tax year for zip code 13116, filed in 2021:
Average Adjusted Gross Income (AGI) in 2020: $64,806 (Individual Income Tax Returns)
Here:
$64,806
State:
$90,930
Salary/wage: $56,909 (reported on 82.7% of returns)
Here:
$56,909
State:
$72,104
(% of AGI for various income ranges: 1127.1% for AGIs below $25k, 3254.2% for AGIs $25k-50k, 6138.3% for AGIs $50k-75k, 9145.7% for AGIs $75k-100k, 14186.8% for AGIs $100k-200k)
Taxable interest for individuals: $529 (reported on 42.5% of returns)
This zip code:
$529
New York:
$3,075
(% of AGI for various income ranges: 24.5% for AGIs below $25k, 18.4% for AGIs $25k-50k, 22.2% for AGIs $50k-75k, 77.1% for AGIs $75k-100k, 35.0% for AGIs $100k-200k)
Ordinary dividends: $2,558 (reported on 21.2% of returns)
Here:
$2,558
State:
$11,095
(% of AGI for various income ranges: 23.2% for AGIs below $25k, 33.2% for AGIs $25k-50k, 44.8% for AGIs $50k-75k, 138.6% for AGIs $75k-100k, 145.0% for AGIs $100k-200k)
Net capital gain/loss in AGI: +$5,787 (reported on 16.8% of returns)
Here:
+$5,787
State:
+$44,925
(% of AGI for various income ranges: 9.0% for AGIs below $25k, 14.7% for AGIs $25k-50k, 26.5% for AGIs $50k-75k, 51.4% for AGIs $75k-100k, 308.2% for AGIs $100k-200k)
Profit/loss from business: +$10,800 (reported on 12.3% of returns)
Here:
+$10,800
State:
+$14,940
(% of AGI for various income ranges: 75.2% for AGIs below $25k, 103.4% for AGIs $25k-50k, 87.0% for AGIs $50k-75k, 97.9% for AGIs $75k-100k, 642.3% for AGIs $100k-200k)
Taxable individual retirement arrangement distribution: $15,018 (reported on 12.3% of returns)
13116:
$15,018
New York:
$19,609
(% of AGI for various income ranges: 105.5% for AGIs below $25k, 141.1% for AGIs $25k-50k, 240.4% for AGIs $50k-75k, 479.3% for AGIs $75k-100k, 553.2% for AGIs $100k-200k)
Total itemized deductions: $23,978 (reported on 5.0% of returns)
Here:
$23,978
State:
$39,326
(% of AGI for various income ranges: 429.6% for AGIs $50k-75k, 531.8% for AGIs $100k-200k)
Charity contributions: $4,917 (reported on 3.4% of returns)
Here:
$4,917
State:
$15,420
(% of AGI for various income ranges: 25.7% for AGIs $50k-75k, 107.3% for AGIs $100k-200k)
Taxes paid: $8,444 (reported on 5.0% of returns)
13116:
$8,444
State:
$9,183
(% of AGI for various income ranges: 177.8% for AGIs $50k-75k, 159.5% for AGIs $100k-200k)
Earned income credit: $1,917 (reported on 10.1% of returns)
Here:
$1,917
State:
$2,138
(% of AGI for various income ranges: 52.9% for AGIs below $25k, 47.6% for AGIs $25k-50k)
Percentage of individuals using paid preparers for their 2020 taxes: 95.0%
Here:
95%
State:
95%
(% for various income ranges: 93.5% for AGIs below $25k, 93.5% for AGIs $25k-50k, 96.7% for AGIs $50k-75k, 95.2% for AGIs $75k-100k, 96.8% for AGIs $100k-200k, 100.0% for AGIs over 200k)
Averages for the 2012 tax year for zip code 13116, filed in 2013:
Average Adjusted Gross Income (AGI) in 2012: $51,054 (Individual Income Tax Returns)
Here:
$51,054
State:
$77,088
Salary/wage: $47,711 (reported on 84.4% of returns)
Here:
$47,711
State:
$60,593
(% of AGI for various income ranges: 67.3% for AGIs below $25k, 77.5% for AGIs $25k-50k, 77.8% for AGIs $50k-75k, 83.1% for AGIs $75k-100k, 96.7% for AGIs $100k-200k)
Taxable interest for individuals: $439 (reported on 46.9% of returns)
This zip code:
$439
New York:
$3,125
(% of AGI for various income ranges: 1.3% for AGIs below $25k, 0.5% for AGIs $25k-50k, 0.3% for AGIs $50k-75k, 0.3% for AGIs $75k-100k, 0.3% for AGIs $100k-200k)
Ordinary dividends: $1,256 (reported on 22.9% of returns)
Here:
$1,256
State:
$10,299
(% of AGI for various income ranges: 1.4% for AGIs below $25k, 0.6% for AGIs $25k-50k, 0.5% for AGIs $50k-75k, 0.3% for AGIs $75k-100k, 0.6% for AGIs $100k-200k)
Net capital gain/loss in AGI: +$500 (reported on 11.7% of returns)
Here:
+$500
State:
+$42,474
(% of AGI for various income ranges: 0.1% for AGIs $75k-100k, 0.3% for AGIs $100k-200k)
Profit/loss from business: +$11,441 (reported on 9.5% of returns)
Here:
+$11,441
State:
+$16,168
(% of AGI for various income ranges: 3.8% for AGIs below $25k, 2.2% for AGIs $25k-50k, 2.5% for AGIs $50k-75k, 1.2% for AGIs $75k-100k, 2.5% for AGIs $100k-200k)
Taxable individual retirement arrangement distribution: $10,205 (reported on 12.3% of returns)
13116:
$10,205
New York:
$17,621
(% of AGI for various income ranges: 4.7% for AGIs below $25k, 4.0% for AGIs $25k-50k, 2.0% for AGIs $50k-75k, 1.7% for AGIs $75k-100k, 2.2% for AGIs $100k-200k)
Total itemized deductions: $18,281 (20% of AGI, reported on 32.4% of returns)
Here:
$18,281
State:
$34,985
Here:
20.3% of AGI
State:
21.3% of AGI
(% of AGI for various income ranges: 6.0% for AGIs below $25k, 7.3% for AGIs $25k-50k, 9.7% for AGIs $50k-75k, 13.1% for AGIs $75k-100k, 15.6% for AGIs $100k-200k, 12.8% for AGIs over 200k)
Charity contributions: $2,108 (reported on 27.9% of returns)
Here:
$2,108
State:
$5,572
(% of AGI for various income ranges: 0.4% for AGIs below $25k, 0.6% for AGIs $25k-50k, 0.9% for AGIs $50k-75k, 1.5% for AGIs $75k-100k, 1.9% for AGIs $100k-200k)
Taxes paid: $9,691 (reported on 32.4% of returns)
13116:
$9,691
State:
$18,656
(% of AGI for various income ranges: 1.9% for AGIs below $25k, 3.3% for AGIs $25k-50k, 4.9% for AGIs $50k-75k, 6.9% for AGIs $75k-100k, 8.9% for AGIs $100k-200k, 8.3% for AGIs over 200k)
Earned income credit: $1,975 (reported on 13.4% of returns)
Here:
$1,975
State:
$2,230
(% of AGI for various income ranges: 4.1% for AGIs below $25k, 1.0% for AGIs $25k-50k)
Percentage of individuals using paid preparers for their 2012 taxes: 50.3%
Here:
50%
State:
66%
(% for various income ranges: 39.7% for AGIs below $25k, 50.0% for AGIs $25k-50k, 59.3% for AGIs $50k-75k, 63.6% for AGIs $75k-100k, 61.9% for AGIs $100k-200k)
Averages for the 2004 tax year for zip code 13116, filed in 2005:
Average Adjusted Gross Income (AGI) in 2004: $40,887 (Individual Income Tax Returns)
Here:
$40,887
State:
$59,519
Salary/wage: $38,775 (reported on 87.0% of returns)
Here:
$38,775
State:
$50,673
(% of AGI for various income ranges: 75.2% for AGIs below $10k, 74.7% for AGIs $10k-25k, 79.7% for AGIs $25k-50k, 83.1% for AGIs $50k-75k, 88.5% for AGIs $75k-100k, 82.8% for AGIs over 100k)
Taxable interest for individuals: $509 (reported on 58.0% of returns)
This zip code:
$509
New York:
$2,377
(% of AGI for various income ranges: 2.9% for AGIs below $10k, 2.0% for AGIs $10k-25k, 0.8% for AGIs $25k-50k, 0.6% for AGIs $50k-75k, 0.5% for AGIs $75k-100k, 0.3% for AGIs over 100k)
Taxable dividends: $1,117 (reported on 24.9% of returns)
Here:
$1,117
State:
$5,394
(% of AGI for various income ranges: 2.6% for AGIs below $10k, 1.0% for AGIs $10k-25k, 0.7% for AGIs $25k-50k, 0.5% for AGIs $50k-75k, 0.7% for AGIs $75k-100k, 0.5% for AGIs over 100k)
Net capital gain/loss: +$1,282 (reported on 15.5% of returns)
Here:
+$1,282
State:
+$23,581
(% of AGI for various income ranges: -1.8% for AGIs below $10k, 0.4% for AGIs $10k-25k, -0.2% for AGIs $25k-50k, 0.6% for AGIs $50k-75k, 0.7% for AGIs $75k-100k, 1.2% for AGIs over 100k)
Profit/loss from business: +$6,311 (reported on 9.2% of returns)
Here:
+$6,311
State:
+$13,809
(% of AGI for various income ranges: 4.3% for AGIs below $10k, 2.4% for AGIs $10k-25k, 1.0% for AGIs $25k-50k, 2.1% for AGIs $50k-75k, 1.1% for AGIs $75k-100k, 0.7% for AGIs over 100k)
IRA payment deduction: $2,659 (reported on 2.7% of returns)
13116:
$2,659
New York:
$3,115
Total itemized deductions: $14,045 (20% of AGI, reported on 36.5% of returns)
Here:
$14,045
State:
$25,864
Here:
20.1% of AGI
State:
21.9% of AGI
(% of AGI for various income ranges: 9.4% for AGIs $10k-25k, 10.7% for AGIs $25k-50k, 14.0% for AGIs $50k-75k, 14.3% for AGIs $75k-100k, 13.8% for AGIs over 100k)
Charity contributions deductions: $1,954 (3% of AGI, reported on 34.1% of returns)
Here:
$1,954
State:
$4,439
Here:
2.8% of AGI
State:
3.6% of AGI
(% of AGI for various income ranges: 1.0% for AGIs $10k-25k, 1.2% for AGIs $25k-50k, 1.7% for AGIs $50k-75k, 2.1% for AGIs $75k-100k, 2.0% for AGIs over 100k)
Total tax: $4,822 (reported on 77.2% of returns)
13116:
$4,822
State:
$11,730
(% of AGI for various income ranges: 1.7% for AGIs below $10k, 4.3% for AGIs $10k-25k, 7.1% for AGIs $25k-50k, 8.7% for AGIs $50k-75k, 10.2% for AGIs $75k-100k, 13.8% for AGIs over 100k)
Earned income credit: $1,523 (reported on 10.6% of returns)
Here:
$1,523
State:
$1,757
Percentage of individuals using paid preparers for their 2004 taxes: 55.5%
Here:
56%
State:
67%
(% for various income ranges: 41.5% for AGIs below $10k, 56.2% for AGIs $10k-25k, 53.2% for AGIs $25k-50k, 66.8% for AGIs $50k-75k, 65.4% for AGIs $75k-100k, 61.8% for AGIs over 100k)
Household received Food Stamps/SNAP in the past 12 months: 127 Household did not receive Food Stamps/SNAP in the past 12 months: 1,336
Women who had a birth in the past 12 months: 27 (27 now married, 0 unmarried) Women who did not have a birth in the past 12 months: 584 (343 now married, 234 unmarried)
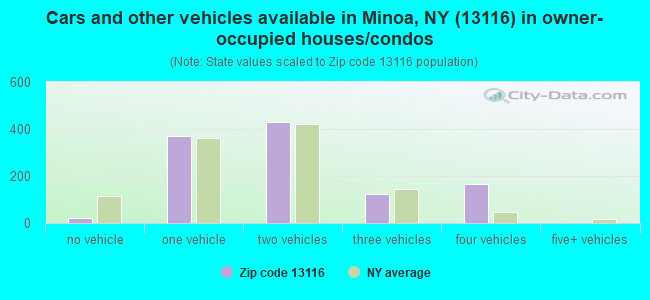
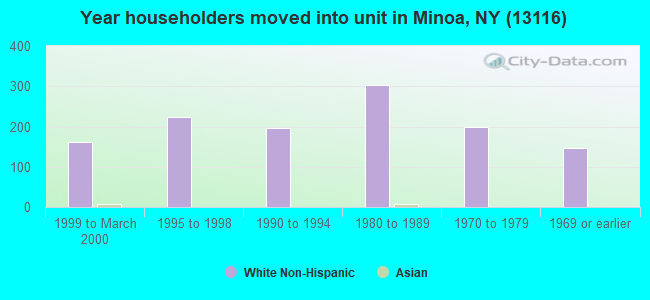
Housing units in zip code 13116 with a mortgage: 630 (84 second mortgage, 85 both second mortgage and home equity loan) Houses without a mortgage: 26
Median monthly owner costs for units with a mortgage: $1,603 Median monthly owner costs for units without a mortgage: $654
Residents with income below the poverty level in 2022:
This zip code:
4.7%
Whole state:
14.3%
Residents with income below 50% of the poverty level in 2022:
This zip code:
1.1%
Whole state:
6.8%
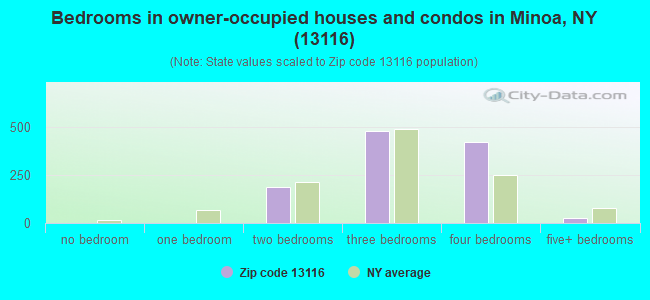
Median number of rooms in houses and condos:
Here:
6.8
State:
6.3
Median number of rooms in apartments:
Here:
4.7
State:
3.8
Notable locations in this zip code not listed on our city pages
In group quarters: 71 (-1 institutionalized population)
Size of family households: 386 2-persons, 394 3-persons, 92 4-persons, 106 5-persons
Size of nonfamily households: 395 1-person, 77 2-persons, 16 3-persons
465 married couples with children.
206 single-parent households (95 men, 111 women).
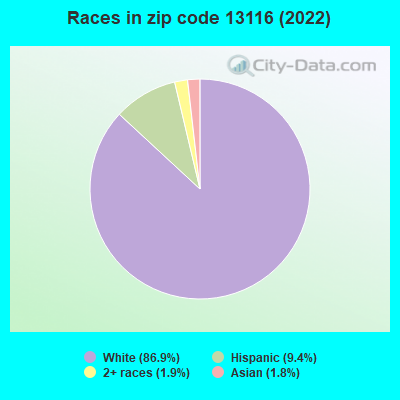
90.0% of residents of 13116 zip code speak English at home.
8.6% of residents speak Spanish at home (34% very well, 28% well, 37% not well).
0.9% of residents speak other Indo-European language at home (100% very well).
0.8% of residents speak Asian or Pacific Island language at home (62% very well, 38% well).
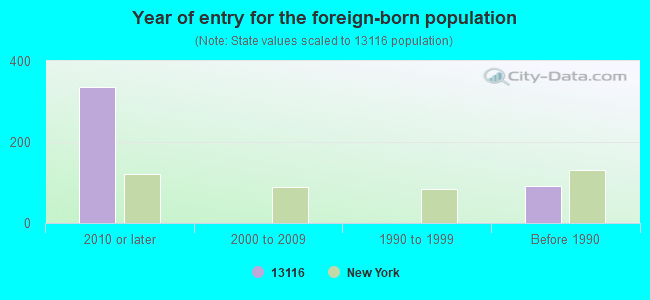
Foreign born population: 379 (10.6%) (30.6% of them are naturalized citizens)
This zip code:
10.6%
Whole state:
22.7%
59%Cuba
12%Japan
4%Singapore
3%Sweden
1%Guyana
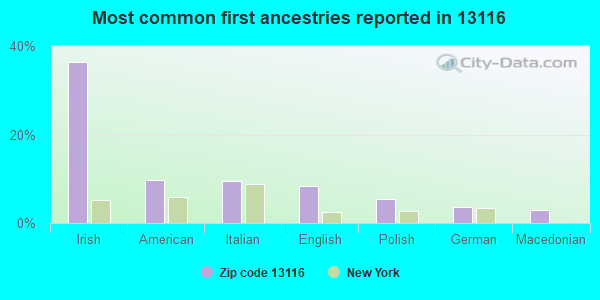
36%Irish
10%American
10%Italian
8%English
5%Polish
4%German
3%Macedonian
Year of entry for the foreign-born population
3352010 or later
02000 to 2009
01990 to 1999
91Before 1990
Facilities with environmental interests located in this zip code:
AGWAY ENERGY PRODUCTS (320 N CENTRAL AVE in MINOA, NY)
AIR MINOR (AIRS/AFS) Conditionally Exempt Small Quantity Generators, less than 100 kg/month of hazardous waste (Resource Conservation and Recovery Act (tracking hazardous waste)) Business SIC classification: PETROLEUM BULK STATIONS AND TERMINALS Business NAICS classification: HEATING OIL DEALERS. Organizations: SUBURBAN HEATING OIL PARTNERS LLC (CONTACT/OPERATOR)
Alternative names: SUBURBAN HEATING OIL PARTNERS LLC
Housing units lacking complete plumbing facilities: 1.9% Housing units lacking complete kitchen facilities: 1.9%
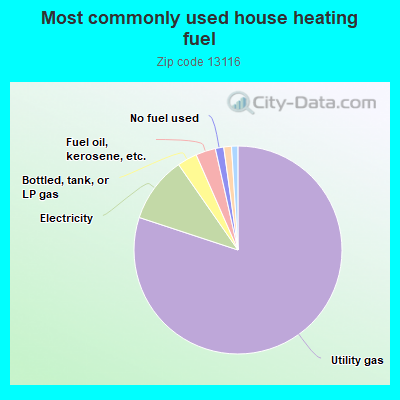
80.3%Utility gas
10.3%Electricity
3.1%Bottled, tank, or LP gas
3.1%Fuel oil, kerosene, etc.
1.3%No fuel used
1.2%Other fuel
1.0%Wood
Population in 1990: 3,790.
Place of birth for U.S.-born residents:
This state: 2,320
Northeast: 111
Midwest: 261
South: 63
West: 488
71% of the 13116 zip code residents lived in the same house 5 years ago. Out of people who lived in different houses, 62% lived in this county. Out of people who lived in different counties, 50% lived in New York.
86% of the 13116 zip code residents lived in the same house 1 year ago. Out of people who lived in different houses, 89% moved from this county. Out of people who lived in different houses, 4% moved from different county within same state. Out of people who lived in different houses, 4% moved from abroad.
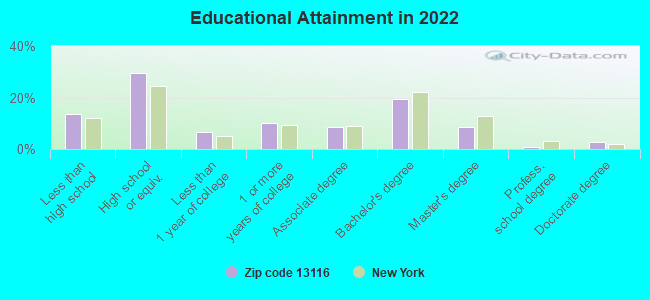
Private vs. public school enrollment:
Students in private schools in grades 1 to 8 (elementary and middle school):
Here:
0.0%
New York:
15.6%
Students in private schools in grades 9 to 12 (high school):
Here:
0.0%
New York:
15.0%
Students in private undergraduate colleges: 65
Here:
38.4%
New York:
39.2%
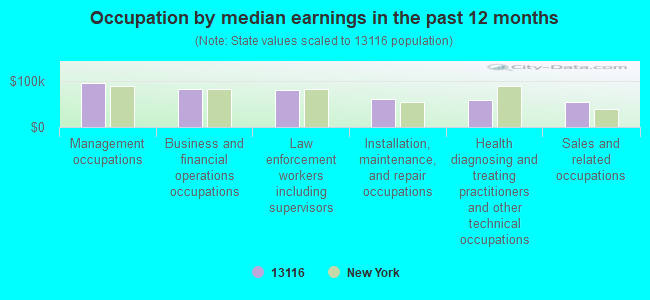
Occupation by median earnings in the past 12 months ($)
95,799Management occupations
83,034Business and financial operations occupations
79,956Law enforcement workers including supervisors
61,520Installation, maintenance, and repair occupations
59,724Health diagnosing and treating practitioners and other technical occupations
53,837Sales and related occupations
Top industries in this zip code by the number of employees in 2005:
Health Care and Social Assistance: Nursing Care Facilities (100-249 employees: 1 establishment)
Administrative and Support and Waste Management and Remediation Services: Janitorial Services (20-49: 1, 10-19: 1, 1-4: 1)
Real Estate and Rental and Leasing: Truck, Utility Trailer, and RV (Recreational Vehicle) Rental and Leasing (10-19: 1)
Other Services (except Public Administration): Religious Organizations (5-9: 1, 1-4: 1)
Information: Libraries and Archives (5-9: 1)
Health Care and Social Assistance: Offices of Dentists (5-9: 1)
Real Estate and Rental and Leasing: Lessors of Nonresidential Buildings (except Miniwarehouses) (5-9: 1)
People in group quarters in 2010:
76 people in nursing facilities/skilled-nursing facilities
People in group quarters in 2000:
77 people in nursing homes
Home Mortgage Disclosure Act Aggregated Statistics For Year 2009 (Based on 2 partial tracts)
A) FHA, FSA/RHS & VA Home Purchase Loans
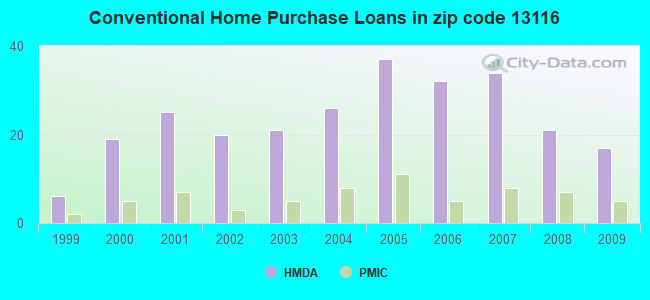
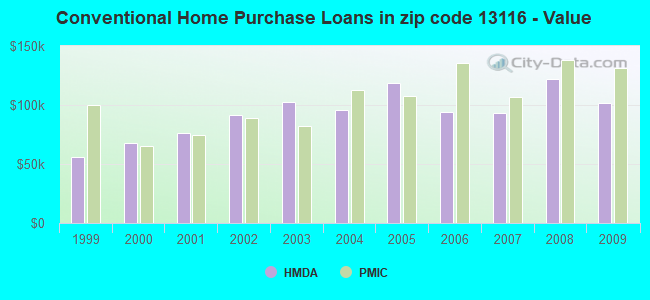
B) Conventional Home Purchase Loans
C) Refinancings
D) Home Improvement Loans
F) Non-occupant Loans on < 5 Family Dwellings (A B C & D)
Number
Average Value
Number
Average Value
Number
Average Value
Number
Average Value
Number
Average Value
LOANS ORIGINATED
22
$129,583
17
$101,993
40
$113,708
12
$14,469
1
$49,470
APPLICATIONS APPROVED, NOT ACCEPTED
0
$0
2
$85,600
2
$143,315
3
$8,407
0
$0
APPLICATIONS DENIED
3
$114,783
0
$0
5
$143,656
6
$17,378
0
$0
APPLICATIONS WITHDRAWN
3
$170,720
0
$0
8
$110,398
0
$0
0
$0
FILES CLOSED FOR INCOMPLETENESS
0
$0
0
$0
0
$0
0
$0
0
$0
Aggregated Statistics For Year 2008 (Based on 2 partial tracts)
A) FHA, FSA/RHS & VA Home Purchase Loans
B) Conventional Home Purchase Loans
C) Refinancings
D) Home Improvement Loans
E) Loans on Dwellings For 5+ Families
F) Non-occupant Loans on < 5 Family Dwellings (A B C & D)
Number
Average Value
Number
Average Value
Number
Average Value
Number
Average Value
Number
Average Value
Number
Average Value
LOANS ORIGINATED
16
$128,252
21
$121,642
28
$87,058
16
$22,037
1
$1,409,410
2
$97,725
APPLICATIONS APPROVED, NOT ACCEPTED
0
$0
2
$170,235
3
$73,233
1
$95,060
0
$0
0
$0
APPLICATIONS DENIED
2
$181,390
2
$133,375
12
$134,223
13
$26,452
0
$0
0
$0
APPLICATIONS WITHDRAWN
1
$169,750
2
$137,740
7
$103,027
0
$0
0
$0
0
$0
FILES CLOSED FOR INCOMPLETENESS
0
$0
0
$0
2
$81,480
1
$61,590
0
$0
0
$0
Aggregated Statistics For Year 2007 (Based on 2 partial tracts)
A) FHA, FSA/RHS & VA Home Purchase Loans
B) Conventional Home Purchase Loans
C) Refinancings
D) Home Improvement Loans
F) Non-occupant Loans on < 5 Family Dwellings (A B C & D)
Number
Average Value
Number
Average Value
Number
Average Value
Number
Average Value
Number
Average Value
LOANS ORIGINATED
5
$119,698
34
$93,534
22
$83,133
17
$29,699
2
$76,145
APPLICATIONS APPROVED, NOT ACCEPTED
0
$0
1
$90,690
3
$97,970
2
$36,135
0
$0
APPLICATIONS DENIED
0
$0
4
$80,995
13
$86,927
10
$32,495
0
$0
APPLICATIONS WITHDRAWN
0
$0
4
$65,595
10
$96,466
1
$115,430
0
$0
FILES CLOSED FOR INCOMPLETENESS
0
$0
0
$0
4
$85,722
0
$0
0
$0
Aggregated Statistics For Year 2006 (Based on 2 partial tracts)
A) FHA, FSA/RHS & VA Home Purchase Loans
B) Conventional Home Purchase Loans
C) Refinancings
D) Home Improvement Loans
F) Non-occupant Loans on < 5 Family Dwellings (A B C & D)
Number
Average Value
Number
Average Value
Number
Average Value
Number
Average Value
Number
Average Value
LOANS ORIGINATED
10
$105,730
32
$93,802
33
$79,584
20
$29,658
2
$66,205
APPLICATIONS APPROVED, NOT ACCEPTED
0
$0
3
$79,863
5
$57,230
1
$17,460
0
$0
APPLICATIONS DENIED
0
$0
3
$60,303
21
$78,200
18
$45,455
1
$24,730
APPLICATIONS WITHDRAWN
1
$91,180
2
$27,405
17
$97,285
4
$44,742
0
$0
FILES CLOSED FOR INCOMPLETENESS
0
$0
1
$112,040
3
$102,497
1
$45,100
0
$0
Aggregated Statistics For Year 2005 (Based on 2 partial tracts)
A) FHA, FSA/RHS & VA Home Purchase Loans
B) Conventional Home Purchase Loans
C) Refinancings
D) Home Improvement Loans
F) Non-occupant Loans on < 5 Family Dwellings (A B C & D)
G) Loans On Manufactured Home Dwelling (A B C & D)
Number
Average Value
Number
Average Value
Number
Average Value
Number
Average Value
Number
Average Value
Number
Average Value
LOANS ORIGINATED
13
$112,632
37
$118,497
32
$70,416
17
$34,149
3
$64,667
0
$0
APPLICATIONS APPROVED, NOT ACCEPTED
0
$0
2
$155,200
3
$82,127
3
$24,733
0
$0
0
$0
APPLICATIONS DENIED
0
$0
4
$92,392
23
$73,150
9
$44,781
0
$0
2
$29,830
APPLICATIONS WITHDRAWN
0
$0
1
$159,570
17
$89,782
2
$90,210
1
$52,380
0
$0
FILES CLOSED FOR INCOMPLETENESS
0
$0
0
$0
5
$94,188
0
$0
0
$0
0
$0
Aggregated Statistics For Year 2004 (Based on 2 partial tracts)
A) FHA, FSA/RHS & VA Home Purchase Loans
B) Conventional Home Purchase Loans
C) Refinancings
D) Home Improvement Loans
F) Non-occupant Loans on < 5 Family Dwellings (A B C & D)
Number
Average Value
Number
Average Value
Number
Average Value
Number
Average Value
Number
Average Value
LOANS ORIGINATED
12
$93,767
26
$95,918
45
$70,034
16
$23,552
2
$45,590
APPLICATIONS APPROVED, NOT ACCEPTED
0
$0
3
$96,517
8
$78,691
2
$19,155
0
$0
APPLICATIONS DENIED
0
$0
3
$102,337
36
$78,274
7
$23,280
0
$0
APPLICATIONS WITHDRAWN
1
$68,390
3
$82,450
26
$86,778
1
$121,250
0
$0
FILES CLOSED FOR INCOMPLETENESS
0
$0
0
$0
4
$82,692
0
$0
0
$0
Aggregated Statistics For Year 2003 (Based on 2 partial tracts)
A) FHA, FSA/RHS & VA Home Purchase Loans
B) Conventional Home Purchase Loans
C) Refinancings
D) Home Improvement Loans
F) Non-occupant Loans on < 5 Family Dwellings (A B C & D)
Number
Average Value
Number
Average Value
Number
Average Value
Number
Average Value
Number
Average Value
LOANS ORIGINATED
12
$82,046
21
$102,635
86
$74,645
9
$17,352
1
$64,020
APPLICATIONS APPROVED, NOT ACCEPTED
1
$116,880
1
$70,810
7
$68,870
0
$0
0
$0
APPLICATIONS DENIED
1
$58,200
2
$67,415
30
$65,960
9
$13,957
0
$0
APPLICATIONS WITHDRAWN
0
$0
1
$161,510
16
$86,058
2
$31,765
0
$0
FILES CLOSED FOR INCOMPLETENESS
0
$0
0
$0
4
$79,782
0
$0
0
$0
Aggregated Statistics For Year 2002 (Based on 2 partial tracts)
A) FHA, FSA/RHS & VA Home Purchase Loans
B) Conventional Home Purchase Loans
C) Refinancings
D) Home Improvement Loans
F) Non-occupant Loans on < 5 Family Dwellings (A B C & D)
Number
Average Value
Number
Average Value
Number
Average Value
Number
Average Value
Number
Average Value
LOANS ORIGINATED
12
$81,399
20
$91,180
54
$67,792
15
$18,042
2
$57,470
APPLICATIONS APPROVED, NOT ACCEPTED
0
$0
0
$0
6
$62,242
2
$7,275
0
$0
APPLICATIONS DENIED
0
$0
0
$0
25
$60,606
3
$15,683
2
$36,375
APPLICATIONS WITHDRAWN
0
$0
1
$102,330
17
$70,468
0
$0
1
$67,900
FILES CLOSED FOR INCOMPLETENESS
0
$0
0
$0
5
$68,190
0
$0
0
$0
Aggregated Statistics For Year 2001 (Based on 2 partial tracts)
A) FHA, FSA/RHS & VA Home Purchase Loans
B) Conventional Home Purchase Loans
C) Refinancings
D) Home Improvement Loans
F) Non-occupant Loans on < 5 Family Dwellings (A B C & D)
Number
Average Value
Number
Average Value
Number
Average Value
Number
Average Value
Number
Average Value
LOANS ORIGINATED
14
$77,843
25
$76,552
33
$68,150
12
$12,852
2
$36,375
APPLICATIONS APPROVED, NOT ACCEPTED
0
$0
1
$69,840
2
$87,300
0
$0
0
$0
APPLICATIONS DENIED
1
$118,830
6
$47,287
18
$58,604
5
$18,332
1
$60,140
APPLICATIONS WITHDRAWN
0
$0
2
$95,545
18
$73,235
1
$41,710
0
$0
FILES CLOSED FOR INCOMPLETENESS
0
$0
0
$0
2
$86,570
0
$0
0
$0
Aggregated Statistics For Year 2000 (Based on 2 partial tracts)
A) FHA, FSA/RHS & VA Home Purchase Loans
B) Conventional Home Purchase Loans
C) Refinancings
D) Home Improvement Loans
F) Non-occupant Loans on < 5 Family Dwellings (A B C & D)
Number
Average Value
Number
Average Value
Number
Average Value
Number
Average Value
Number
Average Value
LOANS ORIGINATED
12
$69,477
19
$67,696
6
$48,095
13
$14,736
2
$41,710
APPLICATIONS APPROVED, NOT ACCEPTED
0
$0
1
$31,520
6
$59,332
5
$12,028
0
$0
APPLICATIONS DENIED
0
$0
3
$54,967
14
$45,139
6
$18,673
1
$32,010
APPLICATIONS WITHDRAWN
0
$0
0
$0
7
$56,467
1
$33,950
0
$0
FILES CLOSED FOR INCOMPLETENESS
0
$0
0
$0
3
$67,900
0
$0
0
$0
Aggregated Statistics For Year 1999 (Based on 1 partial tract)
A) FHA, FSA/RHS & VA Home Purchase Loans
B) Conventional Home Purchase Loans
C) Refinancings
D) Home Improvement Loans
F) Non-occupant Loans on < 5 Family Dwellings (A B C & D)
Detailed PMIC statistics for the following Tracts:0154.00
2002 - 2018 National Fire Incident Reporting System (NFIRS) incidents
Based on the data from the years 2002 - 2018 the average number of fires per year is 17. The highest number of fires - 39 took place in 2007, and the least - 1 in 2002. The data has an increasing trend.
When looking into fire subcategories, the most reports belonged to: Structure Fires (66.6%), and Outside Fires (20.3%).
Fire incident types reported to NFIRS in Zip Code 13116


 Nearest zip codes: 13057, 13066, 13082, 13214, 13030, 13206.
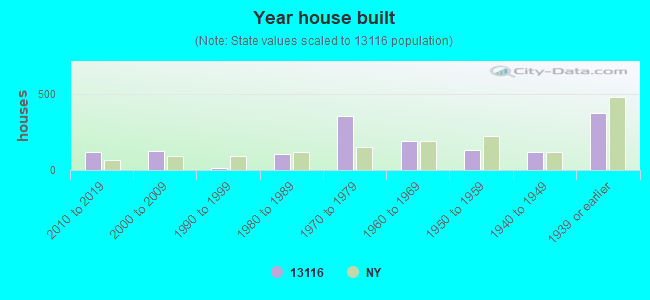


 Based on the data from the years 2002 - 2018 the average number of fires per year is 17. The highest number of fires - 39 took place in 2007, and the least - 1 in 2002. The data has an increasing trend.
 When looking into fire subcategories, the most reports belonged to: Structure Fires (66.6%), and Outside Fires (20.3%).