Estimated zip code population in 2022: 1,302 Zip code population in 2010: 1,531 Zip code population in 2000: 1,576
Houses and condos: 841 Renter-occupied apartments: 78
% of renters here:
17%
State:
46%
March 2022 cost of living index in zip code 13144: 93.4 (less than average, U.S. average is 100)
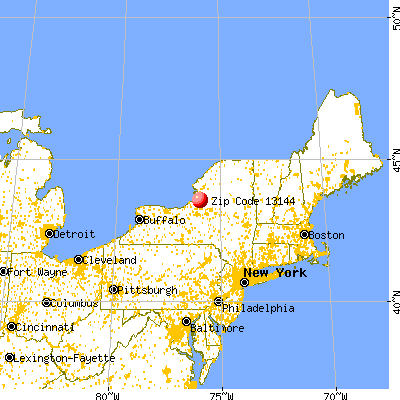
Land area: 38.4 sq. mi. Water area: 0.7 sq. mi.
Population density: 34 people per square mile
(very low).
OSM Map
General Map
Google Map
MSN Map
OSM Map
General Map
Google Map
MSN Map
OSM Map
General Map
Google Map
MSN Map
OSM Map
General Map
Google Map
MSN Map
Please wait while loading the map...
Real estate property taxes paid for housing units in 2022:
This zip code:
2.0% ($1,891)
New York:
1.5% ($6,180)
Median real estate property taxes paid for housing units with mortgages in 2022: $2,217 (1.9%) Median real estate property taxes paid for housing units with no mortgage in 2022: $1,726 (3.5%)
Business Search- 14 Million verified businesses
Males: 645
(49.6%)
Females: 656
(50.4%)
For population 25 years and over in 13144:
High school or higher: 78.3%
Bachelor's degree or higher: 12.8%
Graduate or professional degree: 3.5%
Unemployed: 6.0%
Mean travel time to work (commute): 26.6 minutes
For population 15 years and over in 13144:
Never married: 22.6%
Now married: 54.9%
Separated: 2.6%
Widowed: 6.0%
Divorced: 13.9%
Zip code 13144 compared to state average:
Median household income below state average.
Median house value significantly below state average.
Black race population percentage significantly below state average.
Hispanic race population percentage significantly below state average.
Foreign-born population percentage significantly below state average.
Renting percentage significantly below state average.
Length of stay since moving in significantly above state average.
Number of college students below state average.
Percentage of population with a bachelor's degree or higher significantly below state average.
Averages for the 2020 tax year for zip code 13144, filed in 2021:
Average Adjusted Gross Income (AGI) in 2020: $46,255 (Individual Income Tax Returns)
Here:
$46,255
State:
$90,930
Salary/wage: $42,793 (reported on 80.4% of returns)
Here:
$42,793
State:
$72,104
(% of AGI for various income ranges: 992.9% for AGIs below $25k, 2892.1% for AGIs $25k-50k, 5765.7% for AGIs $50k-75k, 9170.0% for AGIs $75k-100k, 16832.5% for AGIs $100k-200k)
Taxable interest for individuals: $300 (reported on 21.4% of returns)
This zip code:
$300
New York:
$3,075
(% of AGI for various income ranges: 1.2% for AGIs below $25k, 10.7% for AGIs $25k-50k, 17.1% for AGIs $50k-75k, 17.5% for AGIs $100k-200k)
Ordinary dividends: $840 (reported on 8.9% of returns)
Here:
$840
State:
$11,095
(% of AGI for various income ranges: 7.1% for AGIs below $25k, 42.9% for AGIs $50k-75k)
Net capital gain/loss in AGI: +$750 (reported on 7.1% of returns)
Here:
+$750
State:
+$44,925
(% of AGI for various income ranges: 42.9% for AGIs $50k-75k)
Profit/loss from business: +$4,360 (reported on 8.9% of returns)
Here:
+$4,360
State:
+$14,940
(% of AGI for various income ranges: 155.7% for AGIs $25k-50k)
Taxable individual retirement arrangement distribution: $12,400 (reported on 7.1% of returns)
13144:
$12,400
New York:
$19,609
(% of AGI for various income ranges: 354.3% for AGIs $25k-50k)
Earned income credit: $2,280 (reported on 17.9% of returns)
Here:
$2,280
State:
$2,138
(% of AGI for various income ranges: 74.1% for AGIs below $25k, 72.9% for AGIs $25k-50k)
Percentage of individuals using paid preparers for their 2020 taxes: 94.6%
Here:
95%
State:
95%
(% for various income ranges: 90.5% for AGIs below $25k, 93.8% for AGIs $25k-50k, 100.0% for AGIs $50k-75k, 100.0% for AGIs $75k-100k, 100.0% for AGIs $100k-200k)
Averages for the 2012 tax year for zip code 13144, filed in 2013:
Average Adjusted Gross Income (AGI) in 2012: $39,162 (Individual Income Tax Returns)
Here:
$39,162
State:
$77,088
Salary/wage: $35,596 (reported on 81.8% of returns)
Here:
$35,596
State:
$60,593
(% of AGI for various income ranges: 69.8% for AGIs below $25k, 73.0% for AGIs $25k-50k, 81.9% for AGIs $50k-75k, 83.0% for AGIs $75k-100k, 64.4% for AGIs $100k-200k)
Taxable interest for individuals: $240 (reported on 27.3% of returns)
This zip code:
$240
New York:
$3,125
(% of AGI for various income ranges: 0.4% for AGIs $25k-50k, 0.1% for AGIs $100k-200k)
Ordinary dividends: $417 (reported on 10.9% of returns)
Here:
$417
State:
$10,299
Net capital gain/loss in AGI: +$8,233 (reported on 5.5% of returns)
Here:
+$8,233
State:
+$42,474
Profit/loss from business: +$3,833 (reported on 10.9% of returns)
Here:
+$3,833
State:
+$16,168
Taxable individual retirement arrangement distribution: $9,075 (reported on 7.3% of returns)
13144:
$9,075
New York:
$17,621
Total itemized deductions: $17,167 (22% of AGI, reported on 16.4% of returns)
Here:
$17,167
State:
$34,985
Here:
21.8% of AGI
State:
21.3% of AGI
(% of AGI for various income ranges: 7.5% for AGIs $25k-50k, 7.9% for AGIs $50k-75k, 9.8% for AGIs $75k-100k, 8.8% for AGIs $100k-200k)
Charity contributions: $1,933 (reported on 10.9% of returns)
Here:
$1,933
State:
$5,572
Taxes paid: $6,644 (reported on 16.4% of returns)
13144:
$6,644
State:
$18,656
(% of AGI for various income ranges: 1.8% for AGIs $25k-50k, 2.7% for AGIs $50k-75k, 4.3% for AGIs $75k-100k, 4.7% for AGIs $100k-200k)
Earned income credit: $2,307 (reported on 25.5% of returns)
Here:
$2,307
State:
$2,230
(% of AGI for various income ranges: 7.7% for AGIs below $25k, 1.6% for AGIs $25k-50k)
Percentage of individuals using paid preparers for their 2012 taxes: 56.4%
Here:
56%
State:
66%
(% for various income ranges: 52.0% for AGIs below $25k, 53.3% for AGIs $25k-50k, 62.5% for AGIs $50k-75k, 75.0% for AGIs $75k-100k, 66.7% for AGIs $100k-200k)
Averages for the 2004 tax year for zip code 13144, filed in 2005:
Average Adjusted Gross Income (AGI) in 2004: $29,747 (Individual Income Tax Returns)
Here:
$29,747
State:
$59,519
Salary/wage: $28,758 (reported on 86.7% of returns)
Here:
$28,758
State:
$50,673
(% of AGI for various income ranges: 82.4% for AGIs below $10k, 79.1% for AGIs $10k-25k, 84.2% for AGIs $25k-50k, 85.6% for AGIs $50k-75k, 86.8% for AGIs $75k-100k, 81.8% for AGIs over 100k)
Taxable interest for individuals: $596 (reported on 28.3% of returns)
This zip code:
$596
New York:
$2,377
(% of AGI for various income ranges: 3.8% for AGIs below $10k, 0.3% for AGIs $10k-25k, 0.3% for AGIs $25k-50k, 0.9% for AGIs $50k-75k, 0.2% for AGIs $75k-100k)
Taxable dividends: $424 (reported on 11.1% of returns)
Here:
$424
State:
$5,394
Net capital gain/loss: +$452 (reported on 5.8% of returns)
Here:
+$452
State:
+$23,581
Profit/loss from business: +$2,842 (reported on 10.7% of returns)
Here:
+$2,842
State:
+$13,809
Total itemized deductions: $14,548 (22% of AGI, reported on 15.8% of returns)
Here:
$14,548
State:
$25,864
Here:
22.1% of AGI
State:
21.9% of AGI
(% of AGI for various income ranges: 6.0% for AGIs $25k-50k, 12.9% for AGIs $50k-75k, 10.9% for AGIs $75k-100k, 11.3% for AGIs over 100k)
Charity contributions deductions: $2,016 (3% of AGI, reported on 12.0% of returns)
Here:
$2,016
State:
$4,439
Here:
3.0% of AGI
State:
3.6% of AGI
Total tax: $3,241 (reported on 68.5% of returns)
13144:
$3,241
State:
$11,730
(% of AGI for various income ranges: 2.7% for AGIs below $10k, 3.8% for AGIs $10k-25k, 5.5% for AGIs $25k-50k, 7.6% for AGIs $50k-75k, 11.8% for AGIs $75k-100k, 14.7% for AGIs over 100k)
Earned income credit: $1,699 (reported on 25.0% of returns)
Here:
$1,699
State:
$1,757
Percentage of individuals using paid preparers for their 2004 taxes: 60.8%
Here:
61%
State:
67%
(% for various income ranges: 47.6% for AGIs below $10k, 60.8% for AGIs $10k-25k, 71.2% for AGIs $25k-50k, 58.5% for AGIs $50k-75k, 110.7% for AGIs $75k-100k)
Household received Food Stamps/SNAP in the past 12 months: 122 Household did not receive Food Stamps/SNAP in the past 12 months: 355
Women who had a birth in the past 12 months: 37 (13 now married, 25 unmarried) Women who did not have a birth in the past 12 months: 160 (94 now married, 64 unmarried)
Housing units in zip code 13144 with a mortgage: 187 (35 second mortgage, 25 both second mortgage and home equity loan) Houses without a mortgage: 10
Median monthly owner costs for units with a mortgage: $1,267 Median monthly owner costs for units without a mortgage: $550
Residents with income below the poverty level in 2022:
This zip code:
26.5%
Whole state:
14.3%
Residents with income below 50% of the poverty level in 2022:
This zip code:
15.2%
Whole state:
6.8%
Median number of rooms in houses and condos:
Here:
6.5
State:
6.3
Median number of rooms in apartments:
Here:
5.2
State:
3.8
Notable locations in this zip code not listed on our city pages
Notable locations in zip code 13144: Beulah Park Campground (A), Bennett Ridge (B), Castor Corners (C), Orwell Volunteer Fire Company (D), Cogswell Free Library (E). Display/hide their locations on the map
Churches in zip code 13144 include: Vorea Community Church (A), Greater Victory Fellowship Church (B), Richland Christian Church (C). Display/hide their locations on the map
Cemeteries: Potter Cemetery (1), Richland Village Cemetery (2), Gilbert Hill Cemetery (3), Stowell Drive Cemetery (4), Pekin Cemetery (5), Chateaugay Cemetery (6), Evergreen Cemetery (7). Display/hide their locations on the map
In group quarters: 27 (-1 institutionalized population)
Size of family households: 103 2-persons, 102 3-persons, 20 4-persons, 42 5-persons, 32 6-persons, 18 7-or-more-persons
Size of nonfamily households: 129 1-person, 17 2-persons, 2 3-persons
186 married couples with children.
36 single-parent households (32 men, 4 women).
97.9% of residents of 13144 zip code speak English at home.
1.7% of residents speak other Indo-European language at home (80% very well, 20% well).
Foreign born population: 26 (2.1%) (67.8% of them are naturalized citizens)
This zip code:
2.1%
Whole state:
22.7%
46%France
31%South Africa
30%English
25%German
9%Italian
9%American
8%French Canadian
5%Irish
2%Eastern European
Year of entry for the foreign-born population
42010 or later
02000 to 2009
01990 to 1999
21Before 1990
Housing units lacking complete plumbing facilities: 7.8% Housing units lacking complete kitchen facilities: 11.0%
35.5%Bottled, tank, or LP gas
26.5%Fuel oil, kerosene, etc.
21.1%Wood
10.0%Electricity
3.5%Coal or coke
3.3%Other fuel
0.7%No fuel used
Population in 1990: 1,267. Population change in the 1990s: +309 (+24.4%).
Place of birth for U.S.-born residents:
This state: 1,118
Northeast: 32
Midwest: 34
South: 63
West: 22
65% of the 13144 zip code residents lived in the same house 5 years ago. Out of people who lived in different houses, 62% lived in this county. Out of people who lived in different counties, 50% lived in New York.
90% of the 13144 zip code residents lived in the same house 1 year ago. Out of people who lived in different houses, 64% moved from this county. Out of people who lived in different houses, 25% moved from different county within same state. Out of people who lived in different houses, 2% moved from different state. Out of people who lived in different houses, 5% moved from abroad.
Private vs. public school enrollment:
Students in private schools in grades 1 to 8 (elementary and middle school): 36
Here:
26.3%
New York:
15.6%
Students in private schools in grades 9 to 12 (high school): 6
Here:
6.3%
New York:
15.0%
Students in private undergraduate colleges: 4
Here:
18.8%
New York:
39.2%
Occupation by median earnings in the past 12 months ($)
221,463Computer and mathematical occupations
92,192Business and financial operations occupations
71,919Health diagnosing and treating practitioners and other technical occupations
54,771Management occupations
35,186Education, training, and library occupations
33,242Sales and related occupations
Companies with federal contracts located in this zip code:
HUFF & PUFF EXCAVATING CO INC (1509 COUNTY RT 2 in RICHLAND, NY; small business)
$6,690 with Army for Maintenance, Repair or Alteration of Real Property -- Family Housing Facilities. Signed on 2003-09-30. Completion date: 2003-10-29.
Top industries in this zip code by the number of employees in 2005:
Other Services (except Public Administration): Religious Organizations (5-9 employees: 1 establishment)
Construction: Flooring Contractors (1-4: 1)
Arts, Entertainment, and Recreation: Golf Courses and Country Clubs (1-4: 1)
Other Services (except Public Administration): Pet Care (except Veterinary) Services (1-4: 1)
Construction: All Other Specialty Trade Contractors (1-4: 1)
Health Care and Social Assistance: Other Individual and Family Services (1-4: 1)
People in group quarters in 2010:
78 people in emergency and transitional shelters (with sleeping facilities) for people experiencing homelessness
People in group quarters in 2000:
81 people in homes or halfway houses for drug/alcohol abuse
Home Mortgage Disclosure Act Aggregated Statistics For Year 2009 (Based on 2 partial tracts)
A) FHA, FSA/RHS & VA Home Purchase Loans
B) Conventional Home Purchase Loans
C) Refinancings
D) Home Improvement Loans
F) Non-occupant Loans on < 5 Family Dwellings (A B C & D)
G) Loans On Manufactured Home Dwelling (A B C & D)
Number
Average Value
Number
Average Value
Number
Average Value
Number
Average Value
Number
Average Value
Number
Average Value
LOANS ORIGINATED
1
$86,880
4
$81,490
7
$76,740
6
$16,977
3
$48,337
1
$43,140
APPLICATIONS APPROVED, NOT ACCEPTED
0
$0
0
$0
2
$103,660
0
$0
0
$0
0
$0
APPLICATIONS DENIED
1
$90,780
2
$70,405
7
$80,250
3
$22,670
1
$71,300
3
$43,343
APPLICATIONS WITHDRAWN
1
$47,640
1
$162,980
3
$102,863
0
$0
0
$0
0
$0
FILES CLOSED FOR INCOMPLETENESS
0
$0
0
$0
0
$0
0
$0
0
$0
0
$0
Aggregated Statistics For Year 2008 (Based on 2 partial tracts)
A) FHA, FSA/RHS & VA Home Purchase Loans
B) Conventional Home Purchase Loans
C) Refinancings
D) Home Improvement Loans
F) Non-occupant Loans on < 5 Family Dwellings (A B C & D)
G) Loans On Manufactured Home Dwelling (A B C & D)
Number
Average Value
Number
Average Value
Number
Average Value
Number
Average Value
Number
Average Value
Number
Average Value
LOANS ORIGINATED
2
$92,275
6
$74,750
7
$72,076
6
$36,452
4
$93,175
2
$64,865
APPLICATIONS APPROVED, NOT ACCEPTED
0
$0
2
$63,515
1
$49,730
0
$0
1
$75,200
1
$110,850
APPLICATIONS DENIED
1
$91,080
4
$90,330
14
$75,713
8
$25,541
4
$63,140
3
$57,923
APPLICATIONS WITHDRAWN
0
$0
1
$57,520
5
$91,498
1
$73,100
1
$45,540
1
$91,680
FILES CLOSED FOR INCOMPLETENESS
0
$0
0
$0
0
$0
0
$0
0
$0
0
$0
Aggregated Statistics For Year 2007 (Based on 2 partial tracts)
A) FHA, FSA/RHS & VA Home Purchase Loans
B) Conventional Home Purchase Loans
C) Refinancings
D) Home Improvement Loans
F) Non-occupant Loans on < 5 Family Dwellings (A B C & D)
G) Loans On Manufactured Home Dwelling (A B C & D)
Number
Average Value
Number
Average Value
Number
Average Value
Number
Average Value
Number
Average Value
Number
Average Value
LOANS ORIGINATED
3
$99,767
11
$72,721
7
$86,370
6
$28,362
4
$83,065
3
$52,630
APPLICATIONS APPROVED, NOT ACCEPTED
0
$0
1
$90,180
2
$80,890
2
$67,260
1
$73,100
1
$17,080
APPLICATIONS DENIED
0
$0
6
$67,560
8
$84,749
9
$34,188
1
$108,160
5
$43,442
APPLICATIONS WITHDRAWN
0
$0
1
$71,900
9
$74,034
1
$62,020
1
$31,160
1
$39,550
FILES CLOSED FOR INCOMPLETENESS
0
$0
0
$0
0
$0
0
$0
0
$0
0
$0
Aggregated Statistics For Year 2006 (Based on 2 partial tracts)
A) FHA, FSA/RHS & VA Home Purchase Loans
B) Conventional Home Purchase Loans
C) Refinancings
D) Home Improvement Loans
F) Non-occupant Loans on < 5 Family Dwellings (A B C & D)
G) Loans On Manufactured Home Dwelling (A B C & D)
Number
Average Value
Number
Average Value
Number
Average Value
Number
Average Value
Number
Average Value
Number
Average Value
LOANS ORIGINATED
1
$99,170
12
$66,936
10
$62,107
13
$23,092
6
$79,293
4
$43,892
APPLICATIONS APPROVED, NOT ACCEPTED
0
$0
2
$55,575
3
$80,293
2
$24,565
1
$47,340
0
$0
APPLICATIONS DENIED
0
$0
7
$69,464
14
$90,137
14
$44,683
3
$65,313
4
$39,548
APPLICATIONS WITHDRAWN
0
$0
4
$68,160
12
$86,634
3
$40,947
1
$80,290
0
$0
FILES CLOSED FOR INCOMPLETENESS
0
$0
1
$78,200
1
$175,570
0
$0
0
$0
0
$0
Aggregated Statistics For Year 2005 (Based on 2 partial tracts)
A) FHA, FSA/RHS & VA Home Purchase Loans
B) Conventional Home Purchase Loans
C) Refinancings
D) Home Improvement Loans
F) Non-occupant Loans on < 5 Family Dwellings (A B C & D)
G) Loans On Manufactured Home Dwelling (A B C & D)
Number
Average Value
Number
Average Value
Number
Average Value
Number
Average Value
Number
Average Value
Number
Average Value
LOANS ORIGINATED
3
$75,600
12
$62,092
13
$77,158
10
$23,758
4
$60,968
5
$53,030
APPLICATIONS APPROVED, NOT ACCEPTED
0
$0
1
$74,900
2
$76,100
1
$12,280
0
$0
0
$0
APPLICATIONS DENIED
0
$0
4
$52,955
28
$79,298
7
$28,590
1
$41,940
6
$55,127
APPLICATIONS WITHDRAWN
0
$0
1
$85,990
16
$73,102
1
$94,670
1
$38,350
1
$111,150
FILES CLOSED FOR INCOMPLETENESS
0
$0
1
$133,020
2
$94,225
1
$29,960
0
$0
0
$0
Aggregated Statistics For Year 2004 (Based on 2 partial tracts)
A) FHA, FSA/RHS & VA Home Purchase Loans
B) Conventional Home Purchase Loans
C) Refinancings
D) Home Improvement Loans
F) Non-occupant Loans on < 5 Family Dwellings (A B C & D)
G) Loans On Manufactured Home Dwelling (A B C & D)
Number
Average Value
Number
Average Value
Number
Average Value
Number
Average Value
Number
Average Value
Number
Average Value
LOANS ORIGINATED
3
$65,413
11
$72,231
12
$68,858
5
$27,024
3
$59,120
2
$51,080
APPLICATIONS APPROVED, NOT ACCEPTED
0
$0
1
$110,250
4
$83,888
1
$7,190
0
$0
1
$85,390
APPLICATIONS DENIED
1
$54,230
2
$70,705
15
$70,186
6
$25,815
3
$45,240
2
$48,835
APPLICATIONS WITHDRAWN
1
$40,750
1
$136,920
14
$85,194
2
$61,420
0
$0
2
$89,730
FILES CLOSED FOR INCOMPLETENESS
0
$0
0
$0
1
$130,030
1
$18,870
0
$0
0
$0
Aggregated Statistics For Year 2003 (Based on 2 partial tracts)
A) FHA, FSA/RHS & VA Home Purchase Loans
B) Conventional Home Purchase Loans
C) Refinancings
D) Home Improvement Loans
F) Non-occupant Loans on < 5 Family Dwellings (A B C & D)
Number
Average Value
Number
Average Value
Number
Average Value
Number
Average Value
Number
Average Value
LOANS ORIGINATED
2
$54,675
8
$56,924
18
$60,769
7
$10,700
2
$57,975
APPLICATIONS APPROVED, NOT ACCEPTED
0
$0
1
$22,470
2
$55,125
1
$26,070
0
$0
APPLICATIONS DENIED
0
$0
3
$58,423
16
$56,793
5
$18,396
1
$23,670
APPLICATIONS WITHDRAWN
0
$0
1
$55,130
9
$74,134
2
$16,480
0
$0
FILES CLOSED FOR INCOMPLETENESS
0
$0
0
$0
1
$92,580
0
$0
0
$0
Aggregated Statistics For Year 2002 (Based on 2 partial tracts)
A) FHA, FSA/RHS & VA Home Purchase Loans
B) Conventional Home Purchase Loans
C) Refinancings
D) Home Improvement Loans
F) Non-occupant Loans on < 5 Family Dwellings (A B C & D)
Number
Average Value
Number
Average Value
Number
Average Value
Number
Average Value
Number
Average Value
LOANS ORIGINATED
3
$69,007
8
$61,680
15
$56,365
8
$10,224
2
$26,515
APPLICATIONS APPROVED, NOT ACCEPTED
0
$0
2
$43,440
4
$78,045
1
$12,280
0
$0
APPLICATIONS DENIED
1
$17,680
8
$51,869
13
$61,648
3
$18,177
1
$13,180
APPLICATIONS WITHDRAWN
0
$0
2
$66,510
8
$58,048
1
$20,970
0
$0
FILES CLOSED FOR INCOMPLETENESS
0
$0
0
$0
2
$66,810
0
$0
0
$0
Aggregated Statistics For Year 2001 (Based on 2 partial tracts)
A) FHA, FSA/RHS & VA Home Purchase Loans
B) Conventional Home Purchase Loans
C) Refinancings
D) Home Improvement Loans
F) Non-occupant Loans on < 5 Family Dwellings (A B C & D)
Number
Average Value
Number
Average Value
Number
Average Value
Number
Average Value
Number
Average Value
LOANS ORIGINATED
1
$61,720
8
$60,969
11
$66,375
6
$9,887
2
$59,620
APPLICATIONS APPROVED, NOT ACCEPTED
0
$0
1
$80,590
3
$45,340
1
$21,270
0
$0
APPLICATIONS DENIED
0
$0
6
$48,335
15
$54,687
5
$8,328
1
$35,350
APPLICATIONS WITHDRAWN
0
$0
1
$91,080
11
$53,601
1
$21,870
1
$44,040
FILES CLOSED FOR INCOMPLETENESS
0
$0
0
$0
1
$34,150
0
$0
0
$0
Aggregated Statistics For Year 2000 (Based on 2 partial tracts)
A) FHA, FSA/RHS & VA Home Purchase Loans
B) Conventional Home Purchase Loans
C) Refinancings
D) Home Improvement Loans
F) Non-occupant Loans on < 5 Family Dwellings (A B C & D)
Number
Average Value
Number
Average Value
Number
Average Value
Number
Average Value
Number
Average Value
LOANS ORIGINATED
2
$66,810
10
$44,191
6
$44,590
10
$16,538
2
$25,315
APPLICATIONS APPROVED, NOT ACCEPTED
0
$0
5
$45,898
2
$81,190
2
$16,180
0
$0
APPLICATIONS DENIED
0
$0
27
$32,434
10
$52,160
4
$34,828
1
$56,030
APPLICATIONS WITHDRAWN
0
$0
1
$31,160
7
$44,256
1
$20,970
0
$0
FILES CLOSED FOR INCOMPLETENESS
0
$0
0
$0
1
$81,790
0
$0
0
$0
Aggregated Statistics For Year 1999 (Based on 1 partial tract)
A) FHA, FSA/RHS & VA Home Purchase Loans
B) Conventional Home Purchase Loans
C) Refinancings
D) Home Improvement Loans
F) Non-occupant Loans on < 5 Family Dwellings (A B C & D)


 Nearest zip codes: 13302, 13083, 13493, 13142, 13145, 13437.


