Estimated zip code population in 2022: 1,569 Zip code population in 2010: 1,926 Zip code population in 2000: 1,874
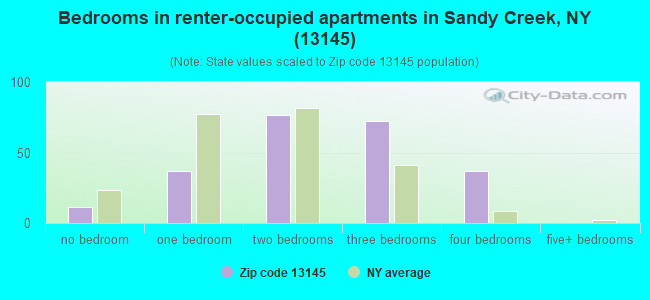
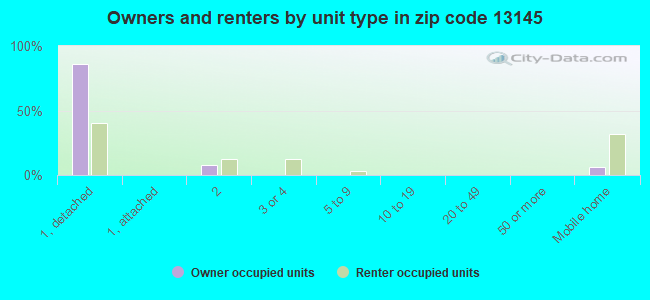
Houses and condos: 1,059 Renter-occupied apartments: 236
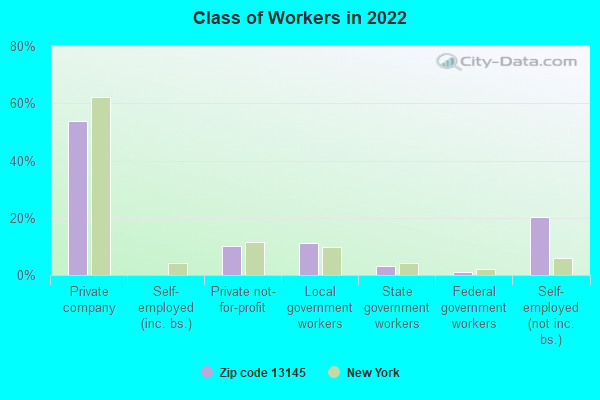
% of renters here:
33%
State:
46%
March 2022 cost of living index in zip code 13145: 95.1 (less than average, U.S. average is 100)
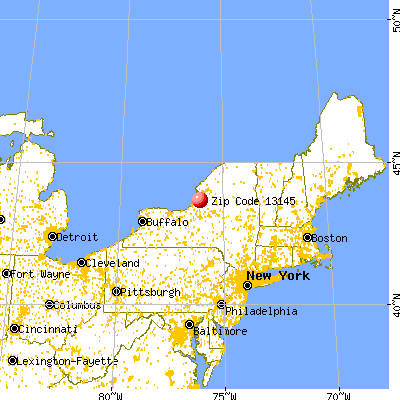
Land area: 16.7 sq. mi. Water area: 0.1 sq. mi.
Population density: 94 people per square mile
(very low).
OSM Map
General Map
Google Map
MSN Map
OSM Map
General Map
Google Map
MSN Map
OSM Map
General Map
Google Map
MSN Map
OSM Map
General Map
Google Map
MSN Map
Please wait while loading the map...
Real estate property taxes paid for housing units in 2022:
This zip code:
2.0% ($2,868)
New York:
1.5% ($6,180)
Median real estate property taxes paid for housing units with mortgages in 2022: $3,181 (2.0%) Median real estate property taxes paid for housing units with no mortgage in 2022: $2,480 (1.8%)
Business Search- 14 Million verified businesses
Males: 898
(57.3%)
Females: 670
(42.7%)
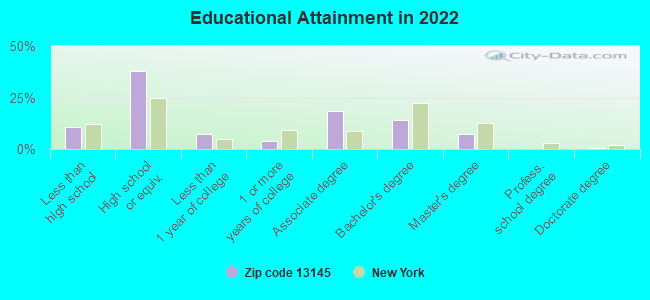
For population 25 years and over in 13145:
High school or higher: 88.1%
Bachelor's degree or higher: 21.9%
Graduate or professional degree: 7.9%
Unemployed: 10.8%
Mean travel time to work (commute): 28.5 minutes
For population 15 years and over in 13145:
Never married: 26.4%
Now married: 52.5%
Separated: 0.6%
Widowed: 7.1%
Divorced: 13.4%
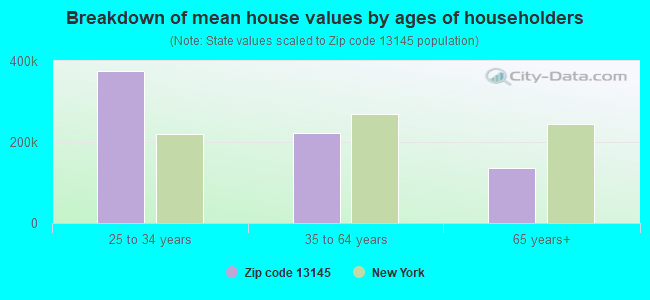
Zip code 13145 compared to state average:
Median household income below state average.
Median house value significantly below state average.
Unemployed percentage above state average.
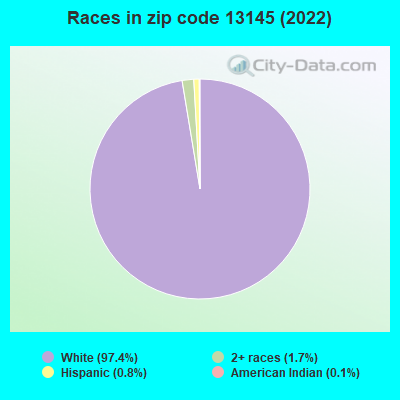
Black race population percentage significantly below state average.
Hispanic race population percentage significantly below state average.
Median age above state average.
Foreign-born population percentage significantly below state average.
Length of stay since moving in significantly above state average.
Number of college students significantly below state average.
Percentage of population with a bachelor's degree or higher below state average.
Averages for the 2020 tax year for zip code 13145, filed in 2021:
Average Adjusted Gross Income (AGI) in 2020: $55,244 (Individual Income Tax Returns)
Here:
$55,244
State:
$90,930
Salary/wage: $50,593 (reported on 75.3% of returns)
Here:
$50,593
State:
$72,104
(% of AGI for various income ranges: 987.5% for AGIs below $25k, 3232.2% for AGIs $25k-50k, 5890.9% for AGIs $50k-75k, 8433.3% for AGIs $75k-100k, 18205.0% for AGIs $100k-200k)
Taxable interest for individuals: $428 (reported on 32.6% of returns)
This zip code:
$428
New York:
$3,075
(% of AGI for various income ranges: 15.5% for AGIs below $25k, 10.6% for AGIs $25k-50k, 24.5% for AGIs $50k-75k, 45.0% for AGIs $75k-100k, 25.0% for AGIs $100k-200k)
Ordinary dividends: $1,173 (reported on 12.4% of returns)
Here:
$1,173
State:
$11,095
(% of AGI for various income ranges: 32.5% for AGIs below $25k, 37.3% for AGIs $50k-75k, 28.7% for AGIs $100k-200k)
Net capital gain/loss in AGI: +$3,582 (reported on 12.4% of returns)
Here:
+$3,582
State:
+$44,925
(% of AGI for various income ranges: 29.0% for AGIs below $25k, 70.0% for AGIs $50k-75k, 323.8% for AGIs $100k-200k)
Profit/loss from business: +$6,291 (reported on 12.4% of returns)
Here:
+$6,291
State:
+$14,940
(% of AGI for various income ranges: 80.5% for AGIs below $25k, 96.1% for AGIs $25k-50k, 109.1% for AGIs $50k-75k, 396.7% for AGIs $75k-100k)
Taxable individual retirement arrangement distribution: $15,367 (reported on 10.1% of returns)
13145:
$15,367
New York:
$19,609
(% of AGI for various income ranges: 76.0% for AGIs below $25k, 190.0% for AGIs $25k-50k, 427.3% for AGIs $50k-75k, 523.8% for AGIs $100k-200k)
Total itemized deductions: $16,533 (reported on 3.4% of returns)
Here:
$16,533
State:
$39,326
(% of AGI for various income ranges: 450.9% for AGIs $50k-75k)
Taxes paid: $8,350 (reported on 2.2% of returns)
13145:
$8,350
State:
$9,183
(% of AGI for various income ranges: 151.8% for AGIs $50k-75k)
Earned income credit: $1,979 (reported on 15.7% of returns)
Here:
$1,979
State:
$2,138
(% of AGI for various income ranges: 70.5% for AGIs below $25k, 75.6% for AGIs $25k-50k)
Percentage of individuals using paid preparers for their 2020 taxes: 95.5%
Here:
96%
State:
95%
(% for various income ranges: 96.4% for AGIs below $25k, 95.7% for AGIs $25k-50k, 93.8% for AGIs $50k-75k, 100.0% for AGIs $75k-100k, 92.9% for AGIs $100k-200k)
Averages for the 2012 tax year for zip code 13145, filed in 2013:
Average Adjusted Gross Income (AGI) in 2012: $44,143 (Individual Income Tax Returns)
Here:
$44,143
State:
$77,088
Salary/wage: $39,623 (reported on 81.6% of returns)
Here:
$39,623
State:
$60,593
(% of AGI for various income ranges: 68.3% for AGIs below $25k, 71.6% for AGIs $25k-50k, 80.8% for AGIs $50k-75k, 72.0% for AGIs $75k-100k, 72.3% for AGIs $100k-200k)
Taxable interest for individuals: $464 (reported on 32.2% of returns)
This zip code:
$464
New York:
$3,125
(% of AGI for various income ranges: 1.0% for AGIs below $25k, 0.3% for AGIs $25k-50k, 0.4% for AGIs $50k-75k, 0.4% for AGIs $75k-100k)
Ordinary dividends: $950 (reported on 16.1% of returns)
Here:
$950
State:
$10,299
(% of AGI for various income ranges: 0.4% for AGIs below $25k, 0.8% for AGIs $25k-50k, 0.5% for AGIs $50k-75k, 0.1% for AGIs $100k-200k)
Net capital gain/loss in AGI: +$1,433 (reported on 10.3% of returns)
Here:
+$1,433
State:
+$42,474
(% of AGI for various income ranges: 2.7% for AGIs below $25k, 2.1% for AGIs $75k-100k)
Profit/loss from business: +$4,008 (reported on 13.8% of returns)
Here:
+$4,008
State:
+$16,168
(% of AGI for various income ranges: 6.6% for AGIs below $25k, 0.8% for AGIs $25k-50k, 1.7% for AGIs $75k-100k)
Taxable individual retirement arrangement distribution: $11,700 (reported on 11.5% of returns)
13145:
$11,700
New York:
$17,621
(% of AGI for various income ranges: 3.2% for AGIs below $25k, 6.0% for AGIs $25k-50k, 8.4% for AGIs $75k-100k)
Total itemized deductions: $19,505 (23% of AGI, reported on 24.1% of returns)
Here:
$19,505
State:
$34,985
Here:
22.9% of AGI
State:
21.3% of AGI
(% of AGI for various income ranges: 5.9% for AGIs below $25k, 7.9% for AGIs $25k-50k, 10.4% for AGIs $50k-75k, 9.8% for AGIs $75k-100k, 15.0% for AGIs $100k-200k)
Charity contributions: $1,993 (reported on 16.1% of returns)
Here:
$1,993
State:
$5,572
(% of AGI for various income ranges: 0.9% for AGIs $25k-50k, 1.1% for AGIs $50k-75k, 1.1% for AGIs $100k-200k)
Taxes paid: $7,857 (reported on 24.1% of returns)
13145:
$7,857
State:
$18,656
(% of AGI for various income ranges: 1.6% for AGIs below $25k, 2.3% for AGIs $25k-50k, 4.4% for AGIs $50k-75k, 4.4% for AGIs $75k-100k, 6.5% for AGIs $100k-200k)
Earned income credit: $2,200 (reported on 20.7% of returns)
Here:
$2,200
State:
$2,230
(% of AGI for various income ranges: 6.6% for AGIs below $25k, 1.1% for AGIs $25k-50k)
Percentage of individuals using paid preparers for their 2012 taxes: 59.8%
Here:
60%
State:
66%
(% for various income ranges: 55.3% for AGIs below $25k, 57.1% for AGIs $25k-50k, 66.7% for AGIs $50k-75k, 71.4% for AGIs $75k-100k, 66.7% for AGIs $100k-200k)
Averages for the 2004 tax year for zip code 13145, filed in 2005:
Average Adjusted Gross Income (AGI) in 2004: $34,017 (Individual Income Tax Returns)
Here:
$34,017
State:
$59,519
Salary/wage: $31,853 (reported on 82.2% of returns)
Here:
$31,853
State:
$50,673
(% of AGI for various income ranges: 105.0% for AGIs below $10k, 68.6% for AGIs $10k-25k, 73.5% for AGIs $25k-50k, 79.3% for AGIs $50k-75k, 83.5% for AGIs $75k-100k, 73.3% for AGIs over 100k)
Taxable interest for individuals: $910 (reported on 42.0% of returns)
This zip code:
$910
New York:
$2,377
(% of AGI for various income ranges: 1.1% for AGIs below $10k, 2.3% for AGIs $10k-25k, 1.4% for AGIs $25k-50k, 1.1% for AGIs $50k-75k, 0.4% for AGIs $75k-100k, 0.5% for AGIs over 100k)
Taxable dividends: $987 (reported on 18.6% of returns)
Here:
$987
State:
$5,394
(% of AGI for various income ranges: 0.3% for AGIs below $10k, 1.3% for AGIs $10k-25k, 0.7% for AGIs $25k-50k, 0.1% for AGIs $50k-75k, 0.5% for AGIs $75k-100k, 0.4% for AGIs over 100k)
Net capital gain/loss: +$1,457 (reported on 11.2% of returns)
Here:
+$1,457
State:
+$23,581
(% of AGI for various income ranges: 1.2% for AGIs $10k-25k, 1.0% for AGIs $25k-50k, 0.3% for AGIs $50k-75k, 0.0% for AGIs over 100k)
Profit/loss from business: +$2,856 (reported on 15.7% of returns)
Here:
+$2,856
State:
+$13,809
(% of AGI for various income ranges: 5.3% for AGIs below $10k, 3.8% for AGIs $10k-25k, 0.9% for AGIs $25k-50k, 0.8% for AGIs $50k-75k, 1.4% for AGIs $75k-100k)
Total itemized deductions: $15,351 (23% of AGI, reported on 23.0% of returns)
Here:
$15,351
State:
$25,864
Here:
23.2% of AGI
State:
21.9% of AGI
(% of AGI for various income ranges: 8.4% for AGIs $10k-25k, 7.8% for AGIs $25k-50k, 12.1% for AGIs $50k-75k, 10.8% for AGIs $75k-100k, 15.1% for AGIs over 100k)
Charity contributions deductions: $1,799 (3% of AGI, reported on 20.7% of returns)
Here:
$1,799
State:
$4,439
Here:
2.6% of AGI
State:
3.6% of AGI
(% of AGI for various income ranges: 0.5% for AGIs $10k-25k, 0.8% for AGIs $25k-50k, 0.9% for AGIs $50k-75k, 1.2% for AGIs $75k-100k, 2.5% for AGIs over 100k)
Total tax: $4,250 (reported on 68.9% of returns)
13145:
$4,250
State:
$11,730
(% of AGI for various income ranges: 2.5% for AGIs below $10k, 3.5% for AGIs $10k-25k, 6.5% for AGIs $25k-50k, 8.3% for AGIs $50k-75k, 11.1% for AGIs $75k-100k, 15.1% for AGIs over 100k)
Earned income credit: $1,584 (reported on 19.7% of returns)
Here:
$1,584
State:
$1,757
Percentage of individuals using paid preparers for their 2004 taxes: 66.0%
Here:
66%
State:
67%
(% for various income ranges: 59.5% for AGIs below $10k, 65.3% for AGIs $10k-25k, 65.4% for AGIs $25k-50k, 74.2% for AGIs $50k-75k, 76.4% for AGIs $75k-100k, 68.6% for AGIs over 100k)
Household received Food Stamps/SNAP in the past 12 months: 176 Household did not receive Food Stamps/SNAP in the past 12 months: 554
Women who had a birth in the past 12 months: 4 (0 now married, 4 unmarried) Women who did not have a birth in the past 12 months: 284 (161 now married, 120 unmarried)
Housing units in zip code 13145 with a mortgage: 225 (27 second mortgage, 27 both second mortgage and home equity loan) Houses without a mortgage: 31
Median monthly owner costs for units with a mortgage: $1,177 Median monthly owner costs for units without a mortgage: $539
Residents with income below the poverty level in 2022:
This zip code:
26.8%
Whole state:
14.3%
Residents with income below 50% of the poverty level in 2022:
This zip code:
11.7%
Whole state:
6.8%
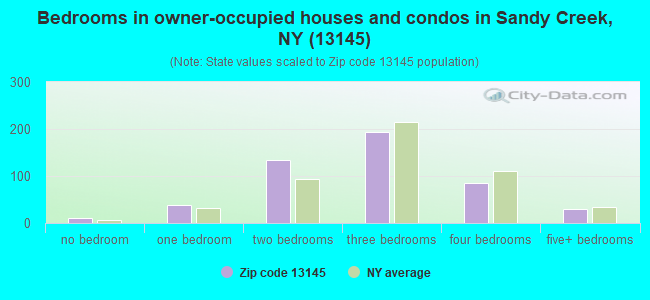
Median number of rooms in houses and condos:
Here:
6.1
State:
6.3
Median number of rooms in apartments:
Here:
4.4
State:
3.8
Notable locations in this zip code not listed on our city pages
Notable locations in zip code 13145: Seber Shore Marina (A), Reiters Marina (B), Freemans Marina (C), Hemlock Haven Tree Farm (D), Sandy Pond Corners (E), Elms Golf Club (F), Sandy Creek Fire Department (G), Annie Porter Ainsworth Memorial Library (H). Display/hide their locations on the map
Size of family households: 225 2-persons, 77 3-persons, 60 4-persons, 66 5-persons, 6 6-persons
Size of nonfamily households: 234 1-person, 55 2-persons
157 married couples with children.
183 single-parent households (161 men, 22 women).
99.8% of residents of 13145 zip code speak English at home.
0.2% of residents speak Spanish at home (100% very well).
0.2% of residents speak other Indo-European language at home (100% very well).
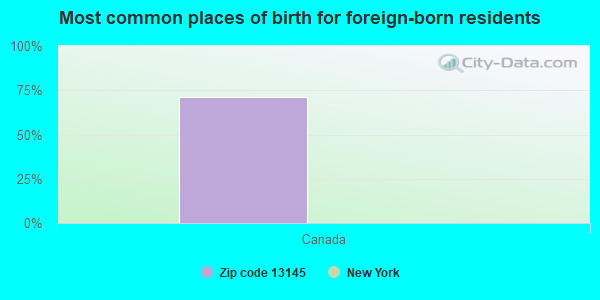
Foreign born population: 8 (0.5%) (100.0% of them are naturalized citizens)
This zip code:
0.5%
Whole state:
22.7%
71%Canada
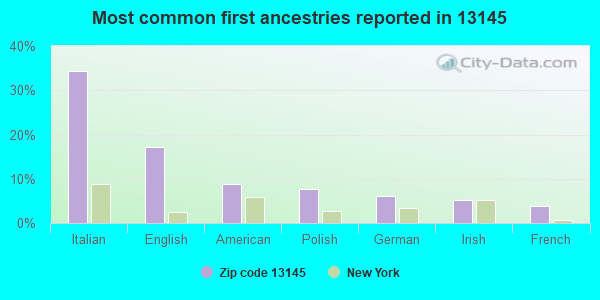
34%Italian
17%English
9%American
8%Polish
6%German
5%Irish
4%French
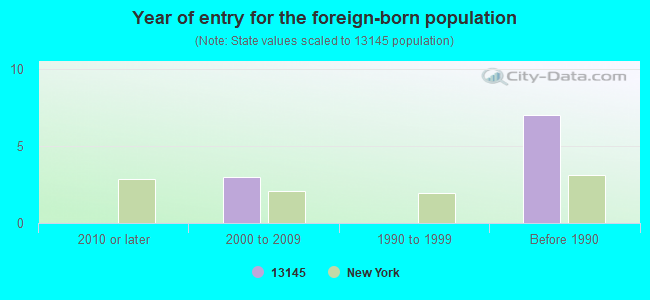
Year of entry for the foreign-born population
02010 or later
32000 to 2009
01990 to 1999
7Before 1990
Facilities with environmental interests located in this zip code:
CORNER LAUNDRY (MAIN & LAKE ST in SANDY CREEK, NY)
STATE MASTER (New York facility tracking) - National Pollutant Discharge Elimination System Permit, National Pollutant Discharge Elimination System NON-MAJOR (Tracking pollutant discharge elimination systems) - permit Business SIC classification: COIN-OPERATED LAUNDRIES AND DRYCLEANING Business NAICS classification: COIN-OPERATED LAUNDRIES AND DRYCLEANERS. Organizations: HESS, KATHERINE L (CONTACT/OWNER)
Alternative names: HESS, KATHERINE L
CORNER LAUNDRY ( in SANDY CREEK, NY)
National Pollutant Discharge Elimination System NON-MAJOR (Tracking pollutant discharge elimination systems) - permit Organizations: HESS. J M & K L (CONTACT/OWNER)
Alternative names: HESS, J M & K L, SANDY CK LAUNDRY
Housing units lacking complete plumbing facilities: 2.3% Housing units lacking complete kitchen facilities: 3.0%
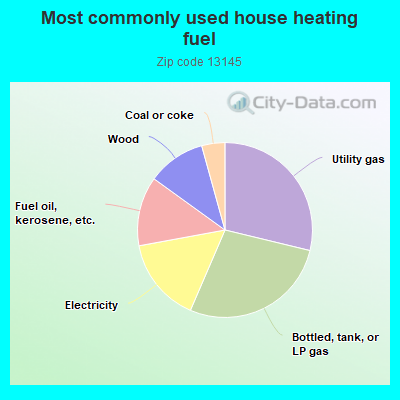
28.9%Utility gas
27.8%Bottled, tank, or LP gas
15.7%Electricity
12.9%Fuel oil, kerosene, etc.
10.8%Wood
4.3%Coal or coke
Population in 1990: 801. Population change in the 1990s: +1,073 (+134.0%).
Place of birth for U.S.-born residents:
This state: 1,379
Northeast: 49
Midwest: 21
South: 54
West: 50
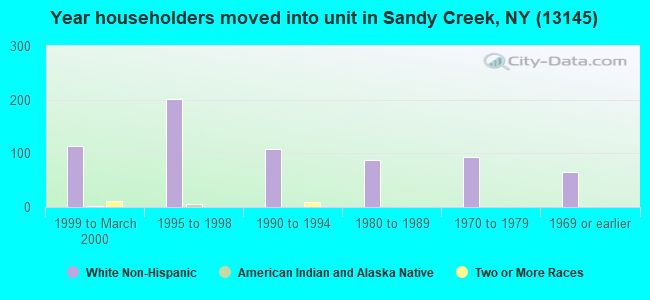
60% of the 13145 zip code residents lived in the same house 5 years ago. Out of people who lived in different houses, 59% lived in this county. Out of people who lived in different counties, 50% lived in New York.
94% of the 13145 zip code residents lived in the same house 1 year ago. Out of people who lived in different houses, 61% moved from this county. Out of people who lived in different houses, 10% moved from different county within same state. Out of people who lived in different houses, 26% moved from different state.
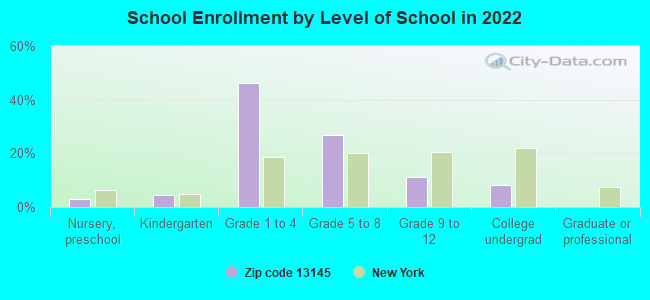
Private vs. public school enrollment:
Students in private schools in grades 1 to 8 (elementary and middle school):
Here:
0.0%
New York:
15.6%
Students in private schools in grades 9 to 12 (high school):
Here:
0.0%
New York:
15.0%
Students in private undergraduate colleges: 15
Here:
71.2%
New York:
39.2%
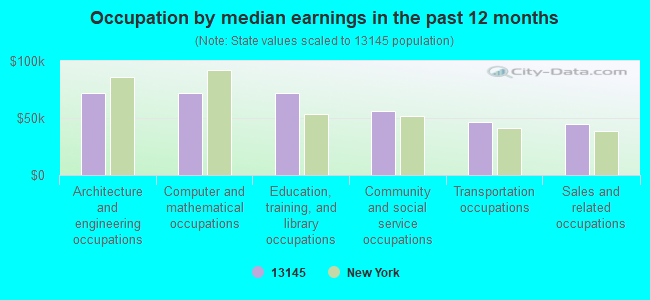
Occupation by median earnings in the past 12 months ($)
71,978Architecture and engineering occupations
71,888Computer and mathematical occupations
71,545Education, training, and library occupations
56,014Community and social service occupations
46,663Transportation occupations
44,633Sales and related occupations
Top industries in this zip code by the number of employees in 2005:
Other Services (except Public Administration): General Automotive Repair (10-19 employees: 1 establishment)
Accommodation and Food Services: Bed-and-Breakfast Inns (10-19: 1)
Wholesale Trade: Farm and Garden Machinery and Equipment Merchant Wholesalers (10-19: 1)
Construction: Siding Contractors (5-9: 1)
Other Services (except Public Administration): Religious Organizations (1-4: 2)
Accommodation and Food Services: Full-Service Restaurants (1-4: 2)
Arts, Entertainment, and Recreation: Marinas (1-4: 1)
Home Mortgage Disclosure Act Aggregated Statistics For Year 2009 (Based on 2 partial tracts)
A) FHA, FSA/RHS & VA Home Purchase Loans
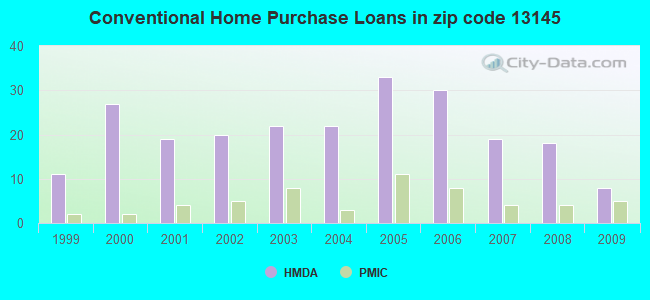
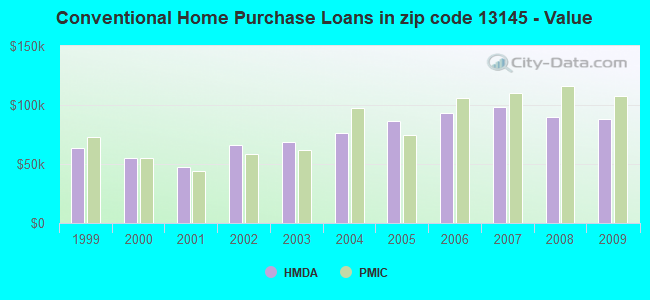
B) Conventional Home Purchase Loans
C) Refinancings
D) Home Improvement Loans
F) Non-occupant Loans on < 5 Family Dwellings (A B C & D)
G) Loans On Manufactured Home Dwelling (A B C & D)
Number
Average Value
Number
Average Value
Number
Average Value
Number
Average Value
Number
Average Value
Number
Average Value
LOANS ORIGINATED
8
$108,875
8
$88,141
22
$99,008
8
$25,000
9
$93,668
3
$56,427
APPLICATIONS APPROVED, NOT ACCEPTED
1
$65,530
1
$70,990
1
$120,140
1
$7,510
0
$0
1
$70,990
APPLICATIONS DENIED
0
$0
5
$132,834
14
$93,662
12
$44,142
5
$117,134
2
$58,360
APPLICATIONS WITHDRAWN
1
$81,230
1
$54,610
9
$99,204
0
$0
2
$98,975
0
$0
FILES CLOSED FOR INCOMPLETENESS
0
$0
1
$105,120
2
$114,335
1
$47,780
1
$109,220
0
$0
Aggregated Statistics For Year 2008 (Based on 2 partial tracts)
A) FHA, FSA/RHS & VA Home Purchase Loans
B) Conventional Home Purchase Loans
C) Refinancings
D) Home Improvement Loans
F) Non-occupant Loans on < 5 Family Dwellings (A B C & D)
G) Loans On Manufactured Home Dwelling (A B C & D)
Number
Average Value
Number
Average Value
Number
Average Value
Number
Average Value
Number
Average Value
Number
Average Value
LOANS ORIGINATED
7
$88,640
18
$89,534
17
$112,468
6
$39,477
9
$111,340
4
$46,930
APPLICATIONS APPROVED, NOT ACCEPTED
0
$0
2
$68,600
4
$79,522
0
$0
1
$113,990
1
$105,800
APPLICATIONS DENIED
1
$154,270
6
$81,570
31
$115,447
13
$37,753
8
$153,756
4
$77,988
APPLICATIONS WITHDRAWN
3
$114,223
1
$148,120
10
$92,492
2
$63,825
1
$47,780
0
$0
FILES CLOSED FOR INCOMPLETENESS
1
$105,120
1
$61,430
3
$59,840
0
$0
1
$126,280
1
$47,780
Aggregated Statistics For Year 2007 (Based on 2 partial tracts)
A) FHA, FSA/RHS & VA Home Purchase Loans
B) Conventional Home Purchase Loans
C) Refinancings
D) Home Improvement Loans
F) Non-occupant Loans on < 5 Family Dwellings (A B C & D)
G) Loans On Manufactured Home Dwelling (A B C & D)
Number
Average Value
Number
Average Value
Number
Average Value
Number
Average Value
Number
Average Value
Number
Average Value
LOANS ORIGINATED
8
$100,428
19
$98,043
23
$76,807
20
$32,970
10
$68,874
10
$54,471
APPLICATIONS APPROVED, NOT ACCEPTED
1
$104,440
3
$104,667
2
$80,545
2
$17,065
1
$252,560
0
$0
APPLICATIONS DENIED
0
$0
11
$114,118
25
$75,441
14
$45,491
6
$54,267
5
$43,960
APPLICATIONS WITHDRAWN
2
$76,450
3
$77,590
12
$84,528
3
$46,190
1
$26,620
0
$0
FILES CLOSED FOR INCOMPLETENESS
0
$0
0
$0
1
$69,630
1
$40,960
0
$0
0
$0
Aggregated Statistics For Year 2006 (Based on 2 partial tracts)
A) FHA, FSA/RHS & VA Home Purchase Loans
B) Conventional Home Purchase Loans
C) Refinancings
D) Home Improvement Loans
F) Non-occupant Loans on < 5 Family Dwellings (A B C & D)
G) Loans On Manufactured Home Dwelling (A B C & D)
Number
Average Value
Number
Average Value
Number
Average Value
Number
Average Value
Number
Average Value
Number
Average Value
LOANS ORIGINATED
5
$88,602
30
$92,834
27
$75,971
22
$34,254
13
$82,227
9
$43,687
APPLICATIONS APPROVED, NOT ACCEPTED
0
$0
5
$98,840
7
$74,891
2
$7,850
1
$152,220
2
$46,760
APPLICATIONS DENIED
1
$99,660
8
$55,205
27
$73,114
23
$36,297
4
$60,752
7
$42,321
APPLICATIONS WITHDRAWN
1
$58,700
5
$64,848
23
$87,462
4
$56,998
1
$13,650
1
$58,700
FILES CLOSED FOR INCOMPLETENESS
0
$0
1
$58,700
7
$93,321
1
$39,590
1
$102,390
1
$12,290
Aggregated Statistics For Year 2005 (Based on 2 partial tracts)
A) FHA, FSA/RHS & VA Home Purchase Loans
B) Conventional Home Purchase Loans
C) Refinancings
D) Home Improvement Loans
E) Loans on Dwellings For 5+ Families
F) Non-occupant Loans on < 5 Family Dwellings (A B C & D)
G) Loans On Manufactured Home Dwelling (A B C & D)
Number
Average Value
Number
Average Value
Number
Average Value
Number
Average Value
Number
Average Value
Number
Average Value
Number
Average Value
LOANS ORIGINATED
11
$80,175
33
$86,049
29
$80,523
14
$30,912
0
$0
12
$74,972
6
$49,033
APPLICATIONS APPROVED, NOT ACCEPTED
0
$0
3
$75,540
3
$76,680
1
$14,330
0
$0
0
$0
1
$45,050
APPLICATIONS DENIED
0
$0
11
$89,048
33
$91,799
10
$65,325
1
$20,480
3
$38,453
5
$73,584
APPLICATIONS WITHDRAWN
1
$149,490
3
$72,357
25
$96,001
3
$40,957
0
$0
3
$86,237
2
$93,175
FILES CLOSED FOR INCOMPLETENESS
0
$0
2
$110,240
5
$93,652
1
$47,780
0
$0
0
$0
0
$0
Aggregated Statistics For Year 2004 (Based on 2 partial tracts)
A) FHA, FSA/RHS & VA Home Purchase Loans
B) Conventional Home Purchase Loans
C) Refinancings
D) Home Improvement Loans
F) Non-occupant Loans on < 5 Family Dwellings (A B C & D)
G) Loans On Manufactured Home Dwelling (A B C & D)
Number
Average Value
Number
Average Value
Number
Average Value
Number
Average Value
Number
Average Value
Number
Average Value
LOANS ORIGINATED
9
$64,468
22
$76,079
29
$72,379
18
$19,909
8
$69,540
7
$42,809
APPLICATIONS APPROVED, NOT ACCEPTED
0
$0
2
$40,615
8
$73,806
2
$24,915
1
$51,880
3
$36,177
APPLICATIONS DENIED
0
$0
7
$44,077
31
$64,737
6
$38,795
2
$48,125
4
$55,290
APPLICATIONS WITHDRAWN
0
$0
6
$73,380
32
$78,904
2
$39,250
4
$82,082
2
$40,955
FILES CLOSED FOR INCOMPLETENESS
0
$0
1
$37,540
1
$53,930
1
$54,610
0
$0
0
$0
Aggregated Statistics For Year 2003 (Based on 2 partial tracts)
A) FHA, FSA/RHS & VA Home Purchase Loans
B) Conventional Home Purchase Loans
C) Refinancings
D) Home Improvement Loans
F) Non-occupant Loans on < 5 Family Dwellings (A B C & D)
Number
Average Value
Number
Average Value
Number
Average Value
Number
Average Value
Number
Average Value
LOANS ORIGINATED
3
$67,350
22
$68,539
47
$64,019
11
$22,402
8
$60,922
APPLICATIONS APPROVED, NOT ACCEPTED
0
$0
4
$61,945
5
$74,130
1
$13,650
0
$0
APPLICATIONS DENIED
1
$97,610
7
$61,727
46
$72,920
8
$23,379
2
$37,200
APPLICATIONS WITHDRAWN
0
$0
5
$44,096
27
$70,712
0
$0
1
$42,320
FILES CLOSED FOR INCOMPLETENESS
0
$0
1
$77,130
3
$104,893
2
$29,010
0
$0
Aggregated Statistics For Year 2002 (Based on 2 partial tracts)
A) FHA, FSA/RHS & VA Home Purchase Loans
B) Conventional Home Purchase Loans
C) Refinancings
D) Home Improvement Loans
F) Non-occupant Loans on < 5 Family Dwellings (A B C & D)
Number
Average Value
Number
Average Value
Number
Average Value
Number
Average Value
Number
Average Value
LOANS ORIGINATED
3
$77,133
20
$66,485
36
$67,369
8
$8,191
9
$70,080
APPLICATIONS APPROVED, NOT ACCEPTED
0
$0
4
$66,212
5
$58,704
1
$23,890
0
$0
APPLICATIONS DENIED
1
$57,340
7
$40,663
23
$48,197
3
$5,233
1
$23,890
APPLICATIONS WITHDRAWN
1
$105,800
3
$26,167
19
$56,189
2
$27,305
2
$57,680
FILES CLOSED FOR INCOMPLETENESS
0
$0
1
$43,000
2
$56,995
1
$20,480
1
$34,130
Aggregated Statistics For Year 2001 (Based on 2 partial tracts)
A) FHA, FSA/RHS & VA Home Purchase Loans
B) Conventional Home Purchase Loans
C) Refinancings
D) Home Improvement Loans
F) Non-occupant Loans on < 5 Family Dwellings (A B C & D)
Number
Average Value
Number
Average Value
Number
Average Value
Number
Average Value
Number
Average Value
LOANS ORIGINATED
8
$72,782
19
$47,351
29
$60,257
20
$16,041
13
$55,395
APPLICATIONS APPROVED, NOT ACCEPTED
0
$0
6
$50,853
5
$45,324
4
$30,205
3
$41,410
APPLICATIONS DENIED
2
$37,885
19
$33,519
27
$46,417
7
$18,333
0
$0
APPLICATIONS WITHDRAWN
0
$0
1
$140,620
14
$54,949
1
$4,780
2
$74,405
FILES CLOSED FOR INCOMPLETENESS
0
$0
0
$0
3
$43,687
0
$0
0
$0
Aggregated Statistics For Year 2000 (Based on 2 partial tracts)
A) FHA, FSA/RHS & VA Home Purchase Loans
B) Conventional Home Purchase Loans
C) Refinancings
D) Home Improvement Loans
F) Non-occupant Loans on < 5 Family Dwellings (A B C & D)
Number
Average Value
Number
Average Value
Number
Average Value
Number
Average Value
Number
Average Value
LOANS ORIGINATED
1
$63,480
27
$55,013
8
$59,301
21
$11,832
5
$87,918
APPLICATIONS APPROVED, NOT ACCEPTED
0
$0
5
$65,940
3
$66,667
5
$9,556
1
$133,790
APPLICATIONS DENIED
1
$45,730
12
$31,115
18
$63,596
8
$28,328
1
$62,800
APPLICATIONS WITHDRAWN
1
$40,960
3
$37,997
8
$34,728
1
$3,410
0
$0
FILES CLOSED FOR INCOMPLETENESS
0
$0
1
$39,590
3
$64,163
0
$0
0
$0
Aggregated Statistics For Year 1999 (Based on 1 partial tract)
A) FHA, FSA/RHS & VA Home Purchase Loans
B) Conventional Home Purchase Loans
C) Refinancings
D) Home Improvement Loans
F) Non-occupant Loans on < 5 Family Dwellings (A B C & D)
Detailed PMIC statistics for the following Tracts:0202.00
2003 - 2018 National Fire Incident Reporting System (NFIRS) incidents
Based on the data from the years 2003 - 2018 the average number of fires per year is 9. The highest number of reported fires - 26 took place in 2006, and the least - 1 in 2003. The data has a rising trend.
When looking into fire subcategories, the most reports belonged to: Structure Fires (61.7%), and Outside Fires (19.9%).
Fire incident types reported to NFIRS in Zip Code 13145


 Nearest zip codes: 13661, 13636, 13142, 13674, 13083, 13144.


 Based on the data from the years 2003 - 2018 the average number of fires per year is 9. The highest number of reported fires - 26 took place in 2006, and the least - 1 in 2003. The data has a rising trend.
 When looking into fire subcategories, the most reports belonged to: Structure Fires (61.7%), and Outside Fires (19.9%).