Estimated zip code population in 2022: 1,120 Zip code population in 2010: 905 Zip code population in 2000: 692
Houses and condos: 427 Renter-occupied apartments: 46
% of renters here:
12%
State:
46%
March 2022 cost of living index in zip code 13355: 94.9 (less than average, U.S. average is 100)
Land area: 29.1 sq. mi. Water area: 0.0 sq. mi.
Population density: 38 people per square mile
(very low).
OSM Map
General Map
Google Map
MSN Map
OSM Map
General Map
Google Map
MSN Map
OSM Map
General Map
Google Map
MSN Map
OSM Map
General Map
Google Map
MSN Map
Please wait while loading the map...
Median real estate property taxes paid for housing units with mortgages in 2022: $3,998 (1.8%) Median real estate property taxes paid for housing units with no mortgage in 2022: $994 (0.6%)
Business Search- 14 Million verified businesses
Males: 569
(50.8%)
Females: 550
(49.2%)
For population 25 years and over in 13355:
High school or higher: 78.0%
Bachelor's degree or higher: 13.1%
Graduate or professional degree: 6.6%
Mean travel time to work (commute): 25.8 minutes
For population 15 years and over in 13355:
Never married: 21.7%
Now married: 42.8%
Separated: 0.0%
Widowed: 6.7%
Divorced: 28.8%
Zip code 13355 compared to state average:
Median house value significantly below state average.
Unemployed percentage significantly below state average.
Black race population percentage significantly below state average.
Hispanic race population percentage significantly below state average.
Foreign-born population percentage significantly below state average.
Renting percentage significantly below state average.
Length of stay since moving in significantly below state average.
Number of rooms per house above state average.
Number of college students significantly below state average.
Percentage of population with a bachelor's degree or higher significantly below state average.
Estimated median house/condo value in 2022: $175,338
13355:
$175,338
New York:
$400,400
According to our research of New York and other state lists, there was 1 registered sex offender living in 13355 zip code as of May 28, 2024. The ratio of all residents to sex offenders in zip code 13355 is 896 to 1. The ratio of registered sex offenders to all residents in this zip code is near the state average.
Median resident age:
This zip code:
42.7 years
New York median age:
40.0 years
Average household size:
This zip code:
2.9 people
New York:
2.5 people
Averages for the 2020 tax year for zip code 13355, filed in 2021:
Average Adjusted Gross Income (AGI) in 2020: $53,880 (Individual Income Tax Returns)
Here:
$53,880
State:
$90,930
Salary/wage: $50,334 (reported on 80.0% of returns)
Here:
$50,334
State:
$72,104
(% of AGI for various income ranges: 1142.5% for AGIs below $25k, 3503.8% for AGIs $25k-50k, 6806.0% for AGIs $50k-75k, 12350.0% for AGIs $75k-100k, 21723.3% for AGIs $100k-200k)
Taxable interest for individuals: $680 (reported on 25.0% of returns)
This zip code:
$680
New York:
$3,075
(% of AGI for various income ranges: 20.0% for AGIs below $25k, 20.0% for AGIs $50k-75k, 140.0% for AGIs $100k-200k)
Ordinary dividends: $2,540 (reported on 12.5% of returns)
Here:
$2,540
State:
$11,095
(% of AGI for various income ranges: 17.5% for AGIs below $25k, 565.0% for AGIs $75k-100k)
Net capital gain/loss in AGI: +$2,780 (reported on 12.5% of returns)
Here:
+$2,780
State:
+$44,925
(% of AGI for various income ranges: 70.0% for AGIs below $25k, 415.0% for AGIs $75k-100k)
Profit/loss from business: +$4,925 (reported on 10.0% of returns)
Here:
+$4,925
State:
+$14,940
(% of AGI for various income ranges: 55.0% for AGIs below $25k, 306.0% for AGIs $50k-75k)
Taxable individual retirement arrangement distribution: $21,833 (reported on 7.5% of returns)
13355:
$21,833
New York:
$19,609
(% of AGI for various income ranges: 818.8% for AGIs $25k-50k)
Earned income credit: $1,857 (reported on 17.5% of returns)
Here:
$1,857
State:
$2,138
(% of AGI for various income ranges: 85.0% for AGIs below $25k, 77.5% for AGIs $25k-50k)
Percentage of individuals using paid preparers for their 2020 taxes: 95.0%
Here:
95%
State:
95%
(% for various income ranges: 91.7% for AGIs below $25k, 90.9% for AGIs $25k-50k, 100.0% for AGIs $50k-75k, 100.0% for AGIs $75k-100k, 100.0% for AGIs $100k-200k)
Averages for the 2012 tax year for zip code 13355, filed in 2013:
Average Adjusted Gross Income (AGI) in 2012: $40,535 (Individual Income Tax Returns)
Here:
$40,535
State:
$77,088
Salary/wage: $37,476 (reported on 82.5% of returns)
Here:
$37,476
State:
$60,593
(% of AGI for various income ranges: 65.3% for AGIs below $25k, 77.4% for AGIs $25k-50k, 79.1% for AGIs $50k-75k, 92.3% for AGIs $75k-100k, 69.1% for AGIs $100k-200k)
Taxable interest for individuals: $709 (reported on 27.5% of returns)
This zip code:
$709
New York:
$3,125
(% of AGI for various income ranges: 0.4% for AGIs below $25k, 0.2% for AGIs $25k-50k, 1.2% for AGIs $50k-75k, 0.9% for AGIs $75k-100k)
Ordinary dividends: $1,100 (reported on 12.5% of returns)
Here:
$1,100
State:
$10,299
Net capital gain/loss in AGI: +$33 (reported on 7.5% of returns)
Here:
+$33
State:
+$42,474
Profit/loss from business: +$5,883 (reported on 15.0% of returns)
Here:
+$5,883
State:
+$16,168
Taxable individual retirement arrangement distribution: $9,133 (reported on 7.5% of returns)
13355:
$9,133
New York:
$17,621
Total itemized deductions: $20,114 (22% of AGI, reported on 17.5% of returns)
Here:
$20,114
State:
$34,985
Here:
22.2% of AGI
State:
21.3% of AGI
(% of AGI for various income ranges: 11.1% for AGIs below $25k, 18.5% for AGIs $50k-75k, 12.7% for AGIs $100k-200k)
Charity contributions: $1,660 (reported on 12.5% of returns)
Here:
$1,660
State:
$5,572
Taxes paid: $8,429 (reported on 17.5% of returns)
13355:
$8,429
State:
$18,656
(% of AGI for various income ranges: 3.3% for AGIs below $25k, 7.7% for AGIs $50k-75k, 6.1% for AGIs $100k-200k)
Earned income credit: $2,262 (reported on 20.0% of returns)
Here:
$2,262
State:
$2,230
(% of AGI for various income ranges: 5.5% for AGIs below $25k, 1.6% for AGIs $25k-50k)
Percentage of individuals using paid preparers for their 2012 taxes: 57.5%
Here:
57%
State:
66%
(% for various income ranges: 52.9% for AGIs below $25k, 54.5% for AGIs $25k-50k, 66.7% for AGIs $50k-75k, 66.7% for AGIs $75k-100k, 66.7% for AGIs $100k-200k)
Averages for the 2004 tax year for zip code 13355, filed in 2005:
Average Adjusted Gross Income (AGI) in 2004: $39,512 (Individual Income Tax Returns)
Here:
$39,512
State:
$59,519
Salary/wage: $36,117 (reported on 84.2% of returns)
Here:
$36,117
State:
$50,673
(% of AGI for various income ranges: 72.0% for AGIs below $10k, 66.4% for AGIs $10k-25k, 87.6% for AGIs $25k-50k, 85.8% for AGIs $50k-75k, 89.6% for AGIs $75k-100k, 54.2% for AGIs over 100k)
Taxable interest for individuals: $792 (reported on 44.3% of returns)
This zip code:
$792
New York:
$2,377
(% of AGI for various income ranges: 1.5% for AGIs below $10k, 3.8% for AGIs $10k-25k, 0.5% for AGIs $25k-50k, 0.7% for AGIs $50k-75k, 0.3% for AGIs $75k-100k, 0.4% for AGIs over 100k)
Taxable dividends: $1,354 (reported on 19.3% of returns)
Here:
$1,354
State:
$5,394
(% of AGI for various income ranges: 1.0% for AGIs $10k-25k, 0.1% for AGIs $25k-50k, 0.3% for AGIs $50k-75k, 2.9% for AGIs $75k-100k)
Net capital gain/loss: +$11,042 (reported on 14.3% of returns)
Here:
+$11,042
State:
+$23,581
Profit/loss from business: +$4,946 (reported on 16.7% of returns)
Here:
+$4,946
State:
+$13,809
Profit/loss from farming: +$4,250 (reported on 3.6% of returns)
Here:
+$4,250
State:
-$2,666
Total itemized deductions: $15,400 (20% of AGI, reported on 20.8% of returns)
Here:
$15,400
State:
$25,864
Here:
19.6% of AGI
State:
21.9% of AGI
(% of AGI for various income ranges: 7.9% for AGIs $25k-50k, 9.1% for AGIs $50k-75k, 14.6% for AGIs $75k-100k, 7.6% for AGIs over 100k)
Charity contributions deductions: $2,322 (3% of AGI, reported on 17.6% of returns)
Here:
$2,322
State:
$4,439
Here:
2.7% of AGI
State:
3.6% of AGI
(% of AGI for various income ranges: 1.2% for AGIs $25k-50k, 0.4% for AGIs $50k-75k, 1.9% for AGIs $75k-100k, 1.5% for AGIs over 100k)
Total tax: $4,852 (reported on 72.3% of returns)
13355:
$4,852
State:
$11,730
(% of AGI for various income ranges: 3.0% for AGIs below $10k, 4.1% for AGIs $10k-25k, 6.0% for AGIs $25k-50k, 7.5% for AGIs $50k-75k, 9.1% for AGIs $75k-100k, 16.0% for AGIs over 100k)
Earned income credit: $1,955 (reported on 19.9% of returns)
Here:
$1,955
State:
$1,757
Percentage of individuals using paid preparers for their 2004 taxes: 67.0%
Here:
67%
State:
67%
(% for various income ranges: 57.4% for AGIs below $10k, 71.7% for AGIs $10k-25k, 62.8% for AGIs $25k-50k, 68.8% for AGIs $50k-75k, 80.0% for AGIs $75k-100k, 75.0% for AGIs over 100k)
Household received Food Stamps/SNAP in the past 12 months: 146 Household did not receive Food Stamps/SNAP in the past 12 months: 240
Women who had a birth in the past 12 months: 90 (89 now married, 0 unmarried) Women who did not have a birth in the past 12 months: 239 (49 now married, 191 unmarried)
Housing units in zip code 13355 with a mortgage: 243 (2 second mortgage, 2 both second mortgage and home equity loan) Median monthly owner costs for units with a mortgage: $1,492 Median monthly owner costs for units without a mortgage: $441
Residents with income below the poverty level in 2022:
This zip code:
5.5%
Whole state:
14.3%
Residents with income below 50% of the poverty level in 2022:
This zip code:
3.1%
Whole state:
6.8%
Median number of rooms in houses and condos:
Here:
7.0
State:
6.3
Median number of rooms in apartments:
Here:
6.1
State:
3.8
Notable locations in this zip code not listed on our city pages
In group quarters: 20 (-1 institutionalized population)
Size of family households: 84 2-persons, 133 3-persons, 37 4-persons, 8 5-persons
Size of nonfamily households: 48 1-person, 13 2-persons, 45 3-persons
107 married couples with children.
58 single-parent households (17 men, 41 women).
98.6% of residents of 13355 zip code speak English at home.
0.5% of residents speak Spanish at home (100% well).
0.4% of residents speak other Indo-European language at home (100% very well).
Foreign born population: 8 (0.8%) (56.8% of them are naturalized citizens)
This zip code:
0.8%
Whole state:
22.7%
50%Sweden
50%United Kingdom, excluding England and Scotland
21%Italian
14%Irish
12%American
10%German
8%English
7%Polish
4%British
Year of entry for the foreign-born population
02010 or later
42000 to 2009
01990 to 1999
3Before 1990
Facilities with environmental interests located in this zip code:
CRAVEN REFINISHING (62 WILLIAMS RD in HUBBARDSVILLE, NY)
Conditionally Exempt Small Quantity Generators, less than 100 kg/month of hazardous waste (Resource Conservation and Recovery Act (tracking hazardous waste)) - notification Organizations: THOMAS A CRAVEN SR (CONTACT/OWNER)
Housing units lacking complete plumbing facilities: 1.1% Housing units lacking complete kitchen facilities: 1.1%
43.6%Fuel oil, kerosene, etc.
41.7%Bottled, tank, or LP gas
10.9%Wood
3.3%Utility gas
1.1%Coal or coke
Population in 1990: 810.
Place of birth for U.S.-born residents:
This state: 1,072
Northeast: 18
Midwest: 10
South: 5
76% of the 13355 zip code residents lived in the same house 5 years ago. Out of people who lived in different houses, 49% lived in this county. Out of people who lived in different counties, 50% lived in New York.
98% of the 13355 zip code residents lived in the same house 1 year ago. Out of people who lived in different houses, 59% moved from this county. Out of people who lived in different houses, 29% moved from abroad.
Private vs. public school enrollment:
Students in private schools in grades 1 to 8 (elementary and middle school):
Here:
0.0%
New York:
15.6%
Students in private schools in grades 9 to 12 (high school):
Here:
0.0%
New York:
15.0%
Students in private undergraduate colleges:
Here:
0.0%
New York:
39.2%
Occupation by median earnings in the past 12 months ($)
91,367Health diagnosing and treating practitioners and other technical occupations
54,230Transportation occupations
46,603Office and administrative support occupations
36,652Sales and related occupations
36,467Management occupations
17,201Education, training, and library occupations
Top industries in this zip code by the number of employees in 2005:
Administrative and Support and Waste Management and Remediation Services: Professional Employer Organizations (10-19 employees: 1 establishment)
Construction: All Other Specialty Trade Contractors (5-9: 1)
Construction: Residential Remodelers (1-4: 2)
Other Services (except Public Administration): Other Personal and Household Goods Repair and Maintenance (1-4: 1)
Accommodation and Food Services: Recreational and Vacation Camps (except Campgrounds) (1-4: 1)
People in group quarters in 2010:
37 people in group homes intended for adults
People in group quarters in 2000:
36 people in nursing homes
Home Mortgage Disclosure Act Aggregated Statistics For Year 2009 (Based on 4 partial tracts)
A) FHA, FSA/RHS & VA Home Purchase Loans
B) Conventional Home Purchase Loans
C) Refinancings
D) Home Improvement Loans
F) Non-occupant Loans on < 5 Family Dwellings (A B C & D)
G) Loans On Manufactured Home Dwelling (A B C & D)
Number
Average Value
Number
Average Value
Number
Average Value
Number
Average Value
Number
Average Value
Number
Average Value
LOANS ORIGINATED
2
$109,210
9
$112,531
25
$111,762
6
$39,033
2
$216,550
3
$47,747
APPLICATIONS APPROVED, NOT ACCEPTED
1
$85,350
0
$0
1
$99,930
1
$30,240
0
$0
1
$76,110
APPLICATIONS DENIED
1
$157,870
2
$108,625
11
$96,638
4
$35,860
1
$23,910
2
$32,525
APPLICATIONS WITHDRAWN
1
$64,710
1
$24,610
5
$120,818
0
$0
1
$56,750
0
$0
FILES CLOSED FOR INCOMPLETENESS
0
$0
0
$0
0
$0
0
$0
0
$0
0
$0
Aggregated Statistics For Year 2008 (Based on 4 partial tracts)
A) FHA, FSA/RHS & VA Home Purchase Loans
B) Conventional Home Purchase Loans
C) Refinancings
D) Home Improvement Loans
F) Non-occupant Loans on < 5 Family Dwellings (A B C & D)
G) Loans On Manufactured Home Dwelling (A B C & D)
Number
Average Value
Number
Average Value
Number
Average Value
Number
Average Value
Number
Average Value
Number
Average Value
LOANS ORIGINATED
2
$105,335
14
$122,511
19
$96,453
5
$58,404
4
$97,872
4
$48,788
APPLICATIONS APPROVED, NOT ACCEPTED
0
$0
1
$60,340
3
$79,060
1
$18,600
0
$0
1
$31,890
APPLICATIONS DENIED
2
$75,555
2
$84,210
12
$96,045
13
$23,505
1
$33,370
2
$36,390
APPLICATIONS WITHDRAWN
0
$0
2
$187,005
6
$86,780
1
$39,120
1
$64,570
1
$93,440
FILES CLOSED FOR INCOMPLETENESS
0
$0
0
$0
1
$84,630
0
$0
0
$0
0
$0
Aggregated Statistics For Year 2007 (Based on 4 partial tracts)
A) FHA, FSA/RHS & VA Home Purchase Loans
B) Conventional Home Purchase Loans
C) Refinancings
D) Home Improvement Loans
F) Non-occupant Loans on < 5 Family Dwellings (A B C & D)
G) Loans On Manufactured Home Dwelling (A B C & D)
Number
Average Value
Number
Average Value
Number
Average Value
Number
Average Value
Number
Average Value
Number
Average Value
LOANS ORIGINATED
2
$99,080
17
$126,565
19
$66,623
7
$38,293
2
$115,595
4
$62,888
APPLICATIONS APPROVED, NOT ACCEPTED
0
$0
1
$156,730
3
$81,233
2
$27,615
1
$54,450
0
$0
APPLICATIONS DENIED
0
$0
6
$113,073
26
$108,085
15
$31,275
4
$90,668
3
$53,783
APPLICATIONS WITHDRAWN
0
$0
1
$148,640
8
$102,252
2
$68,700
0
$0
0
$0
FILES CLOSED FOR INCOMPLETENESS
0
$0
1
$44,120
3
$159,080
0
$0
0
$0
0
$0
Aggregated Statistics For Year 2006 (Based on 4 partial tracts)
A) FHA, FSA/RHS & VA Home Purchase Loans
B) Conventional Home Purchase Loans
C) Refinancings
D) Home Improvement Loans
F) Non-occupant Loans on < 5 Family Dwellings (A B C & D)
G) Loans On Manufactured Home Dwelling (A B C & D)
Number
Average Value
Number
Average Value
Number
Average Value
Number
Average Value
Number
Average Value
Number
Average Value
LOANS ORIGINATED
2
$57,400
21
$99,994
31
$72,278
15
$23,401
4
$127,592
7
$42,334
APPLICATIONS APPROVED, NOT ACCEPTED
0
$0
1
$71,040
5
$104,464
1
$28,180
1
$96,850
1
$31,190
APPLICATIONS DENIED
1
$42,680
4
$62,772
26
$87,253
9
$38,929
2
$64,125
3
$45,500
APPLICATIONS WITHDRAWN
0
$0
1
$96,850
16
$85,811
2
$67,085
1
$66,670
1
$64,450
FILES CLOSED FOR INCOMPLETENESS
0
$0
1
$103,390
5
$103,702
1
$4,840
1
$64,830
0
$0
Aggregated Statistics For Year 2005 (Based on 4 partial tracts)
A) FHA, FSA/RHS & VA Home Purchase Loans
B) Conventional Home Purchase Loans
C) Refinancings
D) Home Improvement Loans
F) Non-occupant Loans on < 5 Family Dwellings (A B C & D)
G) Loans On Manufactured Home Dwelling (A B C & D)
Number
Average Value
Number
Average Value
Number
Average Value
Number
Average Value
Number
Average Value
Number
Average Value
LOANS ORIGINATED
1
$56,360
21
$110,008
25
$72,506
13
$34,172
4
$108,785
6
$48,333
APPLICATIONS APPROVED, NOT ACCEPTED
0
$0
5
$92,180
5
$88,864
2
$32,805
1
$108,290
3
$50,040
APPLICATIONS DENIED
0
$0
6
$78,417
24
$85,509
10
$27,016
1
$47,990
4
$36,758
APPLICATIONS WITHDRAWN
0
$0
2
$146,510
18
$81,468
1
$143,640
2
$149,715
1
$55,850
FILES CLOSED FOR INCOMPLETENESS
1
$30,100
1
$77,160
4
$88,102
1
$17,780
1
$54,320
0
$0
Aggregated Statistics For Year 2004 (Based on 4 partial tracts)
A) FHA, FSA/RHS & VA Home Purchase Loans
B) Conventional Home Purchase Loans
C) Refinancings
D) Home Improvement Loans
F) Non-occupant Loans on < 5 Family Dwellings (A B C & D)
G) Loans On Manufactured Home Dwelling (A B C & D)
Number
Average Value
Number
Average Value
Number
Average Value
Number
Average Value
Number
Average Value
Number
Average Value
LOANS ORIGINATED
2
$128,455
25
$110,072
23
$82,427
16
$27,381
2
$136,070
5
$43,868
APPLICATIONS APPROVED, NOT ACCEPTED
0
$0
3
$49,140
6
$63,833
1
$43,300
1
$30,370
2
$28,840
APPLICATIONS DENIED
0
$0
5
$89,266
25
$71,406
12
$29,530
2
$63,490
6
$52,217
APPLICATIONS WITHDRAWN
0
$0
1
$103,690
15
$65,918
3
$26,707
1
$58,030
1
$42,680
FILES CLOSED FOR INCOMPLETENESS
0
$0
0
$0
6
$82,337
1
$31,460
0
$0
0
$0
Aggregated Statistics For Year 2003 (Based on 4 partial tracts)
A) FHA, FSA/RHS & VA Home Purchase Loans
B) Conventional Home Purchase Loans
C) Refinancings
D) Home Improvement Loans
F) Non-occupant Loans on < 5 Family Dwellings (A B C & D)
Number
Average Value
Number
Average Value
Number
Average Value
Number
Average Value
Number
Average Value
LOANS ORIGINATED
1
$103,250
16
$85,876
55
$78,961
7
$16,823
4
$77,900
APPLICATIONS APPROVED, NOT ACCEPTED
0
$0
2
$39,385
6
$61,572
1
$27,230
0
$0
APPLICATIONS DENIED
0
$0
3
$88,013
27
$63,238
6
$23,655
1
$91,770
APPLICATIONS WITHDRAWN
0
$0
1
$91,450
16
$65,212
1
$13,680
0
$0
FILES CLOSED FOR INCOMPLETENESS
0
$0
1
$134,010
2
$82,950
0
$0
0
$0
Aggregated Statistics For Year 2002 (Based on 4 partial tracts)
A) FHA, FSA/RHS & VA Home Purchase Loans
B) Conventional Home Purchase Loans
C) Refinancings
D) Home Improvement Loans
F) Non-occupant Loans on < 5 Family Dwellings (A B C & D)
Number
Average Value
Number
Average Value
Number
Average Value
Number
Average Value
Number
Average Value
LOANS ORIGINATED
2
$93,955
16
$80,451
33
$73,171
9
$13,946
2
$86,730
APPLICATIONS APPROVED, NOT ACCEPTED
0
$0
4
$47,940
4
$49,718
1
$5,550
0
$0
APPLICATIONS DENIED
0
$0
5
$48,584
17
$66,236
4
$14,428
0
$0
APPLICATIONS WITHDRAWN
0
$0
1
$42,950
11
$60,813
1
$39,730
0
$0
FILES CLOSED FOR INCOMPLETENESS
0
$0
0
$0
3
$73,590
0
$0
0
$0
Aggregated Statistics For Year 2001 (Based on 4 partial tracts)
A) FHA, FSA/RHS & VA Home Purchase Loans
B) Conventional Home Purchase Loans
C) Refinancings
D) Home Improvement Loans
F) Non-occupant Loans on < 5 Family Dwellings (A B C & D)
Number
Average Value
Number
Average Value
Number
Average Value
Number
Average Value
Number
Average Value
LOANS ORIGINATED
3
$48,830
14
$73,139
29
$67,015
9
$16,674
1
$113,380
APPLICATIONS APPROVED, NOT ACCEPTED
0
$0
4
$50,960
2
$67,200
2
$9,615
0
$0
APPLICATIONS DENIED
0
$0
7
$36,384
20
$46,616
9
$10,238
1
$65,040
APPLICATIONS WITHDRAWN
1
$28,480
1
$55,100
15
$54,375
2
$22,825
1
$19,150
FILES CLOSED FOR INCOMPLETENESS
0
$0
0
$0
2
$32,235
0
$0
0
$0
Aggregated Statistics For Year 2000 (Based on 4 partial tracts)
A) FHA, FSA/RHS & VA Home Purchase Loans
B) Conventional Home Purchase Loans
C) Refinancings
D) Home Improvement Loans
F) Non-occupant Loans on < 5 Family Dwellings (A B C & D)
Number
Average Value
Number
Average Value
Number
Average Value
Number
Average Value
Number
Average Value
LOANS ORIGINATED
2
$56,630
17
$55,845
14
$51,821
10
$14,224
1
$33,110
APPLICATIONS APPROVED, NOT ACCEPTED
0
$0
3
$51,137
4
$48,218
4
$12,515
0
$0
APPLICATIONS DENIED
0
$0
10
$45,265
15
$57,561
5
$18,100
1
$51,230
APPLICATIONS WITHDRAWN
0
$0
1
$60,460
9
$67,116
0
$0
0
$0
FILES CLOSED FOR INCOMPLETENESS
0
$0
1
$17,510
2
$22,505
0
$0
0
$0
Aggregated Statistics For Year 1999 (Based on 2 partial tracts)
A) FHA, FSA/RHS & VA Home Purchase Loans
B) Conventional Home Purchase Loans
C) Refinancings
D) Home Improvement Loans
F) Non-occupant Loans on < 5 Family Dwellings (A B C & D)


+$4,250
-$2,666
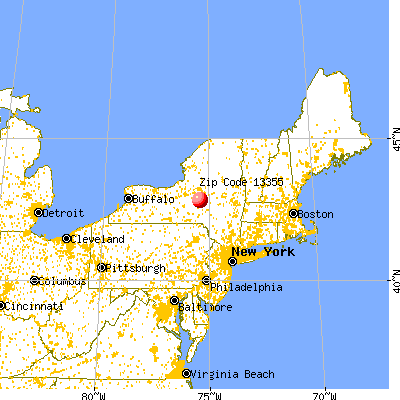
 Nearest zip codes: 13418, 13402, 13314, 13346, 13485, 13460.


