Estimated zip code population in 2022: 4,224 Zip code population in 2010: 4,429 Zip code population in 2000: 4,424
Houses and condos: 2,010 Renter-occupied apartments: 332
% of renters here:
20%
State:
46%
March 2022 cost of living index in zip code 13460: 93.7 (less than average, U.S. average is 100)
Land area: 71.5 sq. mi. Water area: 0.2 sq. mi.
Population density: 59 people per square mile
(very low).
OSM Map
General Map
Google Map
MSN Map
OSM Map
General Map
Google Map
MSN Map
OSM Map
General Map
Google Map
MSN Map
OSM Map
General Map
Google Map
MSN Map
Please wait while loading the map...
Real estate property taxes paid for housing units in 2022:
This zip code:
2.7% ($3,269)
New York:
1.5% ($6,180)
Median real estate property taxes paid for housing units with mortgages in 2022: $3,691 (2.8%) Median real estate property taxes paid for housing units with no mortgage in 2022: $3,077 (2.7%)
Business Search- 14 Million verified businesses
Males: 2,128
(50.4%)
Females: 2,096
(49.6%)
For population 25 years and over in 13460:
High school or higher: 87.3%
Bachelor's degree or higher: 16.0%
Graduate or professional degree: 5.9%
Unemployed: 3.8%
Mean travel time to work (commute): 24.4 minutes
For population 15 years and over in 13460:
Never married: 24.6%
Now married: 56.9%
Separated: 0.7%
Widowed: 6.1%
Divorced: 11.6%
Zip code 13460 compared to state average:
Median house value significantly below state average.
Black race population percentage significantly below state average.
Hispanic race population percentage significantly below state average.
Foreign-born population percentage significantly below state average.
Renting percentage significantly below state average.
Length of stay since moving in significantly above state average.
Number of rooms per house above state average.
Number of college students significantly below state average.
Percentage of population with a bachelor's degree or higher significantly below state average.
Averages for the 2020 tax year for zip code 13460, filed in 2021:
Average Adjusted Gross Income (AGI) in 2020: $50,386 (Individual Income Tax Returns)
Here:
$50,386
State:
$90,930
Salary/wage: $43,446 (reported on 80.5% of returns)
Here:
$43,446
State:
$72,104
(% of AGI for various income ranges: 1278.6% for AGIs below $25k, 3382.0% for AGIs $25k-50k, 6187.1% for AGIs $50k-75k, 8765.7% for AGIs $75k-100k, 13633.8% for AGIs $100k-200k)
Taxable interest for individuals: $1,190 (reported on 30.0% of returns)
This zip code:
$1,190
New York:
$3,075
(% of AGI for various income ranges: 19.8% for AGIs below $25k, 38.1% for AGIs $25k-50k, 70.8% for AGIs $50k-75k, 62.9% for AGIs $75k-100k, 92.3% for AGIs $100k-200k)
Ordinary dividends: $4,105 (reported on 17.6% of returns)
Here:
$4,105
State:
$11,095
(% of AGI for various income ranges: 34.1% for AGIs below $25k, 40.6% for AGIs $25k-50k, 75.4% for AGIs $50k-75k, 90.7% for AGIs $75k-100k, 647.7% for AGIs $100k-200k)
Net capital gain/loss in AGI: +$8,968 (reported on 11.9% of returns)
Here:
+$8,968
State:
+$44,925
(% of AGI for various income ranges: 23.6% for AGIs below $25k, 40.4% for AGIs $25k-50k, 22.5% for AGIs $50k-75k, 155.0% for AGIs $75k-100k, 1268.5% for AGIs $100k-200k)
Profit/loss from business: +$7,838 (reported on 12.4% of returns)
Here:
+$7,838
State:
+$14,940
(% of AGI for various income ranges: 105.2% for AGIs below $25k, 77.8% for AGIs $25k-50k, 199.6% for AGIs $50k-75k, 232.1% for AGIs $75k-100k, 270.0% for AGIs $100k-200k)
Taxable individual retirement arrangement distribution: $16,222 (reported on 11.0% of returns)
13460:
$16,222
New York:
$19,609
(% of AGI for various income ranges: 66.4% for AGIs below $25k, 132.8% for AGIs $25k-50k, 257.1% for AGIs $50k-75k, 433.6% for AGIs $75k-100k, 1152.3% for AGIs $100k-200k)
Total itemized deductions: $29,960 (reported on 2.4% of returns)
Here:
$29,960
State:
$39,326
(% of AGI for various income ranges: 134.4% for AGIs $25k-50k, 593.8% for AGIs $100k-200k)
Charity contributions: $4,100 (reported on 1.4% of returns)
Here:
$4,100
State:
$15,420
(% of AGI for various income ranges: 87.9% for AGIs $75k-100k)
Taxes paid: $7,920 (reported on 2.4% of returns)
13460:
$7,920
State:
$9,183
(% of AGI for various income ranges: 38.1% for AGIs $25k-50k, 146.2% for AGIs $100k-200k)
Earned income credit: $2,102 (reported on 19.0% of returns)
Here:
$2,102
State:
$2,138
(% of AGI for various income ranges: 93.2% for AGIs below $25k, 79.8% for AGIs $25k-50k)
Percentage of individuals using paid preparers for their 2020 taxes: 95.2%
Here:
95%
State:
95%
(% for various income ranges: 95.5% for AGIs below $25k, 94.2% for AGIs $25k-50k, 97.0% for AGIs $50k-75k, 90.0% for AGIs $75k-100k, 100.0% for AGIs $100k-200k, 100.0% for AGIs over 200k)
Averages for the 2012 tax year for zip code 13460, filed in 2013:
Average Adjusted Gross Income (AGI) in 2012: $41,709 (Individual Income Tax Returns)
Here:
$41,709
State:
$77,088
Salary/wage: $35,891 (reported on 84.6% of returns)
Here:
$35,891
State:
$60,593
(% of AGI for various income ranges: 75.7% for AGIs below $25k, 78.4% for AGIs $25k-50k, 75.2% for AGIs $50k-75k, 78.4% for AGIs $75k-100k, 61.1% for AGIs $100k-200k)
Taxable interest for individuals: $1,065 (reported on 31.2% of returns)
This zip code:
$1,065
New York:
$3,125
(% of AGI for various income ranges: 0.5% for AGIs below $25k, 0.7% for AGIs $25k-50k, 1.1% for AGIs $50k-75k, 0.8% for AGIs $75k-100k, 0.8% for AGIs $100k-200k)
Ordinary dividends: $2,614 (reported on 20.7% of returns)
Here:
$2,614
State:
$10,299
(% of AGI for various income ranges: 1.7% for AGIs below $25k, 1.4% for AGIs $25k-50k, 1.3% for AGIs $50k-75k, 0.6% for AGIs $75k-100k, 1.4% for AGIs $100k-200k)
Net capital gain/loss in AGI: +$5,144 (reported on 13.0% of returns)
Here:
+$5,144
State:
+$42,474
(% of AGI for various income ranges: 0.6% for AGIs below $25k, 0.2% for AGIs $25k-50k, 1.4% for AGIs $50k-75k, 0.7% for AGIs $75k-100k, 4.0% for AGIs $100k-200k)
Profit/loss from business: +$7,793 (reported on 13.5% of returns)
Here:
+$7,793
State:
+$16,168
(% of AGI for various income ranges: 4.9% for AGIs below $25k, 3.0% for AGIs $25k-50k, 2.4% for AGIs $50k-75k, 2.8% for AGIs $75k-100k, 0.8% for AGIs $100k-200k)
Taxable individual retirement arrangement distribution: $9,824 (reported on 10.1% of returns)
13460:
$9,824
New York:
$17,621
(% of AGI for various income ranges: 3.4% for AGIs below $25k, 1.6% for AGIs $25k-50k, 2.4% for AGIs $50k-75k, 2.2% for AGIs $75k-100k, 2.7% for AGIs $100k-200k)
Total itemized deductions: $17,438 (20% of AGI, reported on 18.8% of returns)
Here:
$17,438
State:
$34,985
Here:
20.0% of AGI
State:
21.3% of AGI
(% of AGI for various income ranges: 5.9% for AGIs below $25k, 5.2% for AGIs $25k-50k, 7.2% for AGIs $50k-75k, 8.5% for AGIs $75k-100k, 11.3% for AGIs $100k-200k)
Charity contributions: $2,515 (reported on 12.5% of returns)
Here:
$2,515
State:
$5,572
(% of AGI for various income ranges: 0.3% for AGIs below $25k, 0.4% for AGIs $25k-50k, 0.6% for AGIs $50k-75k, 0.5% for AGIs $75k-100k, 1.6% for AGIs $100k-200k)
Taxes paid: $8,300 (reported on 18.8% of returns)
13460:
$8,300
State:
$18,656
(% of AGI for various income ranges: 1.4% for AGIs below $25k, 1.9% for AGIs $25k-50k, 3.1% for AGIs $50k-75k, 3.9% for AGIs $75k-100k, 7.0% for AGIs $100k-200k)
Earned income credit: $2,263 (reported on 20.7% of returns)
Here:
$2,263
State:
$2,230
(% of AGI for various income ranges: 6.8% for AGIs below $25k, 1.1% for AGIs $25k-50k)
Percentage of individuals using paid preparers for their 2012 taxes: 55.3%
Here:
55%
State:
66%
(% for various income ranges: 50.5% for AGIs below $25k, 57.1% for AGIs $25k-50k, 58.1% for AGIs $50k-75k, 62.5% for AGIs $75k-100k, 64.3% for AGIs $100k-200k)
Averages for the 2004 tax year for zip code 13460, filed in 2005:
Average Adjusted Gross Income (AGI) in 2004: $35,477 (Individual Income Tax Returns)
Here:
$35,477
State:
$59,519
Salary/wage: $30,809 (reported on 84.7% of returns)
Here:
$30,809
State:
$50,673
(% of AGI for various income ranges: 97.4% for AGIs below $10k, 76.5% for AGIs $10k-25k, 82.1% for AGIs $25k-50k, 81.6% for AGIs $50k-75k, 85.5% for AGIs $75k-100k, 41.4% for AGIs over 100k)
Taxable interest for individuals: $1,135 (reported on 44.6% of returns)
This zip code:
$1,135
New York:
$2,377
(% of AGI for various income ranges: 3.1% for AGIs below $10k, 1.6% for AGIs $10k-25k, 1.3% for AGIs $25k-50k, 1.0% for AGIs $50k-75k, 0.8% for AGIs $75k-100k, 2.1% for AGIs over 100k)
Taxable dividends: $1,912 (reported on 24.6% of returns)
Here:
$1,912
State:
$5,394
(% of AGI for various income ranges: 2.9% for AGIs below $10k, 1.4% for AGIs $10k-25k, 1.0% for AGIs $25k-50k, 1.3% for AGIs $50k-75k, 0.5% for AGIs $75k-100k, 2.0% for AGIs over 100k)
Net capital gain/loss: +$5,084 (reported on 17.8% of returns)
Here:
+$5,084
State:
+$23,581
(% of AGI for various income ranges: -1.3% for AGIs below $10k, 1.1% for AGIs $10k-25k, 0.9% for AGIs $25k-50k, 1.1% for AGIs $50k-75k, 1.1% for AGIs $75k-100k, 8.6% for AGIs over 100k)
Profit/loss from business: +$10,104 (reported on 15.8% of returns)
Here:
+$10,104
State:
+$13,809
(% of AGI for various income ranges: 9.7% for AGIs below $10k, 4.0% for AGIs $10k-25k, 3.1% for AGIs $25k-50k, 2.0% for AGIs $50k-75k, 0.6% for AGIs $75k-100k, 11.3% for AGIs over 100k)
Profit/loss from farming: +$2,761 (reported on 2.4% of returns)
Here:
+$2,761
State:
-$2,666
IRA payment deduction: $2,756 (reported on 2.3% of returns)
13460:
$2,756
New York:
$3,115
Self-employed pension: $17,538 (reported on 0.7% of returns)
Here:
$17,538
New York:
$19,016
Total itemized deductions: $15,455 (19% of AGI, reported on 18.0% of returns)
Here:
$15,455
State:
$25,864
Here:
19.2% of AGI
State:
21.9% of AGI
(% of AGI for various income ranges: 12.1% for AGIs below $10k, 3.3% for AGIs $10k-25k, 6.0% for AGIs $25k-50k, 7.1% for AGIs $50k-75k, 11.2% for AGIs $75k-100k, 11.3% for AGIs over 100k)
Charity contributions deductions: $2,417 (3% of AGI, reported on 14.2% of returns)
Here:
$2,417
State:
$4,439
Here:
2.8% of AGI
State:
3.6% of AGI
(% of AGI for various income ranges: 0.5% for AGIs $10k-25k, 0.5% for AGIs $25k-50k, 0.6% for AGIs $50k-75k, 1.0% for AGIs $75k-100k, 2.4% for AGIs over 100k)
Total tax: $4,779 (reported on 72.4% of returns)
13460:
$4,779
State:
$11,730
(% of AGI for various income ranges: 3.8% for AGIs below $10k, 4.0% for AGIs $10k-25k, 6.9% for AGIs $25k-50k, 8.5% for AGIs $50k-75k, 10.3% for AGIs $75k-100k, 18.8% for AGIs over 100k)
Earned income credit: $1,814 (reported on 20.6% of returns)
Here:
$1,814
State:
$1,757
Percentage of individuals using paid preparers for their 2004 taxes: 64.6%
Here:
65%
State:
67%
(% for various income ranges: 59.1% for AGIs below $10k, 63.2% for AGIs $10k-25k, 66.5% for AGIs $25k-50k, 68.2% for AGIs $50k-75k, 71.0% for AGIs $75k-100k, 72.0% for AGIs over 100k)
Household received Food Stamps/SNAP in the past 12 months: 295 Household did not receive Food Stamps/SNAP in the past 12 months: 1,375
Women who had a birth in the past 12 months: 45 (35 now married, 10 unmarried) Women who did not have a birth in the past 12 months: 812 (421 now married, 385 unmarried)
Housing units in zip code 13460 with a mortgage: 693 (50 second mortgage, 50 both second mortgage and home equity loan) Houses without a mortgage: 32
Median monthly owner costs for units with a mortgage: $1,381 Median monthly owner costs for units without a mortgage: $499
Residents with income below the poverty level in 2022:
This zip code:
7.1%
Whole state:
14.3%
Residents with income below 50% of the poverty level in 2022:
This zip code:
3.7%
Whole state:
6.8%
Median number of rooms in houses and condos:
Here:
6.7
State:
6.3
Median number of rooms in apartments:
Here:
4.7
State:
3.8
Notable locations in this zip code not listed on our city pages
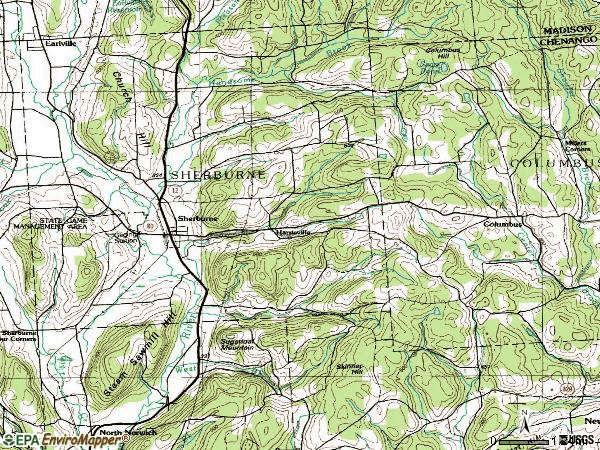
Notable locations in zip code 13460: Sherburne Grange (A), Fairkit Farm (B), Hopestead Hill Farm (C), Mountain Top Golf Course (D), Rogers State Game Farm (E), Sherburne Public Library (F), Pratt - Newton Memorial Home (G), Sherburne Senior Housing Center (H), Sherburne Municipal Building (I), Sherburne Town Fire Department (J). Display/hide their locations on the map
Churches in zip code 13460 include: Sherburne United Methodist Church (A), First Congregational Church (B), Saint Malachy's Roman Catholic Church (C), Christ Episcopal Church (D), Sherburne Baptist Church (E), Christian Baptist Church (F), Crossroads Community Church (G), Negro Hollow Church (H). Display/hide their locations on the map
Cemeteries: Quarter Cemetery (1), Sherburne West Hill Cemetery (2), Harrisville Cemetery (3), North Norwich Cemetery (4), Tillotson Cemetery (5), Saint Malachy Cemetery (6), East Hill Cemetery (7). Display/hide their locations on the map
Streams, rivers, and creeks: Pleasant Brook (A), Number Six Brook (B), West Brook (C), Cold Spring Brook (D), Shawler Brook (E), Mad Brook (F), Handsome Brook (G). Display/hide their locations on the map
In group quarters: 46 (-1 institutionalized population)
Size of family households: 652 2-persons, 260 3-persons, 144 4-persons, 81 5-persons, 120 6-persons, 12 7-or-more-persons
Size of nonfamily households: 325 1-person, 61 2-persons
681 married couples with children.
263 single-parent households (86 men, 177 women).
95.7% of residents of 13460 zip code speak English at home.
0.6% of residents speak Spanish at home (81% very well, 4% well, 15% not well).
2.5% of residents speak other Indo-European language at home (43% very well, 42% well, 16% not well).
0.7% of residents speak Asian or Pacific Island language at home (13% very well, 17% well, 67% not well, 3% not at all).
Foreign born population: 67 (1.6%) (36.0% of them are naturalized citizens)
This zip code:
1.6%
Whole state:
22.7%
21%France
10%Malaysia
9%Belgium
7%Grenada
6%Netherlands
4%Taiwan
1%Guyana
31%American
13%English
11%Irish
9%German
8%Italian
5%Polish
1%Dutch
Year of entry for the foreign-born population
242010 or later
172000 to 2009
151990 to 1999
20Before 1990
Facilities with environmental interests located in this zip code:
HARMONY HAVEN FARM (208 BLANDING ROAD in SHERBURNE, NY)
STATE MASTER (New York facility tracking) - National Pollutant Discharge Elimination System Permit National Pollutant Discharge Elimination System NON-MAJOR (Tracking pollutant discharge elimination systems) - permit Business SIC classification: GENERAL FARMS, PRIMARILY LIVESTOCK AND ANIMAL SPECIALTIES Organizations: LARRY KOORNSLRA/STEVE BARTLETT (CONTACT/OWNER)
Alternative names: DIEDERIK DEINUM, LARRY KOORNSLRA/STEVE BARTLETT
HOWARD FARM (FIELD N OF W STATE ST in SHERBURNE, NY)
(Resource Conservation and Recovery Act (tracking hazardous waste))
COLUMBUS FARMING CORP - CFC (304 STONE HOUSE RD in SHERBURNE, NY)
Conditionally Exempt Small Quantity Generators, less than 100 kg/month of hazardous waste (Resource Conservation and Recovery Act (tracking hazardous waste)) Organizations: JOHN P ROMA (CONTACT/OPERATOR)
, ALEXION PHARACEUTICALS (CONTACT/OWNER)
AGWAY ENERGY PRODUCTS (8054 STATE HIGHWAY 12 in SHERBURNE, NY)
Conditionally Exempt Small Quantity Generators, less than 100 kg/month of hazardous waste (Resource Conservation and Recovery Act (tracking hazardous waste)) - notification Organizations: AGWAY PETROLEUM CORP (CONTACT/OWNER)
Alternative names: AGWAY ENGERY PRODUCTS
HAMILTON PRODUCTS INC (43 A RT 12 S in SHERBURNE, NY)
TRI REPORTER (Tracking of toxic chemicals releasing facilities) Alternative names: HAMILTON PRODS. INC.
CHENANGO COUNTY BRIDGE 3351430 (BLANDING RD - CHENANGO RIVER in SHERBURNE, NY)
Conditionally Exempt Small Quantity Generators, less than 100 kg/month of hazardous waste (Resource Conservation and Recovery Act (tracking hazardous waste)) - notification
CITIZENS COMMUNICATIONS (14 CLASSIC ST in SHERBURNE, NY)
Small Quantity Generators, between 100 kg and 1000 kg of hazardous waste/month (Resource Conservation and Recovery Act (tracking hazardous waste)) - notification
Housing units lacking complete plumbing facilities: 0.5% Housing units lacking complete kitchen facilities: 1.7%
47.7%Electricity
26.8%Fuel oil, kerosene, etc.
9.4%Wood
7.6%Bottled, tank, or LP gas
5.5%Utility gas
1.5%Coal or coke
1.5%Other fuel
Population in 1990: 4,013. Population change in the 1990s: +411 (+10.2%).
Place of birth for U.S.-born residents:
This state: 3,574
Northeast: 312
Midwest: 133
South: 81
West: 34
65% of the 13460 zip code residents lived in the same house 5 years ago. Out of people who lived in different houses, 75% lived in this county. Out of people who lived in different counties, 50% lived in New York.
91% of the 13460 zip code residents lived in the same house 1 year ago. Out of people who lived in different houses, 58% moved from this county. Out of people who lived in different houses, 33% moved from different county within same state. Out of people who lived in different houses, 7% moved from different state.
Private vs. public school enrollment:
Students in private schools in grades 1 to 8 (elementary and middle school): 19
Here:
5.0%
New York:
15.6%
Students in private schools in grades 9 to 12 (high school):
Here:
0.0%
New York:
15.0%
Students in private undergraduate colleges:
Here:
0.0%
New York:
39.2%
Occupation by median earnings in the past 12 months ($)
73,912Health diagnosing and treating practitioners and other technical occupations
68,977Business and financial operations occupations
59,945Management occupations
57,764Education, training, and library occupations
50,786Arts, design, entertainment, sports, and media occupations
48,903Life, physical, and social science occupations
Top industries in this zip code by the number of employees in 2005:
Finance and Insurance: Direct Property and Casualty Insurance Carriers (250-499 employees: 1 establishment)
2002 - 2018 National Fire Incident Reporting System (NFIRS) incidents
Based on the data from the years 2002 - 2018 the average number of fires per year is 20. The highest number of reported fires - 30 took place in 2018, and the least - 7 in 2013. The data has a growing trend.
When looking into fire subcategories, the most incidents belonged to: Structure Fires (59.5%), and Outside Fires (21.3%).
Fire incident types reported to NFIRS in Zip Code 13460


+$2,761
-$2,666
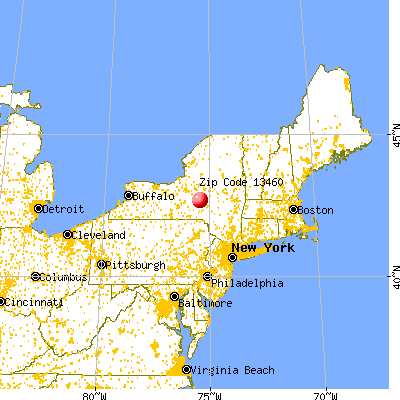
 Nearest zip codes: 13355, 13411, 13332, 13485, 13815, 13346.


 Based on the data from the years 2002 - 2018 the average number of fires per year is 20. The highest number of reported fires - 30 took place in 2018, and the least - 7 in 2013. The data has a growing trend.
 When looking into fire subcategories, the most incidents belonged to: Structure Fires (59.5%), and Outside Fires (21.3%).