Estimated zip code population in 2022: 5,904 Zip code population in 2010: 6,371 Zip code population in 2000: 6,507
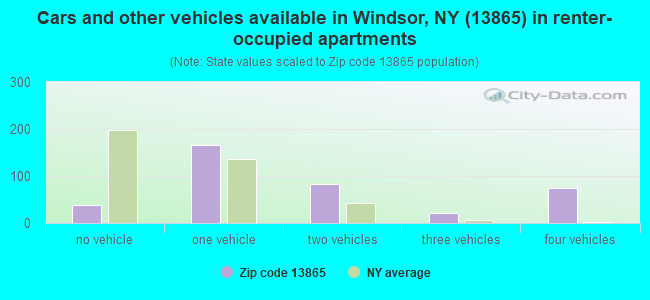
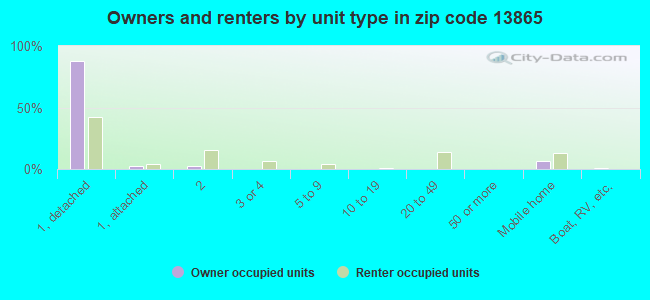
Houses and condos: 3,238 Renter-occupied apartments: 378
% of renters here:
14%
State:
46%
March 2022 cost of living index in zip code 13865: 93.9 (less than average, U.S. average is 100)
Land area: 110.3 sq. mi. Water area: 1.3 sq. mi.
Population density: 54 people per square mile
(very low).
OSM Map
General Map
Google Map
MSN Map
OSM Map
General Map
Google Map
MSN Map
OSM Map
General Map
Google Map
MSN Map
OSM Map
General Map
Google Map
MSN Map
Please wait while loading the map...
Real estate property taxes paid for housing units in 2022:
This zip code:
2.3% ($3,470)
New York:
1.5% ($6,180)
Median real estate property taxes paid for housing units with mortgages in 2022: $3,625 (2.4%) Median real estate property taxes paid for housing units with no mortgage in 2022: $3,127 (1.9%)
Business Search- 14 Million verified businesses
Males: 3,263
(55.3%)
Females: 2,641
(44.7%)
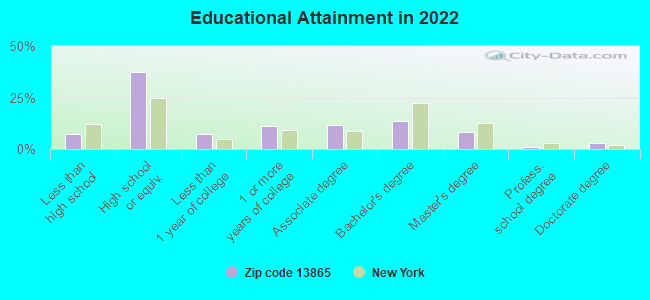
For population 25 years and over in 13865:
High school or higher: 92.2%
Bachelor's degree or higher: 25.4%
Graduate or professional degree: 12.1%
Unemployed: 6.2%
Mean travel time to work (commute): 26.3 minutes
For population 15 years and over in 13865:
Never married: 30.8%
Now married: 54.8%
Separated: 1.2%
Widowed: 5.2%
Divorced: 8.1%
Zip code 13865 compared to state average:
Median house value significantly below state average.
Black race population percentage significantly below state average.
Hispanic race population percentage significantly below state average.
Median age significantly above state average.
Foreign-born population percentage significantly below state average.
Renting percentage significantly below state average.
Length of stay since moving in significantly above state average.
Number of rooms per house above state average.
Percentage of population with a bachelor's degree or higher below state average.
Averages for the 2020 tax year for zip code 13865, filed in 2021:
Average Adjusted Gross Income (AGI) in 2020: $56,499 (Individual Income Tax Returns)
Here:
$56,499
State:
$90,930
Salary/wage: $48,949 (reported on 81.0% of returns)
Here:
$48,949
State:
$72,104
(% of AGI for various income ranges: 1083.2% for AGIs below $25k, 3358.4% for AGIs $25k-50k, 5573.4% for AGIs $50k-75k, 8028.4% for AGIs $75k-100k, 15556.8% for AGIs $100k-200k)
Taxable interest for individuals: $647 (reported on 39.4% of returns)
This zip code:
$647
New York:
$3,075
(% of AGI for various income ranges: 17.7% for AGIs below $25k, 15.9% for AGIs $25k-50k, 36.9% for AGIs $50k-75k, 39.2% for AGIs $75k-100k, 115.5% for AGIs $100k-200k)
Ordinary dividends: $2,591 (reported on 16.8% of returns)
Here:
$2,591
State:
$11,095
(% of AGI for various income ranges: 23.9% for AGIs below $25k, 24.6% for AGIs $25k-50k, 58.3% for AGIs $50k-75k, 56.8% for AGIs $75k-100k, 252.3% for AGIs $100k-200k)
Net capital gain/loss in AGI: +$4,849 (reported on 13.5% of returns)
Here:
+$4,849
State:
+$44,925
(% of AGI for various income ranges: 10.9% for AGIs below $25k, 24.9% for AGIs $25k-50k, 42.3% for AGIs $50k-75k, 120.0% for AGIs $75k-100k, 512.3% for AGIs $100k-200k)
Profit/loss from business: +$10,152 (reported on 11.3% of returns)
Here:
+$10,152
State:
+$14,940
(% of AGI for various income ranges: 53.0% for AGIs below $25k, 102.1% for AGIs $25k-50k, 118.6% for AGIs $50k-75k, 213.6% for AGIs $75k-100k, 569.5% for AGIs $100k-200k)
Taxable individual retirement arrangement distribution: $13,511 (reported on 10.2% of returns)
13865:
$13,511
New York:
$19,609
(% of AGI for various income ranges: 62.3% for AGIs below $25k, 82.2% for AGIs $25k-50k, 242.9% for AGIs $50k-75k, 138.8% for AGIs $75k-100k, 778.6% for AGIs $100k-200k)
Total itemized deductions: $23,583 (reported on 2.2% of returns)
Here:
$23,583
State:
$39,326
(% of AGI for various income ranges: 190.9% for AGIs $50k-75k, 339.5% for AGIs $100k-200k)
Charity contributions: $8,200 (reported on 1.5% of returns)
Here:
$8,200
State:
$15,420
(% of AGI for various income ranges: 149.1% for AGIs $100k-200k)
Taxes paid: $7,683 (reported on 2.2% of returns)
13865:
$7,683
State:
$9,183
(% of AGI for various income ranges: 50.3% for AGIs $50k-75k, 129.5% for AGIs $100k-200k)
Earned income credit: $2,142 (reported on 14.6% of returns)
Here:
$2,142
State:
$2,138
(% of AGI for various income ranges: 78.9% for AGIs below $25k, 64.6% for AGIs $25k-50k)
Percentage of individuals using paid preparers for their 2020 taxes: 96.4%
Here:
96%
State:
95%
(% for various income ranges: 96.1% for AGIs below $25k, 96.2% for AGIs $25k-50k, 95.7% for AGIs $50k-75k, 96.9% for AGIs $75k-100k, 97.2% for AGIs $100k-200k, 100.0% for AGIs over 200k)
Averages for the 2012 tax year for zip code 13865, filed in 2013:
Average Adjusted Gross Income (AGI) in 2012: $44,462 (Individual Income Tax Returns)
Here:
$44,462
State:
$77,088
Salary/wage: $39,114 (reported on 83.3% of returns)
Here:
$39,114
State:
$60,593
(% of AGI for various income ranges: 70.6% for AGIs below $25k, 74.0% for AGIs $25k-50k, 74.0% for AGIs $50k-75k, 78.6% for AGIs $75k-100k, 82.9% for AGIs $100k-200k)
Taxable interest for individuals: $589 (reported on 40.8% of returns)
This zip code:
$589
New York:
$3,125
(% of AGI for various income ranges: 1.0% for AGIs below $25k, 0.7% for AGIs $25k-50k, 0.5% for AGIs $50k-75k, 0.3% for AGIs $75k-100k, 0.6% for AGIs $100k-200k)
Ordinary dividends: $2,555 (reported on 18.8% of returns)
Here:
$2,555
State:
$10,299
(% of AGI for various income ranges: 1.3% for AGIs below $25k, 0.9% for AGIs $25k-50k, 0.7% for AGIs $50k-75k, 0.4% for AGIs $75k-100k, 2.2% for AGIs $100k-200k)
Net capital gain/loss in AGI: +$3,152 (reported on 11.7% of returns)
Here:
+$3,152
State:
+$42,474
(% of AGI for various income ranges: 0.1% for AGIs below $25k, 0.5% for AGIs $25k-50k, 0.2% for AGIs $50k-75k, 0.4% for AGIs $75k-100k, 2.4% for AGIs $100k-200k)
Profit/loss from business: +$8,003 (reported on 12.8% of returns)
Here:
+$8,003
State:
+$16,168
(% of AGI for various income ranges: 5.2% for AGIs below $25k, 2.3% for AGIs $25k-50k, 1.5% for AGIs $50k-75k, 2.2% for AGIs $75k-100k, 2.2% for AGIs $100k-200k)
Taxable individual retirement arrangement distribution: $9,013 (reported on 10.6% of returns)
13865:
$9,013
New York:
$17,621
(% of AGI for various income ranges: 2.6% for AGIs below $25k, 2.7% for AGIs $25k-50k, 1.9% for AGIs $50k-75k, 2.5% for AGIs $75k-100k, 1.9% for AGIs $100k-200k)
Total itemized deductions: $17,808 (22% of AGI, reported on 22.7% of returns)
Here:
$17,808
State:
$34,985
Here:
21.8% of AGI
State:
21.3% of AGI
(% of AGI for various income ranges: 4.8% for AGIs below $25k, 6.4% for AGIs $25k-50k, 9.0% for AGIs $50k-75k, 9.3% for AGIs $75k-100k, 12.4% for AGIs $100k-200k, 13.1% for AGIs over 200k)
Charity contributions: $2,840 (reported on 14.2% of returns)
Here:
$2,840
State:
$5,572
(% of AGI for various income ranges: 0.2% for AGIs below $25k, 0.5% for AGIs $25k-50k, 0.7% for AGIs $50k-75k, 1.2% for AGIs $75k-100k, 1.7% for AGIs $100k-200k)
Taxes paid: $8,181 (reported on 22.7% of returns)
13865:
$8,181
State:
$18,656
(% of AGI for various income ranges: 1.7% for AGIs below $25k, 2.5% for AGIs $25k-50k, 3.5% for AGIs $50k-75k, 4.1% for AGIs $75k-100k, 6.5% for AGIs $100k-200k, 8.5% for AGIs over 200k)
Earned income credit: $2,192 (reported on 17.7% of returns)
Here:
$2,192
State:
$2,230
(% of AGI for various income ranges: 5.8% for AGIs below $25k, 1.1% for AGIs $25k-50k)
Percentage of individuals using paid preparers for their 2012 taxes: 52.1%
Here:
52%
State:
66%
(% for various income ranges: 44.8% for AGIs below $25k, 55.1% for AGIs $25k-50k, 56.5% for AGIs $50k-75k, 58.3% for AGIs $75k-100k, 68.0% for AGIs $100k-200k)
Averages for the 2004 tax year for zip code 13865, filed in 2005:
Average Adjusted Gross Income (AGI) in 2004: $37,024 (Individual Income Tax Returns)
Here:
$37,024
State:
$59,519
Salary/wage: $34,846 (reported on 85.7% of returns)
Here:
$34,846
State:
$50,673
(% of AGI for various income ranges: 112.0% for AGIs below $10k, 73.7% for AGIs $10k-25k, 82.1% for AGIs $25k-50k, 81.3% for AGIs $50k-75k, 84.9% for AGIs $75k-100k, 73.8% for AGIs over 100k)
Taxable interest for individuals: $757 (reported on 51.5% of returns)
This zip code:
$757
New York:
$2,377
(% of AGI for various income ranges: 6.7% for AGIs below $10k, 2.0% for AGIs $10k-25k, 0.9% for AGIs $25k-50k, 0.9% for AGIs $50k-75k, 0.6% for AGIs $75k-100k, 0.7% for AGIs over 100k)
Taxable dividends: $1,343 (reported on 22.9% of returns)
Here:
$1,343
State:
$5,394
(% of AGI for various income ranges: 2.8% for AGIs below $10k, 1.2% for AGIs $10k-25k, 0.6% for AGIs $25k-50k, 0.8% for AGIs $50k-75k, 0.5% for AGIs $75k-100k, 1.2% for AGIs over 100k)
Net capital gain/loss: +$2,138 (reported on 16.5% of returns)
Here:
+$2,138
State:
+$23,581
(% of AGI for various income ranges: -0.5% for AGIs below $10k, 0.5% for AGIs $10k-25k, 0.5% for AGIs $25k-50k, 0.7% for AGIs $50k-75k, 0.6% for AGIs $75k-100k, 3.0% for AGIs over 100k)
Profit/loss from business: +$7,145 (reported on 13.7% of returns)
Here:
+$7,145
State:
+$13,809
(% of AGI for various income ranges: -0.3% for AGIs below $10k, 3.8% for AGIs $10k-25k, 3.0% for AGIs $25k-50k, 2.2% for AGIs $50k-75k, 2.5% for AGIs $75k-100k, 2.3% for AGIs over 100k)
IRA payment deduction: $3,013 (reported on 2.9% of returns)
13865:
$3,013
New York:
$3,115
(% of AGI for various income ranges: 0.3% for AGIs $10k-25k, 0.3% for AGIs $25k-50k, 0.3% for AGIs $50k-75k, 0.2% for AGIs $75k-100k)
Total itemized deductions: $14,296 (20% of AGI, reported on 22.4% of returns)
Here:
$14,296
State:
$25,864
Here:
20.0% of AGI
State:
21.9% of AGI
(% of AGI for various income ranges: 5.3% for AGIs $10k-25k, 6.3% for AGIs $25k-50k, 8.8% for AGIs $50k-75k, 11.2% for AGIs $75k-100k, 13.1% for AGIs over 100k)
Charity contributions deductions: $2,038 (3% of AGI, reported on 18.5% of returns)
Here:
$2,038
State:
$4,439
Here:
2.7% of AGI
State:
3.6% of AGI
(% of AGI for various income ranges: 0.4% for AGIs $10k-25k, 0.6% for AGIs $25k-50k, 1.0% for AGIs $50k-75k, 1.3% for AGIs $75k-100k, 2.0% for AGIs over 100k)
Total tax: $4,341 (reported on 74.0% of returns)
13865:
$4,341
State:
$11,730
(% of AGI for various income ranges: 2.9% for AGIs below $10k, 4.2% for AGIs $10k-25k, 6.2% for AGIs $25k-50k, 8.4% for AGIs $50k-75k, 10.2% for AGIs $75k-100k, 15.6% for AGIs over 100k)
Earned income credit: $1,633 (reported on 15.0% of returns)
Here:
$1,633
State:
$1,757
Percentage of individuals using paid preparers for their 2004 taxes: 56.6%
Here:
57%
State:
67%
(% for various income ranges: 46.5% for AGIs below $10k, 56.9% for AGIs $10k-25k, 59.5% for AGIs $25k-50k, 59.9% for AGIs $50k-75k, 61.4% for AGIs $75k-100k, 64.9% for AGIs over 100k)
Household received Food Stamps/SNAP in the past 12 months: 433 Household did not receive Food Stamps/SNAP in the past 12 months: 2,271
Women who had a birth in the past 12 months: 38 (30 now married, 8 unmarried) Women who did not have a birth in the past 12 months: 935 (463 now married, 466 unmarried)
Housing units in zip code 13865 with a mortgage: 1,036 (148 second mortgage, 8 home equity loan, 140 both second mortgage and home equity loan) Houses without a mortgage: 84
Median monthly owner costs for units with a mortgage: $1,234 Median monthly owner costs for units without a mortgage: $594
Residents with income below the poverty level in 2022:
This zip code:
9.0%
Whole state:
14.3%
Residents with income below 50% of the poverty level in 2022:
This zip code:
2.6%
Whole state:
6.8%
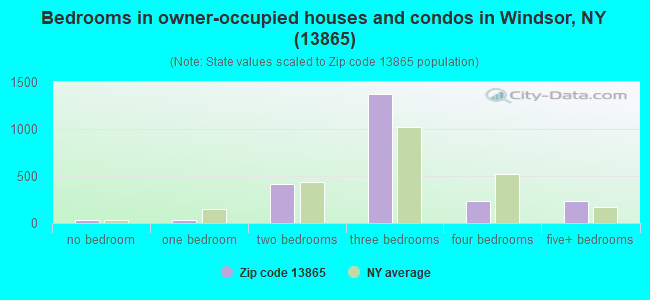
Median number of rooms in houses and condos:
Here:
6.6
State:
6.3
Median number of rooms in apartments:
Here:
4.4
State:
3.8
Notable locations in this zip code not listed on our city pages
Notable locations in zip code 13865: Lakeside Campground (A), Forest Lake Campground (B), State Line (C), Happy Times Farm (D), Golden Oaks Golf Club (E), Windsor Town Hall (F), Old Stone House Museum (G). Display/hide their locations on the map
Churches in zip code 13865 include: Our Lady of Lourdes Roman Catholic Church (A), Windsor Presbyterian Church (B), Free Methodist Church (C), Windsor Pilgrim Holiness Church (D), West Windsor Baptist Church (E), Sunshine Valley Wesleyan Church (F), Occanum Community Church (G), Lester Baptist Church (H), Gulf Summit Church (I). Display/hide their locations on the map
Cemeteries: Riverside Cemetery (1), Riley Farm Cemetery (2), Windsor Village Cemetery (3), South Windsor Cemetery (4), East Windsor Cemetery (5), Old South Windsor Cemetery (6), McClure Cemetery (7). Display/hide their locations on the map
Lakes and reservoirs: Mud Pond (A), Rogers Lake (B), Summit Lake (C), White Birch Lake (D), Agfa Lake (E), Beaver Lake (F), Deer Lake (G), Fly Pond (H). Display/hide their locations on the map
In group quarters: 31 (-1 institutionalized population)
Size of family households: 873 2-persons, 251 3-persons, 327 4-persons, 241 5-persons, 2 6-persons, 2 7-or-more-persons
Size of nonfamily households: 939 1-person, 60 2-persons, 5 3-persons
734 married couples with children.
288 single-parent households (194 men, 94 women).
99.5% of residents of 13865 zip code speak English at home.
0.2% of residents speak other Indo-European language at home (92% very well, 8% well).
0.4% of residents speak other language at home (100% very well).
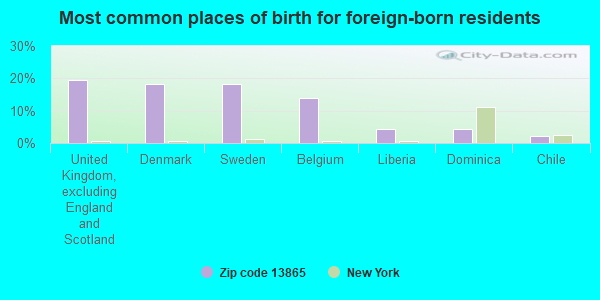
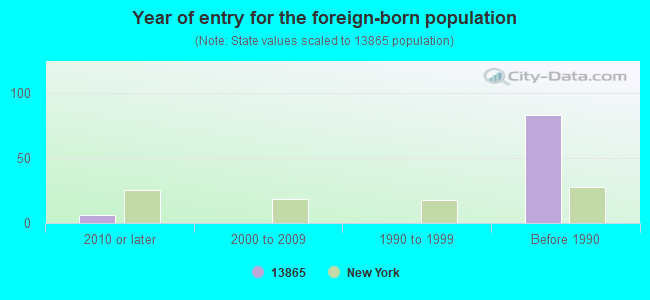
Foreign born population: 95 (1.6%) (94.0% of them are naturalized citizens)
This zip code:
1.6%
Whole state:
22.7%
19%United Kingdom, excluding England and Scotland
18%Denmark
18%Sweden
14%Belgium
4%Liberia
4%Dominica
2%Chile
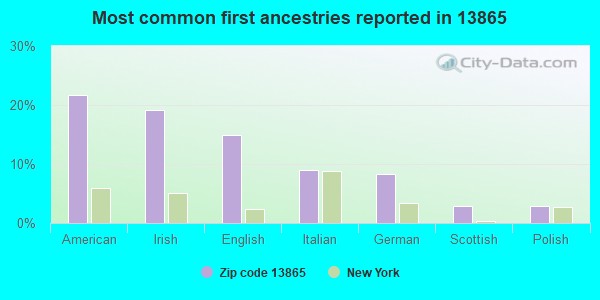
22%American
19%Irish
15%English
9%Italian
8%German
3%Scottish
3%Polish
Year of entry for the foreign-born population
62010 or later
02000 to 2009
01990 to 1999
83Before 1990
Facilities with environmental interests located in this zip code:
A.F. PALMER ES / WINDSOR CENTRAL MS ( in WINDSOR, NY)
(National Center for Education Statistics) - STATE ID-031701060004 Organizations: WINDSOR CSD (SCHOOL DISTRICT)
Housing units lacking complete plumbing facilities: 3.2% Housing units lacking complete kitchen facilities: 3.7%
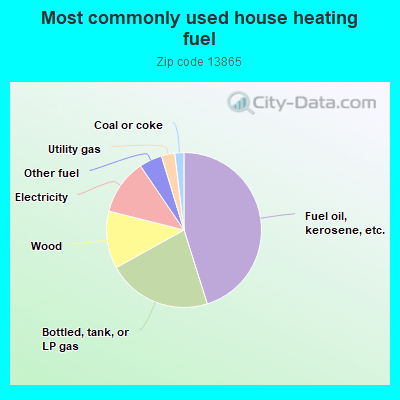
45.2%Fuel oil, kerosene, etc.
21.8%Bottled, tank, or LP gas
12.0%Wood
11.6%Electricity
4.8%Other fuel
2.8%Utility gas
1.9%Coal or coke
Population in 1990: 6,820.
Place of birth for U.S.-born residents:
This state: 4,314
Northeast: 1,100
Midwest: 38
South: 302
West: 32
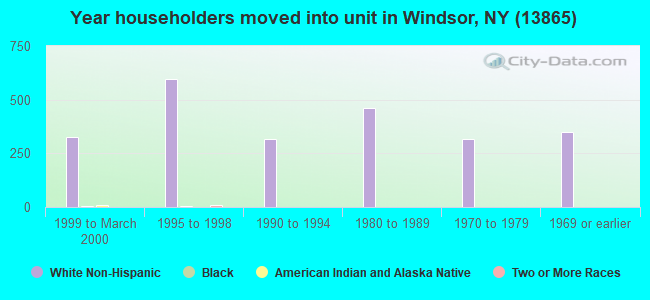
66% of the 13865 zip code residents lived in the same house 5 years ago. Out of people who lived in different houses, 70% lived in this county. Out of people who lived in different counties, 50% lived in New York.
91% of the 13865 zip code residents lived in the same house 1 year ago. Out of people who lived in different houses, 40% moved from this county. Out of people who lived in different houses, 20% moved from different county within same state. Out of people who lived in different houses, 42% moved from different state.
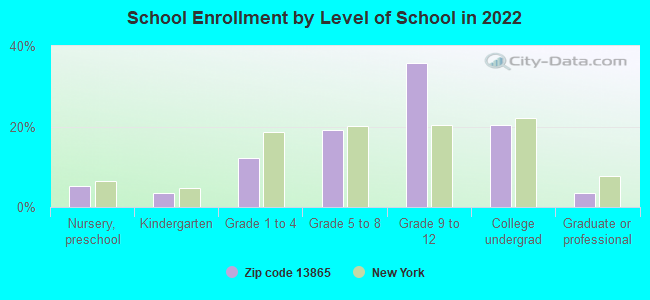
Private vs. public school enrollment:
Students in private schools in grades 1 to 8 (elementary and middle school): 12
Here:
3.6%
New York:
15.6%
Students in private schools in grades 9 to 12 (high school): 31
Here:
7.9%
New York:
15.0%
Students in private undergraduate colleges: 9
Here:
4.3%
New York:
39.2%
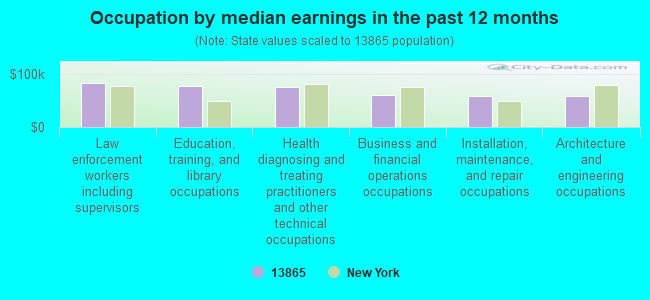
Occupation by median earnings in the past 12 months ($)
82,463Law enforcement workers including supervisors
77,206Education, training, and library occupations
75,357Health diagnosing and treating practitioners and other technical occupations
59,150Business and financial operations occupations
58,405Installation, maintenance, and repair occupations
57,404Architecture and engineering occupations
Top industries in this zip code by the number of employees in 2005:
Health Care and Social Assistance: Child Day Care Services (20-49 employees: 1 establishment, 1-4 employees: 2 establishments)
Accommodation and Food Services: Recreational and Vacation Camps (except Campgrounds) (10-19: 1, 1-4: 1)
Accommodation and Food Services: Limited-Service Restaurants (10-19: 1, 1-4: 1)
Wholesale Trade: Other Miscellaneous Durable Goods Merchant Wholesalers (10-19: 1)
Health Care and Social Assistance: Offices of Dentists (5-9: 2)
Other Services (except Public Administration): Religious Organizations (1-4: 7)
People in group quarters in 2010:
13 people in group homes intended for adults
10 people in other noninstitutional facilities
Fatal accident statistics in 2011:
Fatal accident count: 3
Vehicles involved in fatal accidents: 5
Fatal accidents caused by drunken drivers: 1
Fatalities: 3
Persons involved in fatal accidents: 4
Pedestrians involved in fatal accidents: 1
Fatal accident statistics in 2010:
Fatal accident count: 1
Vehicles involved in fatal accidents: 1
Fatal accidents caused by drunken drivers: 0
Fatalities: 1
Persons involved in fatal accidents: 1
Pedestrians involved in fatal accidents: 0
Home Mortgage Disclosure Act Aggregated Statistics For Year 2009 (Based on 8 partial tracts)
A) FHA, FSA/RHS & VA Home Purchase Loans
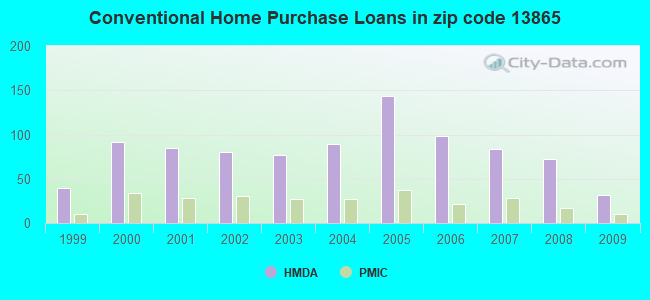
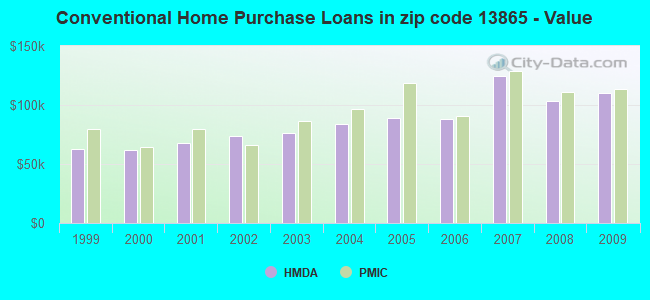
B) Conventional Home Purchase Loans
C) Refinancings
D) Home Improvement Loans
F) Non-occupant Loans on < 5 Family Dwellings (A B C & D)
G) Loans On Manufactured Home Dwelling (A B C & D)
Number
Average Value
Number
Average Value
Number
Average Value
Number
Average Value
Number
Average Value
Number
Average Value
LOANS ORIGINATED
43
$110,662
32
$110,496
130
$93,173
22
$32,303
10
$86,079
11
$88,560
APPLICATIONS APPROVED, NOT ACCEPTED
2
$87,635
2
$65,115
8
$74,259
6
$25,593
0
$0
4
$73,865
APPLICATIONS DENIED
15
$79,014
20
$70,052
76
$120,488
34
$23,757
2
$52,485
15
$63,135
APPLICATIONS WITHDRAWN
0
$0
0
$0
49
$120,016
6
$134,357
1
$56,390
0
$0
FILES CLOSED FOR INCOMPLETENESS
2
$139,955
0
$0
14
$113,862
2
$19,440
0
$0
4
$22,840
Aggregated Statistics For Year 2008 (Based on 8 partial tracts)
A) FHA, FSA/RHS & VA Home Purchase Loans
B) Conventional Home Purchase Loans
C) Refinancings
D) Home Improvement Loans
E) Loans on Dwellings For 5+ Families
F) Non-occupant Loans on < 5 Family Dwellings (A B C & D)
G) Loans On Manufactured Home Dwelling (A B C & D)
Number
Average Value
Number
Average Value
Number
Average Value
Number
Average Value
Number
Average Value
Number
Average Value
Number
Average Value
LOANS ORIGINATED
33
$111,214
72
$103,367
90
$90,075
48
$47,318
2
$76,780
15
$62,344
30
$66,681
APPLICATIONS APPROVED, NOT ACCEPTED
4
$87,958
10
$107,954
19
$83,550
2
$102,755
0
$0
0
$0
5
$50,326
APPLICATIONS DENIED
9
$99,304
28
$75,268
89
$93,480
67
$26,764
0
$0
8
$90,872
18
$50,119
APPLICATIONS WITHDRAWN
2
$97,190
0
$0
50
$87,212
5
$36,168
2
$62,200
1
$168,810
10
$47,429
FILES CLOSED FOR INCOMPLETENESS
0
$0
4
$67,060
14
$90,526
1
$66,040
0
$0
4
$67,060
0
$0
Aggregated Statistics For Year 2007 (Based on 8 partial tracts)
A) FHA, FSA/RHS & VA Home Purchase Loans
B) Conventional Home Purchase Loans
C) Refinancings
D) Home Improvement Loans
E) Loans on Dwellings For 5+ Families
F) Non-occupant Loans on < 5 Family Dwellings (A B C & D)
G) Loans On Manufactured Home Dwelling (A B C & D)
Number
Average Value
Number
Average Value
Number
Average Value
Number
Average Value
Number
Average Value
Number
Average Value
Number
Average Value
LOANS ORIGINATED
22
$98,283
84
$124,602
128
$84,905
52
$53,908
2
$46,650
20
$110,096
25
$82,368
APPLICATIONS APPROVED, NOT ACCEPTED
6
$73,865
33
$107,600
32
$86,014
12
$28,258
2
$204,100
3
$182,843
17
$75,534
APPLICATIONS DENIED
12
$84,879
52
$94,997
151
$98,649
81
$31,687
0
$0
8
$124,492
40
$59,784
APPLICATIONS WITHDRAWN
2
$62,200
12
$84,655
97
$110,796
10
$103,612
0
$0
3
$121,797
0
$0
FILES CLOSED FOR INCOMPLETENESS
2
$126,345
0
$0
13
$93,834
4
$17,008
0
$0
3
$86,527
0
$0
Aggregated Statistics For Year 2006 (Based on 8 partial tracts)
A) FHA, FSA/RHS & VA Home Purchase Loans
B) Conventional Home Purchase Loans
C) Refinancings
D) Home Improvement Loans
F) Non-occupant Loans on < 5 Family Dwellings (A B C & D)
G) Loans On Manufactured Home Dwelling (A B C & D)
Number
Average Value
Number
Average Value
Number
Average Value
Number
Average Value
Number
Average Value
Number
Average Value
LOANS ORIGINATED
13
$105,825
98
$88,520
146
$74,379
59
$29,871
15
$80,814
40
$58,666
APPLICATIONS APPROVED, NOT ACCEPTED
0
$0
21
$92,813
32
$65,230
19
$14,644
7
$144,000
4
$62,688
APPLICATIONS DENIED
0
$0
45
$98,803
184
$79,003
80
$22,814
16
$72,266
32
$63,363
APPLICATIONS WITHDRAWN
2
$67,695
19
$75,835
132
$90,393
4
$98,648
3
$116,470
2
$135,095
FILES CLOSED FOR INCOMPLETENESS
0
$0
6
$67,900
8
$72,591
0
$0
1
$55,280
0
$0
Aggregated Statistics For Year 2005 (Based on 8 partial tracts)
A) FHA, FSA/RHS & VA Home Purchase Loans
B) Conventional Home Purchase Loans
C) Refinancings
D) Home Improvement Loans
F) Non-occupant Loans on < 5 Family Dwellings (A B C & D)
G) Loans On Manufactured Home Dwelling (A B C & D)
Number
Average Value
Number
Average Value
Number
Average Value
Number
Average Value
Number
Average Value
Number
Average Value
LOANS ORIGINATED
11
$95,715
143
$89,114
154
$72,414
79
$27,135
28
$71,222
24
$60,953
APPLICATIONS APPROVED, NOT ACCEPTED
0
$0
30
$81,264
52
$74,471
16
$39,599
7
$65,137
14
$59,984
APPLICATIONS DENIED
1
$57,880
44
$83,732
218
$79,665
79
$28,445
19
$33,875
27
$37,554
APPLICATIONS WITHDRAWN
4
$94,760
17
$90,542
116
$89,793
22
$83,440
9
$97,167
6
$67,967
FILES CLOSED FOR INCOMPLETENESS
0
$0
2
$103,980
54
$91,865
0
$0
0
$0
0
$0
Aggregated Statistics For Year 2004 (Based on 8 partial tracts)
A) FHA, FSA/RHS & VA Home Purchase Loans
B) Conventional Home Purchase Loans
C) Refinancings
D) Home Improvement Loans
E) Loans on Dwellings For 5+ Families
F) Non-occupant Loans on < 5 Family Dwellings (A B C & D)
G) Loans On Manufactured Home Dwelling (A B C & D)
Number
Average Value
Number
Average Value
Number
Average Value
Number
Average Value
Number
Average Value
Number
Average Value
Number
Average Value
LOANS ORIGINATED
20
$82,322
89
$83,537
144
$68,124
64
$34,203
2
$159,670
27
$69,717
12
$32,501
APPLICATIONS APPROVED, NOT ACCEPTED
2
$103,020
15
$70,109
62
$69,419
7
$20,901
0
$0
3
$38,097
7
$31,964
APPLICATIONS DENIED
6
$75,485
17
$81,852
179
$77,097
80
$25,038
0
$0
7
$65,710
24
$35,833
APPLICATIONS WITHDRAWN
0
$0
11
$58,197
102
$82,271
11
$34,738
0
$0
7
$163,823
4
$52,260
FILES CLOSED FOR INCOMPLETENESS
0
$0
3
$56,807
25
$93,152
3
$60,197
0
$0
0
$0
0
$0
Aggregated Statistics For Year 2003 (Based on 8 partial tracts)
A) FHA, FSA/RHS & VA Home Purchase Loans
B) Conventional Home Purchase Loans
C) Refinancings
D) Home Improvement Loans
F) Non-occupant Loans on < 5 Family Dwellings (A B C & D)
Number
Average Value
Number
Average Value
Number
Average Value
Number
Average Value
Number
Average Value
LOANS ORIGINATED
20
$63,842
77
$76,622
296
$72,097
33
$15,822
15
$80,059
APPLICATIONS APPROVED, NOT ACCEPTED
0
$0
14
$64,171
38
$52,641
2
$11,850
6
$67,477
APPLICATIONS DENIED
2
$31,100
50
$56,847
195
$71,016
38
$22,164
10
$54,649
APPLICATIONS WITHDRAWN
2
$99,015
4
$158,015
97
$66,993
3
$42,217
6
$132,502
FILES CLOSED FOR INCOMPLETENESS
0
$0
0
$0
10
$85,304
2
$19,215
0
$0
Aggregated Statistics For Year 2002 (Based on 8 partial tracts)
A) FHA, FSA/RHS & VA Home Purchase Loans
B) Conventional Home Purchase Loans
C) Refinancings
D) Home Improvement Loans
F) Non-occupant Loans on < 5 Family Dwellings (A B C & D)
Number
Average Value
Number
Average Value
Number
Average Value
Number
Average Value
Number
Average Value
LOANS ORIGINATED
28
$70,649
80
$73,746
162
$67,174
66
$13,113
11
$77,205
APPLICATIONS APPROVED, NOT ACCEPTED
0
$0
12
$58,698
37
$75,221
4
$54,912
1
$114,270
APPLICATIONS DENIED
6
$54,897
32
$33,272
138
$65,538
71
$11,789
3
$55,300
APPLICATIONS WITHDRAWN
4
$55,398
5
$30,158
59
$58,163
7
$21,827
3
$67,230
FILES CLOSED FOR INCOMPLETENESS
0
$0
2
$9,720
15
$81,354
0
$0
0
$0
Aggregated Statistics For Year 2001 (Based on 8 partial tracts)
A) FHA, FSA/RHS & VA Home Purchase Loans
B) Conventional Home Purchase Loans
C) Refinancings
D) Home Improvement Loans
F) Non-occupant Loans on < 5 Family Dwellings (A B C & D)
Number
Average Value
Number
Average Value
Number
Average Value
Number
Average Value
Number
Average Value
LOANS ORIGINATED
28
$66,354
85
$67,598
176
$59,071
71
$11,453
8
$54,732
APPLICATIONS APPROVED, NOT ACCEPTED
2
$26,240
35
$48,327
26
$48,262
10
$8,998
4
$23,812
APPLICATIONS DENIED
8
$53,211
81
$53,058
152
$52,541
71
$16,574
5
$23,760
APPLICATIONS WITHDRAWN
6
$43,735
4
$111,952
58
$47,496
16
$25,594
2
$31,100
FILES CLOSED FOR INCOMPLETENESS
0
$0
10
$48,595
12
$54,352
0
$0
0
$0
Aggregated Statistics For Year 2000 (Based on 8 partial tracts)
A) FHA, FSA/RHS & VA Home Purchase Loans
B) Conventional Home Purchase Loans
C) Refinancings
D) Home Improvement Loans
F) Non-occupant Loans on < 5 Family Dwellings (A B C & D)
Number
Average Value
Number
Average Value
Number
Average Value
Number
Average Value
Number
Average Value
LOANS ORIGINATED
44
$62,402
92
$62,197
71
$35,876
49
$13,247
12
$37,198
APPLICATIONS APPROVED, NOT ACCEPTED
2
$35,960
36
$56,474
18
$39,957
16
$12,786
5
$22,158
APPLICATIONS DENIED
12
$52,696
90
$35,903
75
$45,869
24
$23,200
7
$25,334
APPLICATIONS WITHDRAWN
1
$44,150
15
$65,659
57
$49,414
6
$41,997
3
$33,970
FILES CLOSED FOR INCOMPLETENESS
0
$0
3
$79,703
5
$74,590
0
$0
0
$0
Aggregated Statistics For Year 1999 (Based on 4 partial tracts)
A) FHA, FSA/RHS & VA Home Purchase Loans
B) Conventional Home Purchase Loans
C) Refinancings
D) Home Improvement Loans
E) Loans on Dwellings For 5+ Families
F) Non-occupant Loans on < 5 Family Dwellings (A B C & D)
Detailed PMIC statistics for the following Tracts:0124.00
, 0125.00
2002 - 2018 National Fire Incident Reporting System (NFIRS) incidents
According to the data from the years 2002 - 2018 the average number of fires per year is 17. The highest number of reported fire incidents - 58 took place in 2014, and the least - 2 in 2018. The data has a dropping trend.
When looking into fire subcategories, the most incidents belonged to: Structure Fires (56.4%), and Outside Fires (24.1%).
Fire incident types reported to NFIRS in Zip Code 13865


 Nearest zip codes: 13826, 18847, 18821, 13813, 13795, 13754.


 According to the data from the years 2002 - 2018 the average number of fires per year is 17. The highest number of reported fire incidents - 58 took place in 2014, and the least - 2 in 2018. The data has a dropping trend.
 When looking into fire subcategories, the most incidents belonged to: Structure Fires (56.4%), and Outside Fires (24.1%).