Estimated zip code population in 2022: 5,250 Zip code population in 2010: 6,024 Zip code population in 2000: 5,675
Houses and condos: 2,859 Renter-occupied apartments: 518
% of renters here:
25%
State:
31%
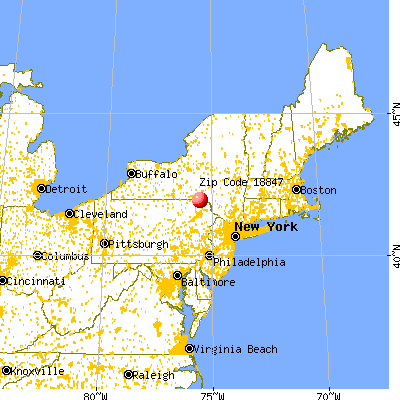
March 2022 cost of living index in zip code 18847: 91.8 (less than average, U.S. average is 100)
Land area: 141.1 sq. mi. Water area: 2.2 sq. mi.
Population density: 37 people per square mile
(very low).
OSM Map
General Map
Google Map
MSN Map
OSM Map
General Map
Google Map
MSN Map
OSM Map
General Map
Google Map
MSN Map
OSM Map
General Map
Google Map
MSN Map
Please wait while loading the map...
Real estate property taxes paid for housing units in 2022:
This zip code:
1.3% ($1,943)
Pennsylvania:
1.3% ($3,094)
Median real estate property taxes paid for housing units with mortgages in 2022: $1,951 (1.2%) Median real estate property taxes paid for housing units with no mortgage in 2022: $1,937 (1.4%)
Business Search- 14 Million verified businesses
Males: 2,815
(53.6%)
Females: 2,434
(46.4%)
For population 25 years and over in 18847:
High school or higher: 90.7%
Bachelor's degree or higher: 17.6%
Graduate or professional degree: 6.2%
Unemployed: 4.7%
Mean travel time to work (commute): 30.2 minutes
For population 15 years and over in 18847:
Never married: 30.2%
Now married: 47.2%
Separated: 1.6%
Widowed: 7.9%
Divorced: 13.1%
Zip code 18847 compared to state average:
Median house value below state average.
Black race population percentage significantly below state average.
Hispanic race population percentage significantly below state average.
Foreign-born population percentage significantly below state average.
Length of stay since moving in significantly above state average.
Number of college students below state average.
Percentage of population with a bachelor's degree or higher below state average.
Averages for the 2020 tax year for zip code 18847, filed in 2021:
Average Adjusted Gross Income (AGI) in 2020: $56,387 (Individual Income Tax Returns)
Here:
$56,387
State:
$75,707
Salary/wage: $43,720 (reported on 76.4% of returns)
Here:
$43,720
State:
$62,806
(% of AGI for various income ranges: 1032.2% for AGIs below $25k, 3181.0% for AGIs $25k-50k, 5940.4% for AGIs $50k-75k, 8019.4% for AGIs $75k-100k, 11632.4% for AGIs $100k-200k)
Taxable interest for individuals: $1,201 (reported on 29.1% of returns)
This zip code:
$1,201
Pennsylvania:
$1,633
(% of AGI for various income ranges: 12.6% for AGIs below $25k, 9.6% for AGIs $25k-50k, 35.4% for AGIs $50k-75k, 73.3% for AGIs $75k-100k, 147.1% for AGIs $100k-200k)
Ordinary dividends: $3,661 (reported on 18.6% of returns)
Here:
$3,661
State:
$7,382
(% of AGI for various income ranges: 22.8% for AGIs below $25k, 27.3% for AGIs $25k-50k, 54.2% for AGIs $50k-75k, 59.4% for AGIs $75k-100k, 395.3% for AGIs $100k-200k)
Net capital gain/loss in AGI: +$9,429 (reported on 13.1% of returns)
Here:
+$9,429
State:
+$23,522
(% of AGI for various income ranges: 3.4% for AGIs below $25k, 26.9% for AGIs $25k-50k, 25.8% for AGIs $50k-75k, 55.6% for AGIs $75k-100k, 481.8% for AGIs $100k-200k)
Profit/loss from business: +$11,097 (reported on 13.5% of returns)
Here:
+$11,097
State:
+$16,274
(% of AGI for various income ranges: 80.7% for AGIs below $25k, 70.6% for AGIs $25k-50k, 153.5% for AGIs $50k-75k, 431.7% for AGIs $75k-100k, 550.6% for AGIs $100k-200k)
Taxable individual retirement arrangement distribution: $19,389 (reported on 11.4% of returns)
18847:
$19,389
Pennsylvania:
$18,583
(% of AGI for various income ranges: 59.3% for AGIs below $25k, 133.1% for AGIs $25k-50k, 170.0% for AGIs $50k-75k, 391.7% for AGIs $75k-100k, 704.1% for AGIs $100k-200k)
Total itemized deductions: $31,383 (reported on 2.5% of returns)
Here:
$31,383
State:
$34,850
(% of AGI for various income ranges: 333.1% for AGIs $50k-75k, 598.2% for AGIs $100k-200k)
Charity contributions: $8,880 (reported on 2.1% of returns)
Here:
$8,880
State:
$12,392
(% of AGI for various income ranges: 261.2% for AGIs $100k-200k)
Taxes paid: $6,817 (reported on 2.5% of returns)
18847:
$6,817
State:
$8,200
(% of AGI for various income ranges: 57.7% for AGIs $50k-75k, 152.4% for AGIs $100k-200k)
Earned income credit: $2,397 (reported on 16.0% of returns)
Here:
$2,397
State:
$2,100
(% of AGI for various income ranges: 97.4% for AGIs below $25k, 70.6% for AGIs $25k-50k)
Percentage of individuals using paid preparers for their 2020 taxes: 95.4%
Here:
95%
State:
92%
(% for various income ranges: 94.0% for AGIs below $25k, 96.6% for AGIs $25k-50k, 94.4% for AGIs $50k-75k, 96.0% for AGIs $75k-100k, 96.2% for AGIs $100k-200k, 100.0% for AGIs over 200k)
Averages for the 2012 tax year for zip code 18847, filed in 2013:
Average Adjusted Gross Income (AGI) in 2012: $42,963 (Individual Income Tax Returns)
Here:
$42,963
State:
$61,346
Salary/wage: $36,421 (reported on 79.1% of returns)
Here:
$36,421
State:
$51,902
(% of AGI for various income ranges: 66.8% for AGIs below $25k, 75.9% for AGIs $25k-50k, 74.2% for AGIs $50k-75k, 72.5% for AGIs $75k-100k, 64.3% for AGIs $100k-200k, 36.8% for AGIs over 200k)
Taxable interest for individuals: $983 (reported on 31.1% of returns)
This zip code:
$983
Pennsylvania:
$1,588
(% of AGI for various income ranges: 1.4% for AGIs below $25k, 0.5% for AGIs $25k-50k, 1.2% for AGIs $50k-75k, 0.3% for AGIs $75k-100k, 0.4% for AGIs $100k-200k, 0.3% for AGIs over 200k)
Ordinary dividends: $2,400 (reported on 20.1% of returns)
Here:
$2,400
State:
$5,827
(% of AGI for various income ranges: 1.3% for AGIs below $25k, 1.0% for AGIs $25k-50k, 1.1% for AGIs $50k-75k, 1.2% for AGIs $75k-100k, 0.7% for AGIs $100k-200k, 1.5% for AGIs over 200k)
Net capital gain/loss in AGI: +$14,841 (reported on 11.9% of returns)
Here:
+$14,841
State:
+$14,495
(% of AGI for various income ranges: 0.4% for AGIs $25k-50k, 1.2% for AGIs $50k-75k, 3.0% for AGIs $75k-100k, 19.3% for AGIs $100k-200k)
Profit/loss from business: +$11,150 (reported on 13.9% of returns)
Here:
+$11,150
State:
+$16,268
(% of AGI for various income ranges: 7.7% for AGIs below $25k, 3.6% for AGIs $25k-50k, 1.8% for AGIs $50k-75k, 3.6% for AGIs $75k-100k, 5.6% for AGIs $100k-200k)
Taxable individual retirement arrangement distribution: $11,450 (reported on 10.7% of returns)
18847:
$11,450
Pennsylvania:
$14,550
(% of AGI for various income ranges: 4.2% for AGIs below $25k, 2.7% for AGIs $25k-50k, 3.1% for AGIs $50k-75k, 3.1% for AGIs $75k-100k, 3.5% for AGIs $100k-200k)
Total itemized deductions: $17,745 (18% of AGI, reported on 15.6% of returns)
Here:
$17,745
State:
$23,538
Here:
18.4% of AGI
State:
18.4% of AGI
(% of AGI for various income ranges: 4.8% for AGIs below $25k, 5.0% for AGIs $25k-50k, 7.1% for AGIs $50k-75k, 6.1% for AGIs $75k-100k, 8.2% for AGIs $100k-200k, 7.1% for AGIs over 200k)
Charity contributions: $3,383 (reported on 9.4% of returns)
Here:
$3,383
State:
$4,025
(% of AGI for various income ranges: 0.2% for AGIs below $25k, 0.4% for AGIs $25k-50k, 0.7% for AGIs $50k-75k, 0.6% for AGIs $75k-100k, 1.6% for AGIs $100k-200k, 0.8% for AGIs over 200k)
Taxes paid: $6,421 (reported on 15.6% of returns)
18847:
$6,421
State:
$9,982
(% of AGI for various income ranges: 1.1% for AGIs below $25k, 1.2% for AGIs $25k-50k, 2.0% for AGIs $50k-75k, 2.5% for AGIs $75k-100k, 3.5% for AGIs $100k-200k, 4.2% for AGIs over 200k)
Earned income credit: $2,174 (reported on 20.5% of returns)
Here:
$2,174
State:
$2,106
(% of AGI for various income ranges: 6.4% for AGIs below $25k, 1.2% for AGIs $25k-50k)
Percentage of individuals using paid preparers for their 2012 taxes: 66.0%
Here:
66%
State:
53%
(% for various income ranges: 60.2% for AGIs below $25k, 66.1% for AGIs $25k-50k, 68.4% for AGIs $50k-75k, 78.9% for AGIs $75k-100k, 78.6% for AGIs $100k-200k, 100.0% for AGIs over 200k)
Averages for the 2004 tax year for zip code 18847, filed in 2005:
Average Adjusted Gross Income (AGI) in 2004: $32,766 (Individual Income Tax Returns)
Here:
$32,766
State:
$48,049
Salary/wage: $29,685 (reported on 81.6% of returns)
Here:
$29,685
State:
$42,646
(% of AGI for various income ranges: 82.7% for AGIs below $10k, 70.6% for AGIs $10k-25k, 74.9% for AGIs $25k-50k, 77.6% for AGIs $50k-75k, 79.3% for AGIs $75k-100k, 64.3% for AGIs over 100k)
Taxable interest for individuals: $1,380 (reported on 43.5% of returns)
This zip code:
$1,380
Pennsylvania:
$1,657
(% of AGI for various income ranges: 5.0% for AGIs below $10k, 2.2% for AGIs $10k-25k, 1.7% for AGIs $25k-50k, 2.0% for AGIs $50k-75k, 1.0% for AGIs $75k-100k, 1.6% for AGIs over 100k)
Taxable dividends: $1,652 (reported on 23.2% of returns)
Here:
$1,652
State:
$3,566
(% of AGI for various income ranges: 3.0% for AGIs below $10k, 1.2% for AGIs $10k-25k, 1.1% for AGIs $25k-50k, 1.1% for AGIs $50k-75k, 0.6% for AGIs $75k-100k, 1.6% for AGIs over 100k)
Net capital gain/loss: +$4,014 (reported on 15.6% of returns)
Here:
+$4,014
State:
+$9,716
(% of AGI for various income ranges: -1.0% for AGIs below $10k, 1.3% for AGIs $10k-25k, 1.3% for AGIs $25k-50k, 1.8% for AGIs $50k-75k, 0.5% for AGIs $75k-100k, 5.3% for AGIs over 100k)
Profit/loss from business: +$10,315 (reported on 16.6% of returns)
Here:
+$10,315
State:
+$14,267
(% of AGI for various income ranges: 2.3% for AGIs below $10k, 6.0% for AGIs $10k-25k, 5.8% for AGIs $25k-50k, 3.2% for AGIs $50k-75k, 3.0% for AGIs $75k-100k, 8.6% for AGIs over 100k)
IRA payment deduction: $3,000 (reported on 3.6% of returns)
18847:
$3,000
Pennsylvania:
$2,903
(% of AGI for various income ranges: 0.4% for AGIs $10k-25k, 0.5% for AGIs $25k-50k, 0.2% for AGIs $50k-75k, 0.5% for AGIs $75k-100k)
Total itemized deductions: $13,743 (20% of AGI, reported on 16.2% of returns)
Here:
$13,743
State:
$18,804
Here:
19.9% of AGI
State:
19.5% of AGI
(% of AGI for various income ranges: 5.0% for AGIs $10k-25k, 5.7% for AGIs $25k-50k, 7.0% for AGIs $50k-75k, 10.5% for AGIs $75k-100k, 8.3% for AGIs over 100k)
Charity contributions deductions: $2,374 (3% of AGI, reported on 12.9% of returns)
Here:
$2,374
State:
$3,337
Here:
3.1% of AGI
State:
3.3% of AGI
(% of AGI for various income ranges: 0.4% for AGIs $10k-25k, 0.7% for AGIs $25k-50k, 0.8% for AGIs $50k-75k, 1.3% for AGIs $75k-100k, 1.9% for AGIs over 100k)
Total tax: $4,400 (reported on 70.9% of returns)
18847:
$4,400
State:
$8,008
(% of AGI for various income ranges: 3.0% for AGIs below $10k, 4.2% for AGIs $10k-25k, 6.8% for AGIs $25k-50k, 9.0% for AGIs $50k-75k, 11.1% for AGIs $75k-100k, 19.4% for AGIs over 100k)
Earned income credit: $1,726 (reported on 18.7% of returns)
Here:
$1,726
State:
$1,643
Percentage of individuals using paid preparers for their 2004 taxes: 66.9%
Here:
67%
State:
56%
(% for various income ranges: 61.5% for AGIs below $10k, 65.3% for AGIs $10k-25k, 69.8% for AGIs $25k-50k, 69.1% for AGIs $50k-75k, 73.1% for AGIs $75k-100k, 81.2% for AGIs over 100k)
Likely homosexual households (counted as self-reported same-sex unmarried-partner households)
Lesbian couples: 0.1% of all households
Gay men: 0.0% of all households
Household received Food Stamps/SNAP in the past 12 months: 431 Household did not receive Food Stamps/SNAP in the past 12 months: 1,656
Women who had a birth in the past 12 months: 73 (49 now married, 23 unmarried) Women who did not have a birth in the past 12 months: 857 (350 now married, 506 unmarried)
Housing units in zip code 18847 with a mortgage: 692 (26 second mortgage, 1 home equity loan, 19 both second mortgage and home equity loan) Houses without a mortgage: 21
Median monthly owner costs for units with a mortgage: $1,213 Median monthly owner costs for units without a mortgage: $517
Residents with income below the poverty level in 2022:
This zip code:
15.2%
Whole state:
11.8%
Residents with income below 50% of the poverty level in 2022:
This zip code:
8.5%
Whole state:
6.1%
Median number of rooms in houses and condos:
Here:
6.4
State:
6.8
Median number of rooms in apartments:
Here:
5.0
State:
4.3
Notable locations in this zip code not listed on our city pages
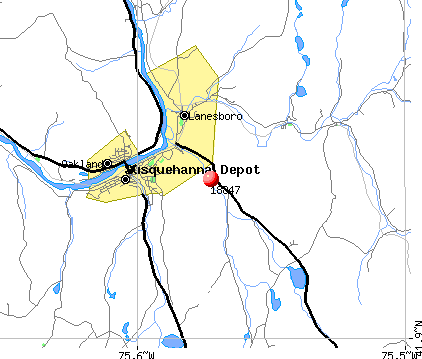
Notable locations in zip code 18847: Gardinier Corners (A), Starrucca Station (B), Camp Willoway (C), Raskelly Corners (D), Steinbachs Corners (E), Susquehanna Fire Department (F). Display/hide their locations on the map
Churches in zip code 18847 include: Locust Hill Church (A), Mission Chapel (B), Saint Martins Church (C), Bethel Hill Church (D). Display/hide their locations on the map
Cemeteries: Lamb Cemetery (1), Evergreen Cemetery (2), North Jackson Cemetery (3), Saint Johns Cemetery (4), Maple Ridge Cemetery (5), East Jackson Cemetery (6). Display/hide their locations on the map
Lakes, reservoirs, and swamps: Butler Lake (A), Star Pond (B), Devils Punch Bowl (C), Potter Lake (D), Churchill Lake (E), Little Butler Lake (F), Pickering Pond (G), Ross Pond (H). Display/hide their locations on the map
Streams, rivers, and creeks: Hilborn Creek (A), High Bridge Creek (B), Hemlock Creek (C), Mitchell Creek (D), Starrucca Creek (E), Deep Hollow Brook (F), Drinker Creek (G), Deacon Brook (H), Little Roaring Brook (I). Display/hide their locations on the map
Parks in zip code 18847 include: State Game Lands Number 299 (1), State Game Lands Number 35 (2), State Game Lands Number 70 (3). Display/hide their locations on the map
In group quarters: 76 (-1 institutionalized population)
Size of family households: 656 2-persons, 231 3-persons, 174 4-persons, 152 5-persons, 30 6-persons, 43 7-or-more-persons
Size of nonfamily households: 670 1-person, 121 2-persons, 2 4-persons
842 married couples with children.
276 single-parent households (156 men, 120 women).
97.3% of residents of 18847 zip code speak English at home.
0.3% of residents speak Spanish at home (27% very well, 53% well, 20% not well).
1.5% of residents speak other Indo-European language at home (93% very well, 7% well).
0.3% of residents speak Asian or Pacific Island language at home (21% very well, 79% well).
0.1% of residents speak other language at home (100% very well).
Foreign born population: 52 (1.0%) (82.6% of them are naturalized citizens)
This zip code:
1.0%
Whole state:
7.5%
20%Taiwan
18%Bhutan
14%France
10%Serbia
8%Ukraine
6%Barbados
4%Germany
33%Irish
13%Italian
12%English
11%German
10%American
5%Polish
2%Scottish
Year of entry for the foreign-born population
202010 or later
82000 to 2009
81990 to 1999
47Before 1990
Facilities with environmental interests located in this zip code:
BARNES KASSON HOSP (400 TURNPIKE ST in SUSQUEHANNA, PA)
AIR MAJOR (AIRS/AFS) CRITERIA AND HAZARDOUS AIR POLLUTANT INVENTORY (Inventory of air pollution sources) STATE MASTER (Pennsylvania database) - RCRIS-PAD079174306, HAZARDOUS WASTE PROGRAM Small Quantity Generators, between 100 kg and 1000 kg of hazardous waste/month (Resource Conservation and Recovery Act (tracking hazardous waste)) - notification Business SIC and NAICS classification: GENERAL MEDICAL AND SURGICAL HOSPITALS Organizations: OPERNAME (CONTACT/OPERATOR)
, NON-PROFIT BOARD (CONTACT/OWNER)
, BARNES KASSON HOSPITAL (CONTACT/OWNER)
Alternative names: BARNES-KASSON COUNTY HOSPITAL
Housing units lacking complete plumbing facilities: 2.7% Housing units lacking complete kitchen facilities: 4.6%
45.8%Fuel oil, kerosene, etc.
18.1%Bottled, tank, or LP gas
16.9%Wood
15.5%Electricity
1.7%Other fuel
1.2%Coal or coke
1.0%Utility gas
Population in 1990: 5,137. Population change in the 1990s: +538 (+10.5%).
Place of birth for U.S.-born residents:
This state: 2,892
Northeast: 1,849
Midwest: 82
South: 277
West: 90
71% of the 18847 zip code residents lived in the same house 5 years ago. Out of people who lived in different houses, 59% lived in this county. Out of people who lived in different counties, 50% lived in Pennsylvania.
91% of the 18847 zip code residents lived in the same house 1 year ago. Out of people who lived in different houses, 40% moved from this county. Out of people who lived in different houses, 26% moved from different county within same state. Out of people who lived in different houses, 33% moved from different state. Out of people who lived in different houses, 1% moved from abroad.
Private vs. public school enrollment:
Students in private schools in grades 1 to 8 (elementary and middle school): 17
Here:
2.9%
Pennsylvania:
15.7%
Students in private schools in grades 9 to 12 (high school): 9
Here:
4.6%
Pennsylvania:
13.4%
Students in private undergraduate colleges: 10
Here:
15.5%
Pennsylvania:
39.8%
Occupation by median earnings in the past 12 months ($)
93,372Architecture and engineering occupations
76,044Education, training, and library occupations
63,543Business and financial operations occupations
63,210Health diagnosing and treating practitioners and other technical occupations
62,363Health technologists and technicians
57,166Transportation occupations
Companies with federal contracts located in this zip code:
SUSQUEHANNA PRECISION INC (285 MAIN ST in SUSQUEHANNA, PA; small business) : $30,260 in 7 contractsfrom 2004 to 2006
Contracts for Switches, Knobs and Pointers, Miscellaneous Communication Equipment by Defense Logistics Agency Signed by year:2000: $0; 2001: $0; 2002: $0; 2003: $0; 2004: $7,380; 2005: $19,880; 2006: $3,000.
Biggest contracts:
$7,300 with Defense Logistics Agency for Switches. Signed on 2005-02-14. Completion date: 2005-04-16.
$7,300, same as above.Signed on 2005-02-14. Completion date: 2005-04-16.
$3,690, same as above.Signed on 2004-12-08. Completion date: 2005-01-13.
$3,690, same as above.Signed on 2004-12-08. Completion date: 2005-01-13.
W&S BUILDERS, INC. (1 N PROGRESS AVE in SUSQUEHANNA, PA; small business)
$11,350 with Public Buildings Service for Lease or Rental of Facilities -- Office Buildings. Signed on 2003-09-15. Completion date: 2003-09-15.
Top industries in this zip code by the number of employees in 2005:
Health Care and Social Assistance: General Medical and Surgical Hospitals (250-499 employees: 1 establishment)
Health Care and Social Assistance: All Other Outpatient Care Centers (50-99: 1)
Other Services (except Public Administration): Civic and Social Organizations (10-19: 2, 5-9: 1)
Professional, Scientific, and Technical Services: Testing Laboratories (20-49: 1)
Finance and Insurance: Commercial Banking (10-19: 1, 5-9: 1)
Accommodation and Food Services: Full-Service Restaurants (10-19: 1, 1-4: 2)
People in group quarters in 2010:
51 people in nursing facilities/skilled-nursing facilities
People in group quarters in 2000:
132 people in nursing homes
17 people in other noninstitutional group quarters
Fatal accident statistics in 2014:
Fatal accident count: 3
Vehicles involved in fatal accidents: 4
Fatal accidents caused by drunken drivers: 1
Fatalities: 3
Persons involved in fatal accidents: 5
Pedestrians involved in fatal accidents: 1
Fatal accident statistics in 2012:
Fatal accident count: 1
Vehicles involved in fatal accidents: 1
Fatal accidents caused by drunken drivers: 1
Fatalities: 1
Persons involved in fatal accidents: 1
Pedestrians involved in fatal accidents: 0
2009 - 2018 National Fire Incident Reporting System (NFIRS) incidents
Based on the data from the years 2009 - 2018 the average number of fire incidents per year is 12. The highest number of reported fire incidents - 17 took place in 2010, and the least - 3 in 2015. The data has a rising trend.
When looking into fire subcategories, the most incidents belonged to: Structure Fires (47.9%), and Outside Fires (28.2%).
Fire incident types reported to NFIRS in Zip Code 18847


 Nearest zip codes: 13865, 18465, 18825, 18821, 18462, 18834.


 Based on the data from the years 2009 - 2018 the average number of fire incidents per year is 12. The highest number of reported fire incidents - 17 took place in 2010, and the least - 3 in 2015. The data has a rising trend.
 When looking into fire subcategories, the most incidents belonged to: Structure Fires (47.9%), and Outside Fires (28.2%).