Estimated zip code population in 2022: 5,842 Zip code population in 2010: 6,220 Zip code population in 2000: 5,982
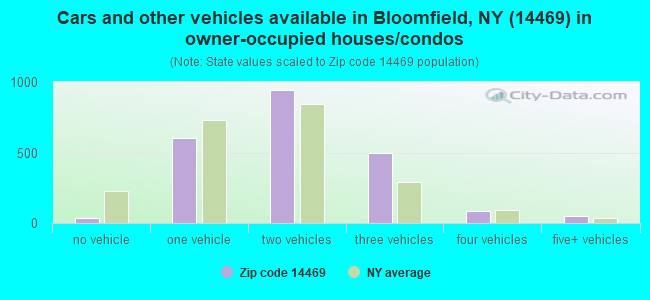
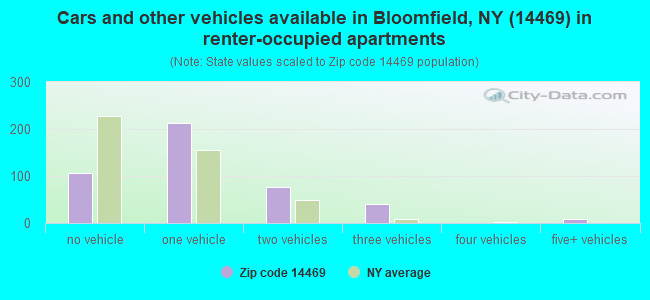
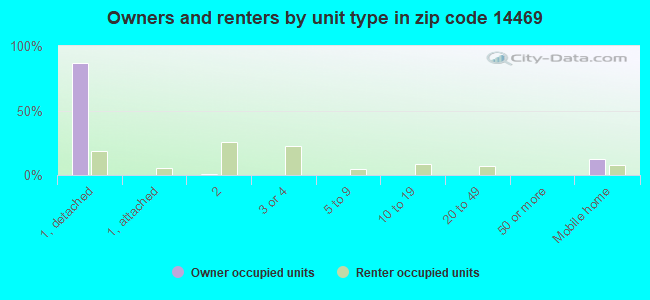
Houses and condos: 2,993 Renter-occupied apartments: 444
% of renters here:
17%
State:
46%
March 2022 cost of living index in zip code 14469: 94.6 (less than average, U.S. average is 100)
Land area: 66.0 sq. mi. Water area: 0.1 sq. mi.
Population density: 89 people per square mile
(very low).
OSM Map
General Map
Google Map
MSN Map
OSM Map
General Map
Google Map
MSN Map
OSM Map
General Map
Google Map
MSN Map
OSM Map
General Map
Google Map
MSN Map
Please wait while loading the map...
Real estate property taxes paid for housing units in 2022:
This zip code:
2.4% ($4,447)
New York:
1.5% ($6,180)
Median real estate property taxes paid for housing units with mortgages in 2022: $4,771 (2.4%) Median real estate property taxes paid for housing units with no mortgage in 2022: $3,867 (2.4%)
Averages for the 2020 tax year for zip code 14469, filed in 2021:
Average Adjusted Gross Income (AGI) in 2020: $67,268 (Individual Income Tax Returns)
Here:
$67,268
State:
$90,930
Salary/wage: $59,256 (reported on 80.2% of returns)
Here:
$59,256
State:
$72,104
(% of AGI for various income ranges: 1073.8% for AGIs below $25k, 3371.0% for AGIs $25k-50k, 6009.5% for AGIs $50k-75k, 8722.9% for AGIs $75k-100k, 17447.8% for AGIs $100k-200k, 67882.5% for AGIs over 200k)
Taxable interest for individuals: $1,284 (reported on 47.3% of returns)
This zip code:
$1,284
New York:
$3,075
(% of AGI for various income ranges: 20.7% for AGIs below $25k, 23.9% for AGIs $25k-50k, 45.1% for AGIs $50k-75k, 47.6% for AGIs $75k-100k, 136.3% for AGIs $100k-200k, 2282.5% for AGIs over 200k)
Ordinary dividends: $5,750 (reported on 25.5% of returns)
Here:
$5,750
State:
$11,095
(% of AGI for various income ranges: 35.8% for AGIs below $25k, 59.5% for AGIs $25k-50k, 114.3% for AGIs $50k-75k, 138.1% for AGIs $75k-100k, 367.8% for AGIs $100k-200k, 5245.0% for AGIs over 200k)
Net capital gain/loss in AGI: +$7,761 (reported on 18.8% of returns)
Here:
+$7,761
State:
+$44,925
(% of AGI for various income ranges: 18.9% for AGIs below $25k, 32.9% for AGIs $25k-50k, 110.3% for AGIs $50k-75k, 171.0% for AGIs $75k-100k, 494.1% for AGIs $100k-200k, 4842.5% for AGIs over 200k)
Profit/loss from business: +$10,752 (reported on 14.1% of returns)
Here:
+$10,752
State:
+$14,940
(% of AGI for various income ranges: 83.5% for AGIs below $25k, 59.0% for AGIs $25k-50k, 130.5% for AGIs $50k-75k, 179.0% for AGIs $75k-100k, 611.1% for AGIs $100k-200k, 2955.0% for AGIs over 200k)
Taxable individual retirement arrangement distribution: $18,011 (reported on 15.1% of returns)
14469:
$18,011
New York:
$19,609
(% of AGI for various income ranges: 127.5% for AGIs below $25k, 183.1% for AGIs $25k-50k, 358.9% for AGIs $50k-75k, 757.1% for AGIs $75k-100k, 1241.1% for AGIs $100k-200k)
Total itemized deductions: $28,493 (reported on 5.0% of returns)
Here:
$28,493
State:
$39,326
(% of AGI for various income ranges: 165.1% for AGIs below $25k, 255.4% for AGIs $50k-75k, 201.9% for AGIs $75k-100k, 412.2% for AGIs $100k-200k, 2210.0% for AGIs over 200k)
Charity contributions: $8,418 (reported on 3.7% of returns)
Here:
$8,418
State:
$15,420
(% of AGI for various income ranges: 43.0% for AGIs $50k-75k, 284.1% for AGIs $100k-200k)
Taxes paid: $8,380 (reported on 5.0% of returns)
14469:
$8,380
State:
$9,183
(% of AGI for various income ranges: 22.4% for AGIs below $25k, 73.0% for AGIs $50k-75k, 96.7% for AGIs $75k-100k, 164.1% for AGIs $100k-200k, 545.0% for AGIs over 200k)
Earned income credit: $2,052 (reported on 10.4% of returns)
Here:
$2,052
State:
$2,138
(% of AGI for various income ranges: 68.0% for AGIs below $25k, 42.3% for AGIs $25k-50k)
Percentage of individuals using paid preparers for their 2020 taxes: 95.3%
Here:
95%
State:
95%
(% for various income ranges: 95.0% for AGIs below $25k, 94.8% for AGIs $25k-50k, 96.0% for AGIs $50k-75k, 96.8% for AGIs $75k-100k, 93.9% for AGIs $100k-200k, 100.0% for AGIs over 200k)
Averages for the 2012 tax year for zip code 14469, filed in 2013:
Average Adjusted Gross Income (AGI) in 2012: $53,309 (Individual Income Tax Returns)
Here:
$53,309
State:
$77,088
Salary/wage: $46,132 (reported on 84.0% of returns)
Here:
$46,132
State:
$60,593
(% of AGI for various income ranges: 75.8% for AGIs below $25k, 75.9% for AGIs $25k-50k, 72.7% for AGIs $50k-75k, 72.7% for AGIs $75k-100k, 74.9% for AGIs $100k-200k, 63.2% for AGIs over 200k)
Taxable interest for individuals: $690 (reported on 48.3% of returns)
This zip code:
$690
New York:
$3,125
(% of AGI for various income ranges: 0.9% for AGIs below $25k, 0.4% for AGIs $25k-50k, 0.7% for AGIs $50k-75k, 0.9% for AGIs $75k-100k, 0.5% for AGIs $100k-200k, 0.6% for AGIs over 200k)
Ordinary dividends: $3,578 (reported on 25.2% of returns)
Here:
$3,578
State:
$10,299
(% of AGI for various income ranges: 1.7% for AGIs below $25k, 1.6% for AGIs $25k-50k, 1.2% for AGIs $50k-75k, 1.1% for AGIs $75k-100k, 1.2% for AGIs $100k-200k, 4.0% for AGIs over 200k)
Net capital gain/loss in AGI: +$4,756 (reported on 17.0% of returns)
Here:
+$4,756
State:
+$42,474
(% of AGI for various income ranges: 0.1% for AGIs below $25k, 0.1% for AGIs $25k-50k, 1.3% for AGIs $50k-75k, 1.2% for AGIs $75k-100k, 1.5% for AGIs $100k-200k, 4.7% for AGIs over 200k)
Profit/loss from business: +$10,386 (reported on 14.3% of returns)
Here:
+$10,386
State:
+$16,168
(% of AGI for various income ranges: 5.8% for AGIs below $25k, 3.8% for AGIs $25k-50k, 2.0% for AGIs $50k-75k, 1.6% for AGIs $75k-100k, 4.1% for AGIs $100k-200k)
Taxable individual retirement arrangement distribution: $14,430 (reported on 12.6% of returns)
14469:
$14,430
New York:
$17,621
(% of AGI for various income ranges: 4.2% for AGIs below $25k, 3.9% for AGIs $25k-50k, 4.2% for AGIs $50k-75k, 3.8% for AGIs $75k-100k, 3.9% for AGIs $100k-200k)
Self-employment retirement plans: $17,167 (reported on 1.0% of returns)
14469:
$17,167
New York:
$27,330
Total itemized deductions: $20,534 (21% of AGI, reported on 32.3% of returns)
Here:
$20,534
State:
$34,985
Here:
21.0% of AGI
State:
21.3% of AGI
(% of AGI for various income ranges: 7.6% for AGIs below $25k, 8.8% for AGIs $25k-50k, 12.4% for AGIs $50k-75k, 12.4% for AGIs $75k-100k, 15.5% for AGIs $100k-200k, 14.2% for AGIs over 200k)
Charity contributions: $2,650 (reported on 27.2% of returns)
Here:
$2,650
State:
$5,572
(% of AGI for various income ranges: 0.7% for AGIs below $25k, 0.9% for AGIs $25k-50k, 1.3% for AGIs $50k-75k, 1.4% for AGIs $75k-100k, 1.8% for AGIs $100k-200k, 1.5% for AGIs over 200k)
Taxes paid: $10,363 (reported on 32.3% of returns)
14469:
$10,363
State:
$18,656
(% of AGI for various income ranges: 2.9% for AGIs below $25k, 3.5% for AGIs $25k-50k, 5.0% for AGIs $50k-75k, 6.3% for AGIs $75k-100k, 8.6% for AGIs $100k-200k, 9.1% for AGIs over 200k)
Earned income credit: $1,934 (reported on 13.9% of returns)
Here:
$1,934
State:
$2,230
(% of AGI for various income ranges: 4.3% for AGIs below $25k, 0.9% for AGIs $25k-50k)
Percentage of individuals using paid preparers for their 2012 taxes: 54.1%
Here:
54%
State:
66%
(% for various income ranges: 46.4% for AGIs below $25k, 53.6% for AGIs $25k-50k, 57.8% for AGIs $50k-75k, 58.8% for AGIs $75k-100k, 66.7% for AGIs $100k-200k, 83.3% for AGIs over 200k)
Averages for the 2004 tax year for zip code 14469, filed in 2005:
Average Adjusted Gross Income (AGI) in 2004: $45,973 (Individual Income Tax Returns)
Here:
$45,973
State:
$59,519
Salary/wage: $39,545 (reported on 87.8% of returns)
Here:
$39,545
State:
$50,673
(% of AGI for various income ranges: 134.0% for AGIs below $10k, 79.3% for AGIs $10k-25k, 79.4% for AGIs $25k-50k, 81.1% for AGIs $50k-75k, 81.7% for AGIs $75k-100k, 61.0% for AGIs over 100k)
Taxable interest for individuals: $938 (reported on 55.0% of returns)
This zip code:
$938
New York:
$2,377
(% of AGI for various income ranges: 5.4% for AGIs below $10k, 1.3% for AGIs $10k-25k, 1.0% for AGIs $25k-50k, 0.8% for AGIs $50k-75k, 0.7% for AGIs $75k-100k, 1.5% for AGIs over 100k)
Taxable dividends: $1,780 (reported on 28.5% of returns)
Here:
$1,780
State:
$5,394
(% of AGI for various income ranges: 2.8% for AGIs below $10k, 0.7% for AGIs $10k-25k, 0.9% for AGIs $25k-50k, 0.8% for AGIs $50k-75k, 0.6% for AGIs $75k-100k, 1.8% for AGIs over 100k)
Net capital gain/loss: +$10,916 (reported on 19.3% of returns)
Here:
+$10,916
State:
+$23,581
(% of AGI for various income ranges: -1.2% for AGIs below $10k, 0.5% for AGIs $10k-25k, 0.7% for AGIs $25k-50k, 1.3% for AGIs $50k-75k, 0.5% for AGIs $75k-100k, 13.8% for AGIs over 100k)
Profit/loss from business: +$9,794 (reported on 15.2% of returns)
Here:
+$9,794
State:
+$13,809
(% of AGI for various income ranges: 8.5% for AGIs below $10k, 4.6% for AGIs $10k-25k, 2.7% for AGIs $25k-50k, 1.9% for AGIs $50k-75k, 3.1% for AGIs $75k-100k, 4.2% for AGIs over 100k)
IRA payment deduction: $2,763 (reported on 3.4% of returns)
14469:
$2,763
New York:
$3,115
(% of AGI for various income ranges: 0.2% for AGIs $10k-25k, 0.3% for AGIs $25k-50k, 0.3% for AGIs $50k-75k, 0.3% for AGIs $75k-100k)
Self-employed pension: $11,643 (reported on 1.0% of returns)
Here:
$11,643
New York:
$19,016
Total itemized deductions: $17,295 (21% of AGI, reported on 36.0% of returns)
Here:
$17,295
State:
$25,864
Here:
21.2% of AGI
State:
21.9% of AGI
(% of AGI for various income ranges: 12.5% for AGIs below $10k, 8.0% for AGIs $10k-25k, 11.3% for AGIs $25k-50k, 13.5% for AGIs $50k-75k, 16.5% for AGIs $75k-100k, 14.7% for AGIs over 100k)
Charity contributions deductions: $2,934 (3% of AGI, reported on 32.3% of returns)
Here:
$2,934
State:
$4,439
Here:
3.5% of AGI
State:
3.6% of AGI
(% of AGI for various income ranges: 0.8% for AGIs $10k-25k, 1.2% for AGIs $25k-50k, 1.8% for AGIs $50k-75k, 2.0% for AGIs $75k-100k, 3.4% for AGIs over 100k)
Total tax: $6,259 (reported on 78.4% of returns)
14469:
$6,259
State:
$11,730
(% of AGI for various income ranges: 3.8% for AGIs below $10k, 4.4% for AGIs $10k-25k, 6.8% for AGIs $25k-50k, 8.5% for AGIs $50k-75k, 10.4% for AGIs $75k-100k, 17.2% for AGIs over 100k)
Earned income credit: $1,547 (reported on 11.3% of returns)
Here:
$1,547
State:
$1,757
Percentage of individuals using paid preparers for their 2004 taxes: 57.1%
Here:
57%
State:
67%
(% for various income ranges: 44.2% for AGIs below $10k, 53.2% for AGIs $10k-25k, 61.7% for AGIs $25k-50k, 59.8% for AGIs $50k-75k, 66.1% for AGIs $75k-100k, 67.9% for AGIs over 100k)
Household received Food Stamps/SNAP in the past 12 months: 262 Household did not receive Food Stamps/SNAP in the past 12 months: 2,406
Women who had a birth in the past 12 months: 58 (50 now married, 7 unmarried) Women who did not have a birth in the past 12 months: 1,014 (616 now married, 385 unmarried)
Housing units in zip code 14469 with a mortgage: 1,287 (176 second mortgage, 172 both second mortgage and home equity loan) Houses without a mortgage: 163
Median monthly owner costs for units with a mortgage: $1,477 Median monthly owner costs for units without a mortgage: $642
Residents with income below the poverty level in 2022:
This zip code:
8.8%
Whole state:
14.3%
Residents with income below 50% of the poverty level in 2022:
This zip code:
6.0%
Whole state:
6.8%
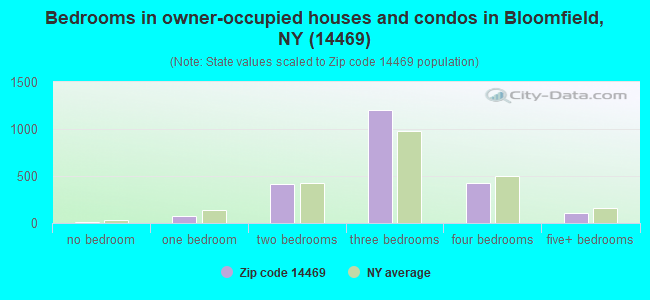
Median number of rooms in houses and condos:
Here:
6.2
State:
6.3
Median number of rooms in apartments:
Here:
4.2
State:
3.8
Notable locations in this zip code not listed on our city pages
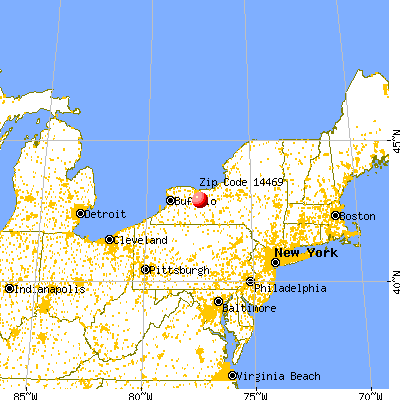
Notable locations in zip code 14469: Sullivans Farm (A), Bloomfield Village Wastewater Treatment Plant (B), Allens Hill Free Library (C), Bloomfield Public Library (D), East Bloomfield Fire House (E). Display/hide their locations on the map
Churches in zip code 14469 include: West Bloomfield Congregational Church (A), Pilgrim Bible Church of Bristol (B), Saint Josephs Church (C). Display/hide their locations on the map
Cemeteries: Rural Cemetery (1), Millers Corners Cemetery (2), Parker Cemetery (3), Gunn Cemetery (4), East Bloomfield Cemetery (5), Dibble Cemetery (6), Allens Hill Cemetery (7). Display/hide their locations on the map
In group quarters: 28 (-1 institutionalized population)
Size of family households: 1,025 2-persons, 286 3-persons, 330 4-persons, 151 5-persons, 7 6-persons, 4 7-or-more-persons
Size of nonfamily households: 778 1-person, 104 2-persons, 1 3-persons
727 married couples with children.
225 single-parent households (75 men, 150 women).
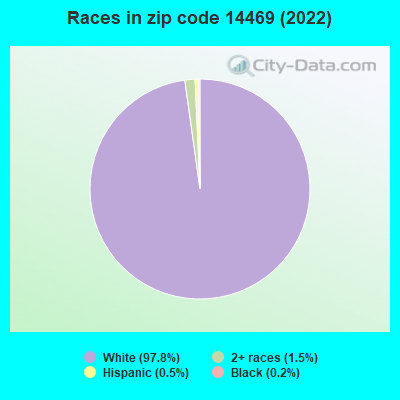
99.0% of residents of 14469 zip code speak English at home.
0.7% of residents speak Spanish at home (83% very well, 17% well).
0.7% of residents speak other Indo-European language at home (51% very well, 49% well).
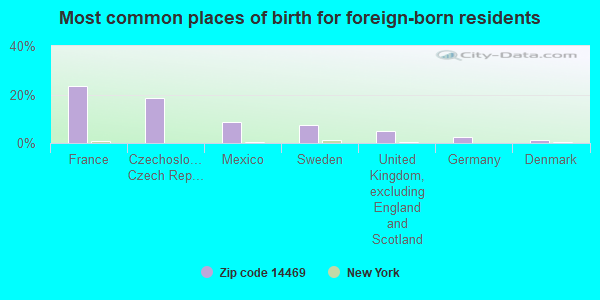
Foreign born population: 81 (1.4%) (68.2% of them are naturalized citizens)
This zip code:
1.4%
Whole state:
22.7%
23%France
19%Czechoslovakia (includes Czech Republic and Slovakia)
9%Mexico
7%Sweden
5%United Kingdom, excluding England and Scotland
2%Germany
1%Denmark
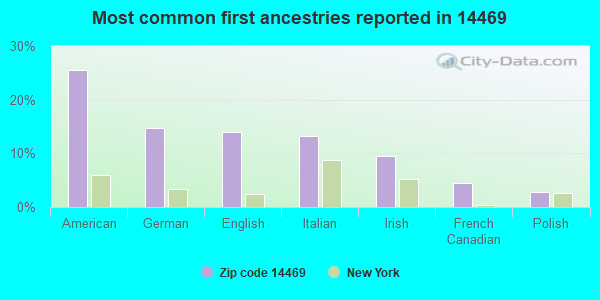
25%American
15%German
14%English
13%Italian
10%Irish
4%French Canadian
3%Polish
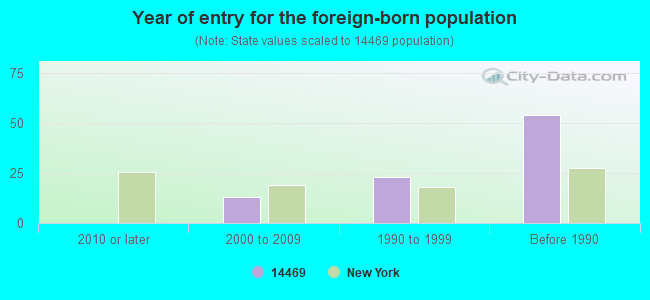
Year of entry for the foreign-born population
02010 or later
132000 to 2009
231990 to 1999
54Before 1990
Facilities with environmental interests located in this zip code:
COMMODORE TECHNOLOGY (26 MAPLE AVE in EAST BLOOMFIELD, NY)
STATE MASTER (New York facility tracking) - AIR PROGRAM, FORMAL ENFORCEMENT ACTION (Integrated Compliance Information System) - ICIS-02-2005-1316, ENFORCEMENT/COMPLIANCE ACTIVITY Business SIC classification: MANUFACTURING INDUSTRIES Organizations: CP HOLDING GROUP INC, COMMODORE MACHINE CO INC (LEGALLY RESPONSIBLE PARTY)
Alternative names: COMMODORE MACHINE CO
GULLO MACHINE & TOOL INC (4 E MAIN ST in BLOOMFIELD, NY)
(Resource Conservation and Recovery Act (tracking hazardous waste))
IBARRA JAMES & PHILOMENA (3698 ESTY ROAD in BLOOMFIELD, NY)
(Resource Conservation and Recovery Act (tracking hazardous waste))
CREEKSIDE GUN SHOP INC (E MAIN ST 6426 COUNTY RD 30 in HOLCOMB, NY)
Conditionally Exempt Small Quantity Generators, less than 100 kg/month of hazardous waste (Resource Conservation and Recovery Act (tracking hazardous waste)) - notification TRANSPORTER (Resource Conservation and Recovery Act (tracking hazardous waste)) - notification Organizations: TERRY TURNBULL (CONTACT/OWNER)
COMMODORE FOAM PRODUCTS (26 MAPLE AVENUE in HOLCOMB, NY)
(Resource Conservation and Recovery Act (tracking hazardous waste))
INFORMATION TRANSFER IND INC (2 E MAIN ST in HOLCOMB, NY)
Conditionally Exempt Small Quantity Generators, less than 100 kg/month of hazardous waste (Resource Conservation and Recovery Act (tracking hazardous waste))
Housing units lacking complete plumbing facilities: 2.6% Housing units lacking complete kitchen facilities: 2.6%
53.0%Utility gas
18.3%Bottled, tank, or LP gas
10.9%Fuel oil, kerosene, etc.
7.9%Electricity
3.3%Other fuel
2.6%Wood
2.4%Coal or coke
1.7%No fuel used
Population in 1990: 6,129.
Place of birth for U.S.-born residents:
This state: 5,014
Northeast: 340
Midwest: 130
South: 103
West: 147
67% of the 14469 zip code residents lived in the same house 5 years ago. Out of people who lived in different houses, 55% lived in this county. Out of people who lived in different counties, 50% lived in New York.
96% of the 14469 zip code residents lived in the same house 1 year ago. Out of people who lived in different houses, 37% moved from this county. Out of people who lived in different houses, 58% moved from different county within same state. Out of people who lived in different houses, 4% moved from different state.
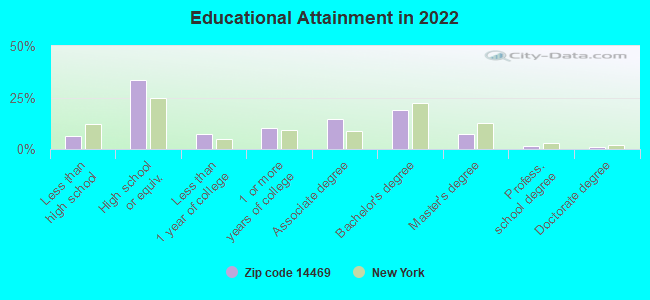
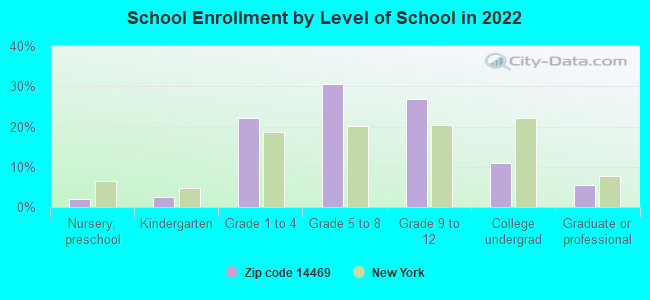
Private vs. public school enrollment:
Students in private schools in grades 1 to 8 (elementary and middle school): 49
Here:
9.5%
New York:
15.6%
Students in private schools in grades 9 to 12 (high school): 20
Here:
7.7%
New York:
15.0%
Students in private undergraduate colleges: 26
Here:
24.6%
New York:
39.2%
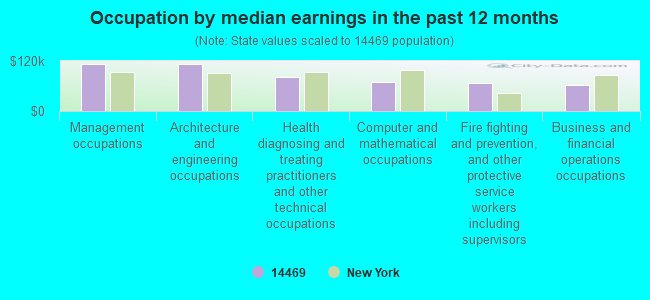
Occupation by median earnings in the past 12 months ($)
112,104Management occupations
111,657Architecture and engineering occupations
82,296Health diagnosing and treating practitioners and other technical occupations
69,207Computer and mathematical occupations
66,443Fire fighting and prevention, and other protective service workers including supervisors
62,301Business and financial operations occupations
Companies with federal contracts located in this zip code:
SENECA GORHAM SECURITY SYSTEMS (22 MAIN STREET in BLOOMFIELD, NY; small business) : $12,803 in 2 contractsin 2003
$12,079 with U.S. Army Corps of Engineers - civil program financing only for Construction of Structures and Facilities -- Dams. Signed on 2003-09-19. Completion date: 2003-11-30.
$724 with U.S. Army Corps of Engineers - civil program financing only for Surveillance Services. Signed on 2003-04-29. Completion date: 2003-04-22.
Top industries in this zip code by the number of employees in 2005:
Accommodation and Food Services: Full-Service Restaurants (10-19: 1, 5-9: 3)
Construction: Commercial and Institutional Building Construction (20-49: 1, 1-4: 1)
Other Services (except Public Administration): Commercial and Industrial Machinery and Equipment (except Automotive and Electronic) Repair and Maintenance (20-49: 1)
Construction: Structural Steel and Precast Concrete Contractors (20-49: 1)
People in group quarters in 2010:
18 people in group homes intended for adults
People in group quarters in 2000:
21 people in homes or halfway houses for drug/alcohol abuse
6 people in homes for the mentally retarded
Fatal accident statistics in 2014:
Fatal accident count: 1
Vehicles involved in fatal accidents: 1
Fatal accidents caused by drunken drivers: 0
Fatalities: 1
Persons involved in fatal accidents: 1
Pedestrians involved in fatal accidents: 0
Fatal accident statistics in 2012:
Fatal accident count: 1
Vehicles involved in fatal accidents: 2
Fatal accidents caused by drunken drivers: 0
Fatalities: 2
Persons involved in fatal accidents: 4
Pedestrians involved in fatal accidents: 0
Home Mortgage Disclosure Act Aggregated Statistics For Year 2009 (Based on 4 partial tracts)
A) FHA, FSA/RHS & VA Home Purchase Loans
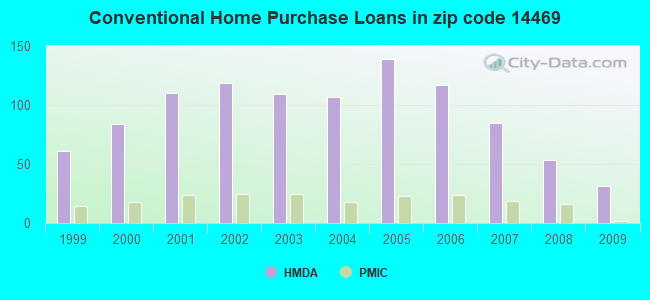
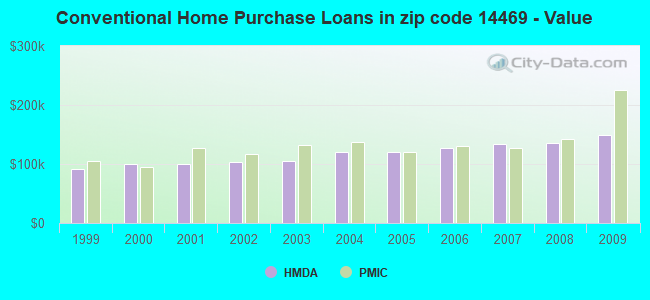
B) Conventional Home Purchase Loans
C) Refinancings
D) Home Improvement Loans
F) Non-occupant Loans on < 5 Family Dwellings (A B C & D)
G) Loans On Manufactured Home Dwelling (A B C & D)
Number
Average Value
Number
Average Value
Number
Average Value
Number
Average Value
Number
Average Value
Number
Average Value
LOANS ORIGINATED
34
$131,631
31
$148,461
144
$147,887
63
$37,208
10
$174,093
16
$32,452
APPLICATIONS APPROVED, NOT ACCEPTED
5
$147,550
6
$116,472
20
$160,344
0
$0
0
$0
6
$36,432
APPLICATIONS DENIED
6
$126,335
3
$252,530
44
$174,846
15
$59,879
2
$392,640
5
$29,146
APPLICATIONS WITHDRAWN
3
$81,937
0
$0
28
$152,361
6
$85,008
0
$0
0
$0
FILES CLOSED FOR INCOMPLETENESS
0
$0
0
$0
9
$131,027
0
$0
0
$0
0
$0
Aggregated Statistics For Year 2008 (Based on 4 partial tracts)
A) FHA, FSA/RHS & VA Home Purchase Loans
B) Conventional Home Purchase Loans
C) Refinancings
D) Home Improvement Loans
F) Non-occupant Loans on < 5 Family Dwellings (A B C & D)
G) Loans On Manufactured Home Dwelling (A B C & D)
Number
Average Value
Number
Average Value
Number
Average Value
Number
Average Value
Number
Average Value
Number
Average Value
LOANS ORIGINATED
21
$115,593
53
$135,037
95
$118,361
44
$18,786
10
$156,801
17
$47,024
APPLICATIONS APPROVED, NOT ACCEPTED
3
$224,047
9
$161,976
9
$174,230
8
$40,965
0
$0
6
$43,263
APPLICATIONS DENIED
5
$137,116
13
$61,175
40
$100,933
20
$59,137
0
$0
15
$30,866
APPLICATIONS WITHDRAWN
1
$81,810
6
$167,775
30
$159,834
11
$41,804
0
$0
0
$0
FILES CLOSED FOR INCOMPLETENESS
2
$163,185
2
$77,420
4
$147,502
2
$110,055
0
$0
0
$0
Aggregated Statistics For Year 2007 (Based on 4 partial tracts)
A) FHA, FSA/RHS & VA Home Purchase Loans
B) Conventional Home Purchase Loans
C) Refinancings
D) Home Improvement Loans
E) Loans on Dwellings For 5+ Families
F) Non-occupant Loans on < 5 Family Dwellings (A B C & D)
G) Loans On Manufactured Home Dwelling (A B C & D)
Number
Average Value
Number
Average Value
Number
Average Value
Number
Average Value
Number
Average Value
Number
Average Value
Number
Average Value
LOANS ORIGINATED
21
$127,972
85
$134,529
136
$112,428
58
$23,457
3
$1,151,657
14
$170,988
9
$32,047
APPLICATIONS APPROVED, NOT ACCEPTED
2
$81,570
11
$120,745
40
$106,799
5
$39,198
0
$0
1
$60,280
2
$62,995
APPLICATIONS DENIED
2
$37,190
22
$73,620
93
$120,104
32
$20,024
0
$0
2
$92,570
10
$40,898
APPLICATIONS WITHDRAWN
2
$95,635
3
$125,507
54
$147,521
2
$68,310
0
$0
0
$0
0
$0
FILES CLOSED FOR INCOMPLETENESS
2
$97,910
5
$109,236
15
$137,949
2
$124,945
2
$1,669,800
1
$47,360
0
$0
Aggregated Statistics For Year 2006 (Based on 4 partial tracts)
A) FHA, FSA/RHS & VA Home Purchase Loans
B) Conventional Home Purchase Loans
C) Refinancings
D) Home Improvement Loans
F) Non-occupant Loans on < 5 Family Dwellings (A B C & D)
G) Loans On Manufactured Home Dwelling (A B C & D)
Number
Average Value
Number
Average Value
Number
Average Value
Number
Average Value
Number
Average Value
Number
Average Value
LOANS ORIGINATED
14
$116,996
117
$126,345
130
$120,002
63
$21,152
13
$157,912
17
$30,709
APPLICATIONS APPROVED, NOT ACCEPTED
0
$0
22
$87,867
20
$122,264
5
$21,776
0
$0
14
$31,336
APPLICATIONS DENIED
2
$113,090
16
$117,002
87
$109,709
59
$32,089
1
$249,060
7
$30,091
APPLICATIONS WITHDRAWN
0
$0
3
$97,190
51
$89,932
12
$66,277
0
$0
3
$14,167
FILES CLOSED FOR INCOMPLETENESS
2
$22,770
6
$209,990
17
$148,402
0
$0
2
$103,985
0
$0
Aggregated Statistics For Year 2005 (Based on 4 partial tracts)
A) FHA, FSA/RHS & VA Home Purchase Loans
B) Conventional Home Purchase Loans
C) Refinancings
D) Home Improvement Loans
F) Non-occupant Loans on < 5 Family Dwellings (A B C & D)
G) Loans On Manufactured Home Dwelling (A B C & D)
Number
Average Value
Number
Average Value
Number
Average Value
Number
Average Value
Number
Average Value
Number
Average Value
LOANS ORIGINATED
17
$114,524
139
$120,598
138
$117,374
54
$24,515
19
$136,562
17
$29,616
APPLICATIONS APPROVED, NOT ACCEPTED
3
$210,497
16
$103,597
27
$121,752
5
$27,932
2
$43,265
6
$45,135
APPLICATIONS DENIED
0
$0
26
$81,656
109
$123,114
35
$27,787
4
$101,700
9
$38,140
APPLICATIONS WITHDRAWN
0
$0
12
$93,582
63
$130,690
5
$144,370
3
$73,433
0
$0
FILES CLOSED FOR INCOMPLETENESS
0
$0
8
$173,931
38
$124,962
2
$26,855
2
$294,880
0
$0
Aggregated Statistics For Year 2004 (Based on 4 partial tracts)
A) FHA, FSA/RHS & VA Home Purchase Loans
B) Conventional Home Purchase Loans
C) Refinancings
D) Home Improvement Loans
F) Non-occupant Loans on < 5 Family Dwellings (A B C & D)
G) Loans On Manufactured Home Dwelling (A B C & D)
Number
Average Value
Number
Average Value
Number
Average Value
Number
Average Value
Number
Average Value
Number
Average Value
LOANS ORIGINATED
11
$109,100
107
$121,071
194
$105,283
57
$26,154
9
$161,120
10
$18,086
APPLICATIONS APPROVED, NOT ACCEPTED
5
$122,654
5
$94,022
30
$113,016
6
$21,330
0
$0
8
$57,115
APPLICATIONS DENIED
3
$122,453
28
$77,861
127
$110,971
35
$38,510
7
$83,813
20
$40,027
APPLICATIONS WITHDRAWN
0
$0
13
$99,922
77
$128,584
4
$66,088
3
$117,870
3
$10,413
FILES CLOSED FOR INCOMPLETENESS
0
$0
0
$0
44
$111,308
0
$0
0
$0
0
$0
Aggregated Statistics For Year 2003 (Based on 4 partial tracts)
A) FHA, FSA/RHS & VA Home Purchase Loans
B) Conventional Home Purchase Loans
C) Refinancings
D) Home Improvement Loans
F) Non-occupant Loans on < 5 Family Dwellings (A B C & D)
Number
Average Value
Number
Average Value
Number
Average Value
Number
Average Value
Number
Average Value
LOANS ORIGINATED
24
$106,285
109
$105,789
411
$104,862
45
$14,984
16
$119,839
APPLICATIONS APPROVED, NOT ACCEPTED
0
$0
15
$48,955
44
$106,727
9
$38,781
1
$51,340
APPLICATIONS DENIED
2
$79,115
19
$69,233
117
$101,634
24
$15,802
6
$61,465
APPLICATIONS WITHDRAWN
0
$0
14
$97,978
88
$107,530
6
$37,017
5
$49,504
FILES CLOSED FOR INCOMPLETENESS
2
$60,720
0
$0
17
$138,625
2
$21,320
0
$0
Aggregated Statistics For Year 2002 (Based on 4 partial tracts)
A) FHA, FSA/RHS & VA Home Purchase Loans
B) Conventional Home Purchase Loans
C) Refinancings
D) Home Improvement Loans
F) Non-occupant Loans on < 5 Family Dwellings (A B C & D)
Number
Average Value
Number
Average Value
Number
Average Value
Number
Average Value
Number
Average Value
LOANS ORIGINATED
19
$102,913
119
$102,938
281
$102,621
63
$14,556
14
$113,211
APPLICATIONS APPROVED, NOT ACCEPTED
2
$89,560
14
$60,543
39
$102,827
8
$21,245
3
$191,340
APPLICATIONS DENIED
7
$77,737
43
$46,665
89
$96,021
17
$15,635
7
$37,959
APPLICATIONS WITHDRAWN
0
$0
9
$104,472
76
$110,762
10
$50,036
2
$72,090
FILES CLOSED FOR INCOMPLETENESS
0
$0
0
$0
18
$132,236
0
$0
2
$89,560
Aggregated Statistics For Year 2001 (Based on 4 partial tracts)
A) FHA, FSA/RHS & VA Home Purchase Loans
B) Conventional Home Purchase Loans
C) Refinancings
D) Home Improvement Loans
F) Non-occupant Loans on < 5 Family Dwellings (A B C & D)
Number
Average Value
Number
Average Value
Number
Average Value
Number
Average Value
Number
Average Value
LOANS ORIGINATED
23
$97,591
110
$99,749
226
$100,116
45
$20,582
6
$179,290
APPLICATIONS APPROVED, NOT ACCEPTED
0
$0
18
$66,074
25
$116,067
20
$17,952
0
$0
APPLICATIONS DENIED
0
$0
59
$38,997
90
$93,490
30
$16,362
1
$322,260
APPLICATIONS WITHDRAWN
0
$0
3
$76,590
75
$93,777
9
$24,966
1
$77,830
FILES CLOSED FOR INCOMPLETENESS
0
$0
2
$68,820
10
$93,390
0
$0
0
$0
Aggregated Statistics For Year 2000 (Based on 4 partial tracts)
A) FHA, FSA/RHS & VA Home Purchase Loans
B) Conventional Home Purchase Loans
C) Refinancings
D) Home Improvement Loans
F) Non-occupant Loans on < 5 Family Dwellings (A B C & D)
Number
Average Value
Number
Average Value
Number
Average Value
Number
Average Value
Number
Average Value
LOANS ORIGINATED
21
$90,814
84
$99,897
66
$77,622
56
$12,761
4
$104,860
APPLICATIONS APPROVED, NOT ACCEPTED
5
$84,704
22
$68,684
17
$76,400
19
$16,355
2
$70,695
APPLICATIONS DENIED
0
$0
58
$56,445
52
$58,651
28
$21,233
0
$0
APPLICATIONS WITHDRAWN
1
$48,020
3
$69,367
26
$56,192
6
$61,732
5
$68,614
FILES CLOSED FOR INCOMPLETENESS
0
$0
2
$214,095
12
$92,302
0
$0
0
$0
Aggregated Statistics For Year 1999 (Based on 2 partial tracts)
A) FHA, FSA/RHS & VA Home Purchase Loans
B) Conventional Home Purchase Loans
C) Refinancings
D) Home Improvement Loans
F) Non-occupant Loans on < 5 Family Dwellings (A B C & D)
Detailed PMIC statistics for the following Tracts:0505.00
, 0521.00
2002 - 2018 National Fire Incident Reporting System (NFIRS) incidents
According to the data from the years 2002 - 2018 the average number of fire incidents per year is 17. The highest number of fire incidents - 32 took place in 2007, and the least - 3 in 2004. The data has a decreasing trend.
When looking into fire subcategories, the most reports belonged to: Structure Fires (45.8%), and Outside Fires (30.4%).
Fire incident types reported to NFIRS in Zip Code 14469


 Nearest zip codes: 14475, 14585, 14564, 14471, 14485, 14506.
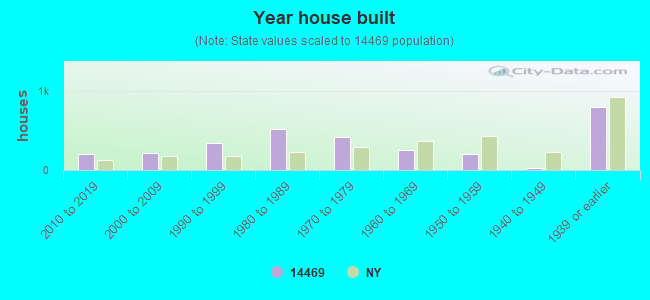


 According to the data from the years 2002 - 2018 the average number of fire incidents per year is 17. The highest number of fire incidents - 32 took place in 2007, and the least - 3 in 2004. The data has a decreasing trend.
 When looking into fire subcategories, the most reports belonged to: Structure Fires (45.8%), and Outside Fires (30.4%).