Estimated zip code population in 2022: 1,032 Zip code population in 2010: 1,031 Zip code population in 2000: 1,071
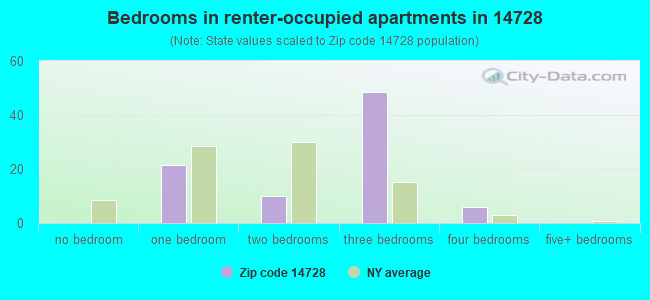
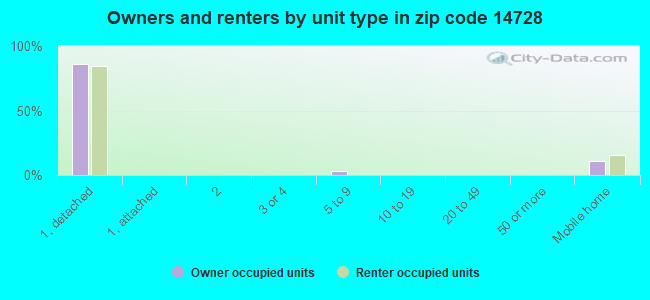
Houses and condos: 1,043 Renter-occupied apartments: 86
% of renters here:
19%
State:
46%
March 2022 cost of living index in zip code 14728: 95.2 (less than average, U.S. average is 100)
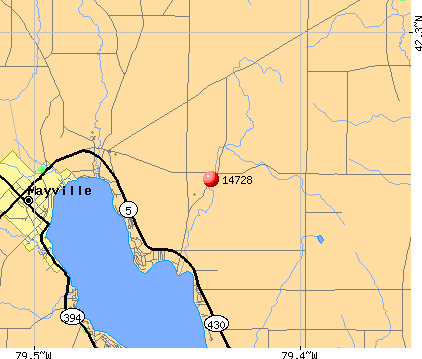
Land area: 26.8 sq. mi. Water area: 0.0 sq. mi.
Population density: 39 people per square mile
(very low).
OSM Map
General Map
Google Map
MSN Map
OSM Map
General Map
Google Map
MSN Map
OSM Map
General Map
Google Map
MSN Map
OSM Map
General Map
Google Map
MSN Map
Please wait while loading the map...
Real estate property taxes paid for housing units in 2022:
This zip code:
1.3% ($2,421)
New York:
1.5% ($6,180)
Median real estate property taxes paid for housing units with mortgages in 2022: $2,878 (1.1%) Median real estate property taxes paid for housing units with no mortgage in 2022: $1,991 (2.0%)
Business Search- 14 Million verified businesses
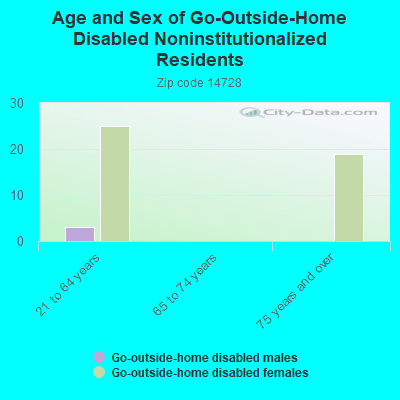
Males: 505
(48.9%)
Females: 527
(51.1%)
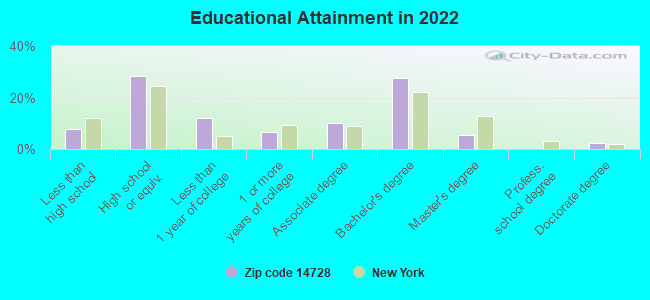
For population 25 years and over in 14728:
High school or higher: 92.3%
Bachelor's degree or higher: 35.1%
Graduate or professional degree: 7.8%
Unemployed: 1.2%
Mean travel time to work (commute): 15.9 minutes
For population 15 years and over in 14728:
Never married: 36.0%
Now married: 49.1%
Separated: 0.0%
Widowed: 7.3%
Divorced: 7.6%
Zip code 14728 compared to state average:
Median house value below state average.
Unemployed percentage significantly below state average.
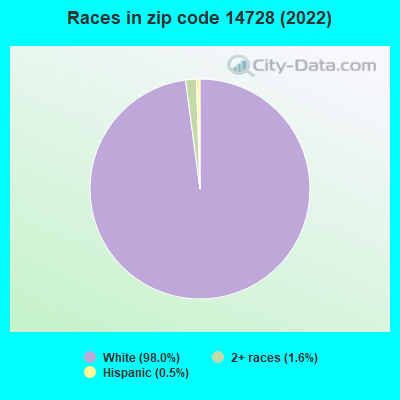
Black race population percentage significantly below state average.
Hispanic race population percentage significantly below state average.
Median age above state average.
Foreign-born population percentage significantly below state average.
Renting percentage significantly below state average.
Length of stay since moving in above state average.
Number of college students significantly below state average.
Estimated median house/condo value in 2022: $185,241
14728:
$185,241
New York:
$400,400
According to our research of New York and other state lists, there was 1 registered sex offender living in 14728 zip code as of May 28, 2024. The ratio of all residents to sex offenders in zip code 14728 is 945 to 1. The ratio of registered sex offenders to all residents in this zip code is near the state average.
Median resident age:
This zip code:
45.0 years
New York median age:
40.0 years
Average household size:
This zip code:
2.3 people
New York:
2.5 people
Averages for the 2020 tax year for zip code 14728, filed in 2021:
Average Adjusted Gross Income (AGI) in 2020: $65,557 (Individual Income Tax Returns)
Here:
$65,557
State:
$90,930
Salary/wage: $54,244 (reported on 72.3% of returns)
Here:
$54,244
State:
$72,104
(% of AGI for various income ranges: 1124.4% for AGIs below $25k, 3605.0% for AGIs $25k-50k, 6126.0% for AGIs $50k-75k, 8676.7% for AGIs $75k-100k, 22202.5% for AGIs $100k-200k)
Taxable interest for individuals: $635 (reported on 36.2% of returns)
This zip code:
$635
New York:
$3,075
(% of AGI for various income ranges: 35.6% for AGIs below $25k, 33.8% for AGIs $25k-50k, 54.0% for AGIs $50k-75k, 55.0% for AGIs $100k-200k)
Ordinary dividends: $4,775 (reported on 25.5% of returns)
Here:
$4,775
State:
$11,095
(% of AGI for various income ranges: 94.4% for AGIs below $25k, 100.0% for AGIs $25k-50k, 86.0% for AGIs $50k-75k, 912.5% for AGIs $100k-200k)
Net capital gain/loss in AGI: +$10,000 (reported on 19.1% of returns)
Here:
+$10,000
State:
+$44,925
(% of AGI for various income ranges: 74.4% for AGIs below $25k, 198.0% for AGIs $50k-75k, 1835.0% for AGIs $100k-200k)
Profit/loss from business: +$6,538 (reported on 17.0% of returns)
Here:
+$6,538
State:
+$14,940
(% of AGI for various income ranges: 220.0% for AGIs below $25k, 260.0% for AGIs $25k-50k, 390.0% for AGIs $75k-100k)
Taxable individual retirement arrangement distribution: $14,871 (reported on 14.9% of returns)
14728:
$14,871
New York:
$19,609
(% of AGI for various income ranges: 103.3% for AGIs below $25k, 260.0% for AGIs $25k-50k, 2466.7% for AGIs $75k-100k)
Earned income credit: $2,700 (reported on 8.5% of returns)
Here:
$2,700
State:
$2,138
(% of AGI for various income ranges: 135.0% for AGIs $25k-50k)
Percentage of individuals using paid preparers for their 2020 taxes: 93.6%
Here:
94%
State:
95%
(% for various income ranges: 87.5% for AGIs below $25k, 100.0% for AGIs $25k-50k, 100.0% for AGIs $50k-75k, 80.0% for AGIs $75k-100k, 100.0% for AGIs $100k-200k)
Averages for the 2012 tax year for zip code 14728, filed in 2013:
Average Adjusted Gross Income (AGI) in 2012: $51,212 (Individual Income Tax Returns)
Here:
$51,212
State:
$77,088
Salary/wage: $42,727 (reported on 75.5% of returns)
Here:
$42,727
State:
$60,593
(% of AGI for various income ranges: 60.4% for AGIs below $25k, 74.2% for AGIs $25k-50k, 67.9% for AGIs $50k-75k, 67.2% for AGIs $75k-100k, 54.2% for AGIs $100k-200k)
Taxable interest for individuals: $590 (reported on 40.8% of returns)
This zip code:
$590
New York:
$3,125
(% of AGI for various income ranges: 2.1% for AGIs below $25k, 0.5% for AGIs $25k-50k, 0.1% for AGIs $50k-75k, 0.3% for AGIs $75k-100k, 0.3% for AGIs $100k-200k)
Ordinary dividends: $3,567 (reported on 24.5% of returns)
Here:
$3,567
State:
$10,299
(% of AGI for various income ranges: 2.6% for AGIs below $25k, 3.0% for AGIs $25k-50k, 5.6% for AGIs $75k-100k)
Net capital gain/loss in AGI: +$4,450 (reported on 16.3% of returns)
Here:
+$4,450
State:
+$42,474
(% of AGI for various income ranges: 4.8% for AGIs below $25k, 1.5% for AGIs $50k-75k, 1.8% for AGIs $100k-200k)
Profit/loss from business: +$6,573 (reported on 22.4% of returns)
Here:
+$6,573
State:
+$16,168
(% of AGI for various income ranges: 6.3% for AGIs below $25k, 3.1% for AGIs $25k-50k, 9.4% for AGIs $50k-75k)
Taxable individual retirement arrangement distribution: $13,183 (reported on 12.2% of returns)
14728:
$13,183
New York:
$17,621
Total itemized deductions: $22,464 (19% of AGI, reported on 22.4% of returns)
Here:
$22,464
State:
$34,985
Here:
19.3% of AGI
State:
21.3% of AGI
(% of AGI for various income ranges: 11.4% for AGIs $25k-50k, 8.5% for AGIs $50k-75k, 10.0% for AGIs $75k-100k, 12.1% for AGIs $100k-200k)
Charity contributions: $3,120 (reported on 20.4% of returns)
Here:
$3,120
State:
$5,572
(% of AGI for various income ranges: 3.6% for AGIs below $25k, 1.0% for AGIs $50k-75k, 1.2% for AGIs $75k-100k, 1.4% for AGIs $100k-200k)
Taxes paid: $9,436 (reported on 22.4% of returns)
14728:
$9,436
State:
$18,656
(% of AGI for various income ranges: 3.0% for AGIs $25k-50k, 3.3% for AGIs $50k-75k, 4.1% for AGIs $75k-100k, 6.1% for AGIs $100k-200k)
Earned income credit: $2,000 (reported on 14.3% of returns)
Here:
$2,000
State:
$2,230
(% of AGI for various income ranges: 3.9% for AGIs below $25k, 1.1% for AGIs $25k-50k)
Percentage of individuals using paid preparers for their 2012 taxes: 63.3%
Here:
63%
State:
66%
(% for various income ranges: 57.9% for AGIs below $25k, 66.7% for AGIs $25k-50k, 62.5% for AGIs $50k-75k, 60.0% for AGIs $75k-100k, 80.0% for AGIs $100k-200k)
Averages for the 2004 tax year for zip code 14728, filed in 2005:
Average Adjusted Gross Income (AGI) in 2004: $38,644 (Individual Income Tax Returns)
Here:
$38,644
State:
$59,519
Salary/wage: $32,977 (reported on 78.3% of returns)
Here:
$32,977
State:
$50,673
(% of AGI for various income ranges: 98.2% for AGIs below $10k, 55.8% for AGIs $10k-25k, 73.6% for AGIs $25k-50k, 73.9% for AGIs $50k-75k, 80.0% for AGIs $75k-100k, 48.1% for AGIs over 100k)
Taxable interest for individuals: $776 (reported on 57.9% of returns)
This zip code:
$776
New York:
$2,377
(% of AGI for various income ranges: 3.4% for AGIs below $10k, 2.4% for AGIs $10k-25k, 1.4% for AGIs $25k-50k, 1.0% for AGIs $50k-75k, 0.8% for AGIs $75k-100k, 0.7% for AGIs over 100k)
Taxable dividends: $2,289 (reported on 33.3% of returns)
Here:
$2,289
State:
$5,394
(% of AGI for various income ranges: 7.0% for AGIs below $10k, 1.9% for AGIs $10k-25k, 3.5% for AGIs $25k-50k, 1.2% for AGIs $50k-75k, 0.6% for AGIs $75k-100k, 1.6% for AGIs over 100k)
Net capital gain/loss: +$4,792 (reported on 21.5% of returns)
Here:
+$4,792
State:
+$23,581
(% of AGI for various income ranges: -2.7% for AGIs below $10k, 0.1% for AGIs $10k-25k, -0.1% for AGIs $25k-50k, 4.6% for AGIs $50k-75k, 6.3% for AGIs over 100k)
Profit/loss from business: +$5,105 (reported on 17.0% of returns)
Here:
+$5,105
State:
+$13,809
(% of AGI for various income ranges: 0.6% for AGIs below $10k, 10.8% for AGIs $10k-25k, 1.0% for AGIs $25k-50k, 0.9% for AGIs $50k-75k, 5.3% for AGIs $75k-100k)
Profit/loss from farming: +$2,333 (reported on 5.4% of returns)
Here:
+$2,333
State:
-$2,666
IRA payment deduction: $3,182 (reported on 2.5% of returns)
14728:
$3,182
New York:
$3,115
Total itemized deductions: $15,716 (20% of AGI, reported on 21.3% of returns)
Here:
$15,716
State:
$25,864
Here:
20.1% of AGI
State:
21.9% of AGI
(% of AGI for various income ranges: 7.5% for AGIs $25k-50k, 9.0% for AGIs $50k-75k, 11.2% for AGIs $75k-100k, 12.0% for AGIs over 100k)
Charity contributions deductions: $3,209 (4% of AGI, reported on 19.2% of returns)
Here:
$3,209
State:
$4,439
Here:
3.9% of AGI
State:
3.6% of AGI
(% of AGI for various income ranges: 0.9% for AGIs $25k-50k, 1.5% for AGIs $50k-75k, 2.7% for AGIs $75k-100k, 2.6% for AGIs over 100k)
Total tax: $5,176 (reported on 72.5% of returns)
14728:
$5,176
State:
$11,730
(% of AGI for various income ranges: 1.8% for AGIs below $10k, 4.1% for AGIs $10k-25k, 6.1% for AGIs $25k-50k, 8.5% for AGIs $50k-75k, 9.7% for AGIs $75k-100k, 17.2% for AGIs over 100k)
Earned income credit: $2,089 (reported on 12.5% of returns)
Here:
$2,089
State:
$1,757
Percentage of individuals using paid preparers for their 2004 taxes: 60.2%
Here:
60%
State:
67%
(% for various income ranges: 40.8% for AGIs below $10k, 65.7% for AGIs $10k-25k, 64.3% for AGIs $25k-50k, 62.3% for AGIs $50k-75k, 78.6% for AGIs $75k-100k, 70.4% for AGIs over 100k)
Household received Food Stamps/SNAP in the past 12 months: 26 Household did not receive Food Stamps/SNAP in the past 12 months: 413
Women who had a birth in the past 12 months: 17 (0 now married, 17 unmarried) Women who did not have a birth in the past 12 months: 240 (86 now married, 153 unmarried)
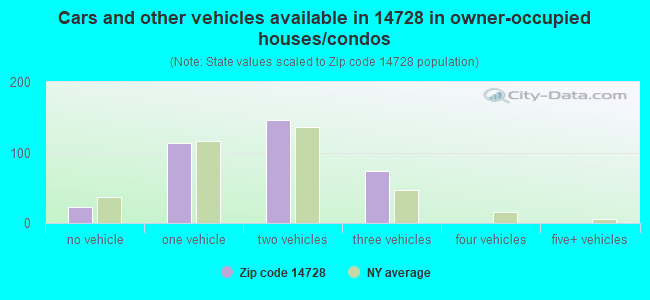
Housing units in zip code 14728 with a mortgage: 195 (32 second mortgage, 33 both second mortgage and home equity loan) Houses without a mortgage: 10
Median monthly owner costs for units with a mortgage: $1,258 Median monthly owner costs for units without a mortgage: $471
Residents with income below the poverty level in 2022:
This zip code:
13.9%
Whole state:
14.3%
Residents with income below 50% of the poverty level in 2022:
This zip code:
9.2%
Whole state:
6.8%
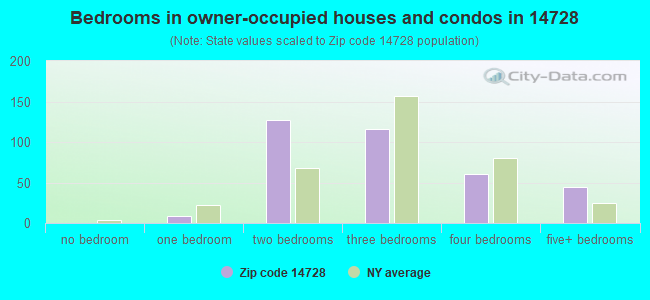
Median number of rooms in houses and condos:
Here:
6.7
State:
6.3
Median number of rooms in apartments:
Here:
6.1
State:
3.8
Notable locations in this zip code not listed on our city pages
Notable locations in zip code 14728: Triangle Camp (A), Jones Corners (B), Chautauqua Point Golf Club (C), Denton Corners (D), Chautauqua Heights Camping Resort (E). Display/hide their locations on the map
Churches in zip code 14728 include: Christian Missionary Alliance Church (A), Dewittville Hartfield United Methodist Church (B). Display/hide their locations on the map
Size of family households: 146 2-persons, 48 3-persons, 16 4-persons, 39 5-persons, 15 6-persons
Size of nonfamily households: 115 1-person, 36 2-persons, 26 3-persons
185 married couples with children.
50 single-parent households (27 men, 23 women).
98.1% of residents of 14728 zip code speak English at home.
1.6% of residents speak other Indo-European language at home (100% very well).
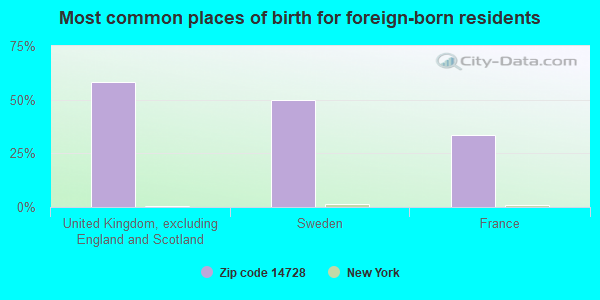
Foreign born population: 12 (1.2%) (39.7% of them are naturalized citizens)
This zip code:
1.2%
Whole state:
22.7%
58%United Kingdom, excluding England and Scotland
50%Sweden
33%France
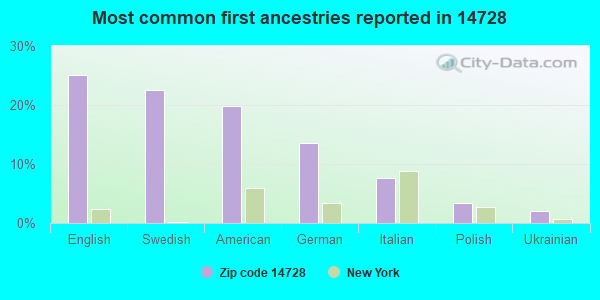
25%English
23%Swedish
20%American
14%German
8%Italian
3%Polish
2%Ukrainian
Year of entry for the foreign-born population
02010 or later
02000 to 2009
01990 to 1999
12Before 1990
Facilities with environmental interests located in this zip code:
CHAUTAUQUA HEIGHTS SD WWTP (ROUTE 430 in DEWITTVILLE, NY)
National Pollutant Discharge Elimination System NON-MAJOR (Tracking pollutant discharge elimination systems) - permit Business SIC classification: SEWERAGE SYSTEMS Organizations: CHAUTAUQUA (T) (CONTACT/OWNER)
Alternative names: CHAUTAUQUA (T)
Housing units lacking complete plumbing facilities: 4.3% Housing units lacking complete kitchen facilities: 6.1%
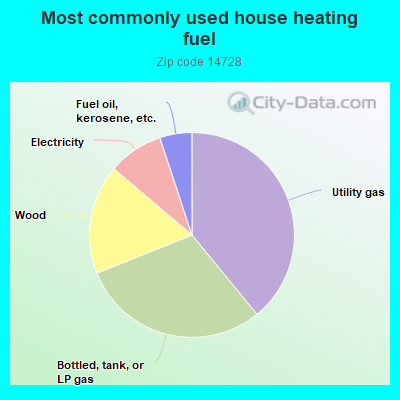
39.4%Utility gas
30.1%Bottled, tank, or LP gas
17.4%Wood
8.8%Electricity
5.1%Fuel oil, kerosene, etc.
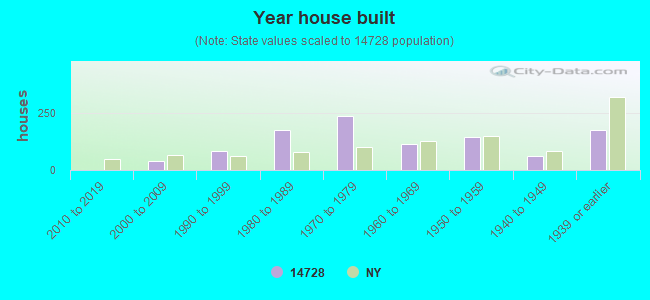
Population in 1990: 1,159.
Place of birth for U.S.-born residents:
This state: 722
Northeast: 171
Midwest: 40
South: 64
West: 18
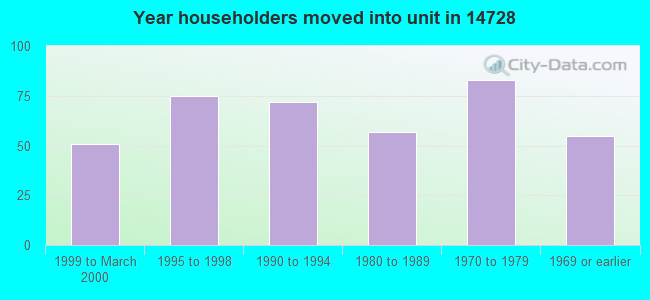
64% of the 14728 zip code residents lived in the same house 5 years ago. Out of people who lived in different houses, 60% lived in this county. Out of people who lived in different counties, 50% lived in New York.
97% of the 14728 zip code residents lived in the same house 1 year ago. Out of people who lived in different houses, 52% moved from different county within same state. Out of people who lived in different houses, 43% moved from different state.
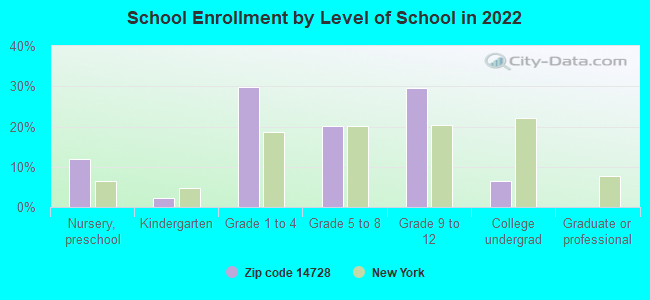
Private vs. public school enrollment:
Students in private schools in grades 1 to 8 (elementary and middle school): 19
Here:
16.2%
New York:
15.6%
Students in private schools in grades 9 to 12 (high school):
Here:
0.0%
New York:
15.0%
Students in private undergraduate colleges: 5
Here:
37.1%
New York:
39.2%
Occupation by median earnings in the past 12 months ($)
70,548Construction and extraction occupations
42,250Community and social service occupations
39,870Healthcare support occupations
28,030Sales and related occupations
21,841Management occupations
17,198Office and administrative support occupations
Top industries in this zip code by the number of employees in 2005:
Construction: New Single-Family Housing Construction (except Operative Builders) (20-49 employees: 1 establishment)
Other Services (except Public Administration): Religious Organizations (10-19: 1, 1-4: 1)
Arts, Entertainment, and Recreation: All Other Amusement and Recreation Industries (5-9: 1)
Construction: Site Preparation Contractors (5-9: 1)
Mining: Support Activities for Oil and Gas Operations (1-4: 2)
Construction: Masonry Contractors (1-4: 2)
Accommodation and Food Services: RV (Recreational Vehicle) Parks and Campgrounds (1-4: 1)
Accommodation and Food Services: Full-Service Restaurants (1-4: 1)
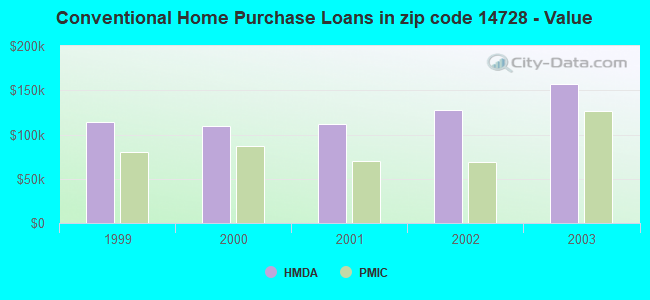
Home Mortgage Disclosure Act Aggregated Statistics For Year 2003 (Based on 2 partial tracts)
A) FHA, FSA/RHS & VA Home Purchase Loans
B) Conventional Home Purchase Loans
C) Refinancings
D) Home Improvement Loans
F) Non-occupant Loans on < 5 Family Dwellings (A B C & D)
Number
Average Value
Number
Average Value
Number
Average Value
Number
Average Value
Number
Average Value
LOANS ORIGINATED
4
$60,505
27
$157,314
57
$102,199
10
$13,429
30
$177,962
APPLICATIONS APPROVED, NOT ACCEPTED
0
$0
2
$94,000
10
$102,974
1
$19,230
3
$223,303
APPLICATIONS DENIED
0
$0
5
$69,952
35
$91,455
9
$25,637
5
$233,294
APPLICATIONS WITHDRAWN
0
$0
2
$73,400
20
$69,158
1
$17,400
3
$67,857
FILES CLOSED FOR INCOMPLETENESS
0
$0
1
$48,830
2
$73,705
0
$0
1
$89,420
Aggregated Statistics For Year 2002 (Based on 2 partial tracts)
A) FHA, FSA/RHS & VA Home Purchase Loans
B) Conventional Home Purchase Loans
C) Refinancings
D) Home Improvement Loans
F) Non-occupant Loans on < 5 Family Dwellings (A B C & D)
Number
Average Value
Number
Average Value
Number
Average Value
Number
Average Value
Number
Average Value
LOANS ORIGINATED
2
$86,980
22
$127,712
48
$119,289
9
$9,732
22
$191,388
APPLICATIONS APPROVED, NOT ACCEPTED
0
$0
3
$77,317
10
$86,616
1
$27,470
3
$150,260
APPLICATIONS DENIED
0
$0
3
$52,597
36
$72,604
5
$17,702
2
$94,610
APPLICATIONS WITHDRAWN
0
$0
2
$99,495
20
$80,618
1
$21,670
2
$190,595
FILES CLOSED FOR INCOMPLETENESS
0
$0
0
$0
3
$125,133
0
$0
1
$190,440
Aggregated Statistics For Year 2001 (Based on 2 partial tracts)
A) FHA, FSA/RHS & VA Home Purchase Loans
B) Conventional Home Purchase Loans
C) Refinancings
D) Home Improvement Loans
F) Non-occupant Loans on < 5 Family Dwellings (A B C & D)
Number
Average Value
Number
Average Value
Number
Average Value
Number
Average Value
Number
Average Value
LOANS ORIGINATED
2
$51,730
22
$111,315
31
$113,879
10
$12,757
19
$152,504
APPLICATIONS APPROVED, NOT ACCEPTED
0
$0
7
$103,811
6
$66,585
2
$32,350
2
$277,885
APPLICATIONS DENIED
0
$0
9
$58,564
27
$54,371
4
$25,102
5
$82,832
APPLICATIONS WITHDRAWN
0
$0
2
$70,960
17
$70,178
2
$32,200
1
$136,420
FILES CLOSED FOR INCOMPLETENESS
0
$0
0
$0
2
$106,820
1
$13,730
0
$0
Aggregated Statistics For Year 2000 (Based on 2 partial tracts)
A) FHA, FSA/RHS & VA Home Purchase Loans
B) Conventional Home Purchase Loans
C) Refinancings
D) Home Improvement Loans
F) Non-occupant Loans on < 5 Family Dwellings (A B C & D)
Number
Average Value
Number
Average Value
Number
Average Value
Number
Average Value
Number
Average Value
LOANS ORIGINATED
3
$65,210
25
$109,200
14
$63,154
9
$18,210
8
$186,706
APPLICATIONS APPROVED, NOT ACCEPTED
0
$0
5
$75,080
4
$78,742
2
$19,380
1
$236,840
APPLICATIONS DENIED
0
$0
8
$101,594
16
$53,544
10
$22,402
1
$66,530
APPLICATIONS WITHDRAWN
0
$0
1
$88,810
9
$42,287
2
$25,940
0
$0
FILES CLOSED FOR INCOMPLETENESS
0
$0
1
$41,510
1
$41,810
0
$0
0
$0
Aggregated Statistics For Year 1999 (Based on 1 partial tract)
B) Conventional Home Purchase Loans
C) Refinancings
D) Home Improvement Loans
F) Non-occupant Loans on < 5 Family Dwellings (A B C & D)


+$2,333
-$2,666
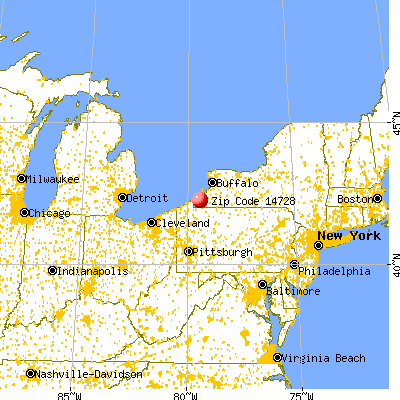
 Nearest zip codes: 14784, 14756, 14722, 14757, 14712, 14769.