Estimated zip code population in 2022: 738 Zip code population in 2010: 1,033 Zip code population in 2000: 1,012
Houses and condos: 436 Renter-occupied apartments: 53
% of renters here:
17%
State:
46%
March 2022 cost of living index in zip code 14784: 93.0 (less than average, U.S. average is 100)
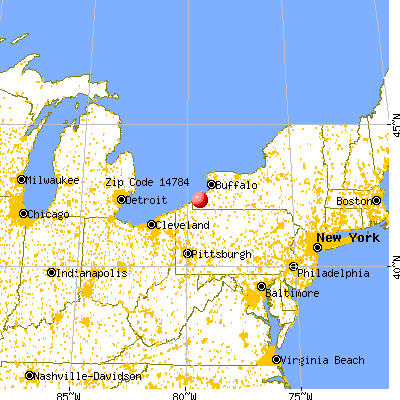
Land area: 28.9 sq. mi. Water area: 0.3 sq. mi.
Population density: 25 people per square mile
(very low).
OSM Map
General Map
Google Map
MSN Map
OSM Map
General Map
Google Map
MSN Map
OSM Map
General Map
Google Map
MSN Map
OSM Map
General Map
Google Map
MSN Map
Please wait while loading the map...
Real estate property taxes paid for housing units in 2022:
This zip code:
1.9% ($2,404)
New York:
1.5% ($6,180)
Median real estate property taxes paid for housing units with mortgages in 2022: $2,261 (2.0%) Median real estate property taxes paid for housing units with no mortgage in 2022: $2,497 (1.6%)
Business Search- 14 Million verified businesses
Males: 412
(55.9%)
Females: 325
(44.1%)
For population 25 years and over in 14784:
High school or higher: 82.9%
Bachelor's degree or higher: 22.4%
Graduate or professional degree: 11.3%
Unemployed: 5.5%
Mean travel time to work (commute): 17.3 minutes
For population 15 years and over in 14784:
Never married: 19.3%
Now married: 70.8%
Separated: 0.9%
Widowed: 3.8%
Divorced: 5.2%
Zip code 14784 compared to state average:
Median house value significantly below state average.
Black race population percentage significantly below state average.
Hispanic race population percentage significantly below state average.
Median age significantly above state average.
Foreign-born population percentage significantly below state average.
Renting percentage significantly below state average.
Length of stay since moving in significantly above state average.
Number of rooms per house above state average.
House age below state average.
Number of college students below state average.
Percentage of population with a bachelor's degree or higher below state average.
Estimated median house/condo value in 2022: $125,614
14784:
$125,614
New York:
$400,400
Median resident age:
This zip code:
54.1 years
New York median age:
40.0 years
Average household size:
This zip code:
2.4 people
New York:
2.5 people
Averages for the 2020 tax year for zip code 14784, filed in 2021:
Average Adjusted Gross Income (AGI) in 2020: $50,862 (Individual Income Tax Returns)
Here:
$50,862
State:
$90,930
Salary/wage: $42,100 (reported on 76.2% of returns)
Here:
$42,100
State:
$72,104
(% of AGI for various income ranges: 1201.1% for AGIs below $25k, 2984.5% for AGIs $25k-50k, 5482.0% for AGIs $50k-75k, 8970.0% for AGIs $75k-100k, 18380.0% for AGIs $100k-200k)
Taxable interest for individuals: $233 (reported on 28.6% of returns)
This zip code:
$233
New York:
$3,075
(% of AGI for various income ranges: 4.4% for AGIs below $25k, 9.1% for AGIs $25k-50k, 10.0% for AGIs $50k-75k, 45.0% for AGIs $100k-200k)
Ordinary dividends: $1,440 (reported on 11.9% of returns)
Here:
$1,440
State:
$11,095
(% of AGI for various income ranges: 14.4% for AGIs below $25k, 196.7% for AGIs $75k-100k)
Net capital gain/loss in AGI: +$3,933 (reported on 7.1% of returns)
Here:
+$3,933
State:
+$44,925
(% of AGI for various income ranges: 107.3% for AGIs $25k-50k)
Profit/loss from business: +$7,475 (reported on 9.5% of returns)
Here:
+$7,475
State:
+$14,940
(% of AGI for various income ranges: 271.8% for AGIs $25k-50k)
Taxable individual retirement arrangement distribution: $11,725 (reported on 9.5% of returns)
14784:
$11,725
New York:
$19,609
(% of AGI for various income ranges: 426.4% for AGIs $25k-50k)
Earned income credit: $2,300 (reported on 16.7% of returns)
Here:
$2,300
State:
$2,138
(% of AGI for various income ranges: 94.4% for AGIs below $25k, 69.1% for AGIs $25k-50k)
Percentage of individuals using paid preparers for their 2020 taxes: 92.9%
Here:
93%
State:
95%
(% for various income ranges: 92.9% for AGIs below $25k, 92.3% for AGIs $25k-50k, 100.0% for AGIs $50k-75k, 100.0% for AGIs $75k-100k, 80.0% for AGIs $100k-200k)
Averages for the 2012 tax year for zip code 14784, filed in 2013:
Average Adjusted Gross Income (AGI) in 2012: $36,130 (Individual Income Tax Returns)
Here:
$36,130
State:
$77,088
Salary/wage: $32,187 (reported on 88.6% of returns)
Here:
$32,187
State:
$60,593
(% of AGI for various income ranges: 77.4% for AGIs below $25k, 82.3% for AGIs $25k-50k, 75.5% for AGIs $50k-75k, 79.6% for AGIs $75k-100k)
Taxable interest for individuals: $183 (reported on 27.3% of returns)
This zip code:
$183
New York:
$3,125
(% of AGI for various income ranges: 0.3% for AGIs below $25k, 0.1% for AGIs $25k-50k, 0.1% for AGIs $75k-100k)
Ordinary dividends: $500 (reported on 13.6% of returns)
Here:
$500
State:
$10,299
Profit/loss from business: +$2,660 (reported on 11.4% of returns)
Here:
+$2,660
State:
+$16,168
Taxable individual retirement arrangement distribution: $8,300 (reported on 4.5% of returns)
14784:
$8,300
New York:
$17,621
Total itemized deductions: $16,983 (22% of AGI, reported on 13.6% of returns)
Here:
$16,983
State:
$34,985
Here:
22.5% of AGI
State:
21.3% of AGI
Charity contributions: $1,633 (reported on 6.8% of returns)
Here:
$1,633
State:
$5,572
Taxes paid: $7,983 (reported on 13.6% of returns)
14784:
$7,983
State:
$18,656
Earned income credit: $2,020 (reported on 22.7% of returns)
Here:
$2,020
State:
$2,230
(% of AGI for various income ranges: 6.5% for AGIs below $25k, 1.2% for AGIs $25k-50k)
Percentage of individuals using paid preparers for their 2012 taxes: 52.3%
Here:
52%
State:
66%
(% for various income ranges: 45.0% for AGIs below $25k, 50.0% for AGIs $25k-50k, 71.4% for AGIs $50k-75k, 60.0% for AGIs $75k-100k)
Averages for the 2004 tax year for zip code 14784, filed in 2005:
Average Adjusted Gross Income (AGI) in 2004: $29,506 (Individual Income Tax Returns)
Here:
$29,506
State:
$59,519
Salary/wage: $28,079 (reported on 88.1% of returns)
Here:
$28,079
State:
$50,673
(% of AGI for various income ranges: 78.4% for AGIs below $10k, 77.9% for AGIs $10k-25k, 83.6% for AGIs $25k-50k, 89.3% for AGIs $50k-75k, 84.8% for AGIs $75k-100k)
Taxable interest for individuals: $357 (reported on 38.2% of returns)
This zip code:
$357
New York:
$2,377
(% of AGI for various income ranges: 0.6% for AGIs below $10k, 0.6% for AGIs $10k-25k, 0.7% for AGIs $25k-50k, 0.2% for AGIs $50k-75k, 0.2% for AGIs $75k-100k)
Taxable dividends: $333 (reported on 11.2% of returns)
Here:
$333
State:
$5,394
Net capital gain/loss: +$400 (reported on 6.2% of returns)
Here:
+$400
State:
+$23,581
Profit/loss from business: +$2,262 (reported on 10.4% of returns)
Here:
+$2,262
State:
+$13,809
Total itemized deductions: $13,750 (23% of AGI, reported on 14.9% of returns)
Here:
$13,750
State:
$25,864
Here:
23.3% of AGI
State:
21.9% of AGI
Charity contributions deductions: $1,612 (3% of AGI, reported on 12.2% of returns)
Here:
$1,612
State:
$4,439
Here:
2.8% of AGI
State:
3.6% of AGI
Total tax: $2,993 (reported on 66.7% of returns)
14784:
$2,993
State:
$11,730
(% of AGI for various income ranges: 1.9% for AGIs below $10k, 3.6% for AGIs $10k-25k, 5.7% for AGIs $25k-50k, 7.6% for AGIs $50k-75k, 11.2% for AGIs $75k-100k)
Earned income credit: $1,742 (reported on 23.1% of returns)
Here:
$1,742
State:
$1,757
Percentage of individuals using paid preparers for their 2004 taxes: 48.9%
Here:
49%
State:
67%
(% for various income ranges: 31.2% for AGIs below $10k, 52.0% for AGIs $10k-25k, 56.5% for AGIs $25k-50k, 51.2% for AGIs $50k-75k, 59.3% for AGIs $75k-100k)
Likely homosexual households (counted as self-reported same-sex unmarried-partner households)
Lesbian couples: 3.8% of all households
Gay men: 0.0% of all households
Household received Food Stamps/SNAP in the past 12 months: 54 Household did not receive Food Stamps/SNAP in the past 12 months: 254
Women who had a birth in the past 12 months: 6 (6 now married, 0 unmarried) Women who did not have a birth in the past 12 months: 104 (62 now married, 41 unmarried)
Housing units in zip code 14784 with a mortgage: 110 (32 second mortgage, 26 both second mortgage and home equity loan) Median monthly owner costs for units with a mortgage: $1,343 Median monthly owner costs for units without a mortgage: $541
Residents with income below the poverty level in 2022:
This zip code:
10.6%
Whole state:
14.3%
Residents with income below 50% of the poverty level in 2022:
This zip code:
9.1%
Whole state:
6.8%
Median number of rooms in houses and condos:
Here:
7.4
State:
6.3
Median number of rooms in apartments:
Here:
5.0
State:
3.8
Notable locations in this zip code not listed on our city pages
Size of family households: 160 2-persons, 44 3-persons, 34 4-persons, 9 5-persons
Size of nonfamily households: 40 1-person, 11 2-persons, 7 4-persons
71 married couples with children.
5 single-parent households (5 men).
98.6% of residents of 14784 zip code speak English at home.
0.6% of residents speak other Indo-European language at home (100% very well).
0.7% of residents speak Asian or Pacific Island language at home (100% well).
Foreign born population: 0 (0.0%)
:
0.0%
Whole state:
22.7%
35%German
23%American
9%English
8%Swedish
7%Pennsylvania German
7%Italian
5%Irish
Facilities with environmental interests located in this zip code:
DEC 9017 (RT 380 in STOCKTON, NY)
(Resource Conservation and Recovery Act (tracking hazardous waste))
Housing units lacking complete kitchen facilities: 1.7%
36.8%Bottled, tank, or LP gas
27.1%Utility gas
24.4%Wood
6.3%Other fuel
3.3%Fuel oil, kerosene, etc.
3.0%Electricity
Population in 1990: 1,894.
Place of birth for U.S.-born residents:
This state: 674
Northeast: 18
Midwest: 11
South: 21
West: 9
60% of the 14784 zip code residents lived in the same house 5 years ago. Out of people who lived in different houses, 86% lived in this county. Out of people who lived in different counties, 50% lived in New York.
92% of the 14784 zip code residents lived in the same house 1 year ago. Out of people who lived in different houses, 89% moved from different county within same state. Out of people who lived in different houses, 13% moved from different state.
Private vs. public school enrollment:
Students in private schools in grades 1 to 8 (elementary and middle school): 4
Here:
12.8%
New York:
15.6%
Students in private schools in grades 9 to 12 (high school):
Here:
0.0%
New York:
15.0%
Students in private undergraduate colleges:
Here:
0.0%
New York:
39.2%
Occupation by median earnings in the past 12 months ($)
44,802Production occupations
39,034Sales and related occupations
32,169Office and administrative support occupations
31,902Education, training, and library occupations
28,676Building and grounds cleaning and maintenance occupations
26,378Business and financial operations occupations
Top industries in this zip code by the number of employees in 2005:
Construction: Plumbing, Heating, and Air-Conditioning Contractors (10-19 employees: 1 establishment)
Construction: Site Preparation Contractors (5-9: 1, 1-4: 2)
Administrative and Support and Waste Management and Remediation Services: Solid Waste Collection (5-9: 1)
Health Care and Social Assistance: Offices of Chiropractors (1-4: 1)
Arts, Entertainment, and Recreation: Promoters of Performing Arts, Sports, and Similar Events without Facilities (1-4: 1)
Administrative and Support and Waste Management and Remediation Services: Janitorial Services (1-4: 1)
Other Services (except Public Administration): Commercial and Industrial Machinery and Equipment (except Automotive and Electronic) Repair and Maintenance (1-4: 1)
Information: Libraries and Archives (1-4: 1)
Home Mortgage Disclosure Act Aggregated Statistics For Year 2003 (Based on 2 partial tracts)
A) FHA, FSA/RHS & VA Home Purchase Loans
B) Conventional Home Purchase Loans
C) Refinancings
D) Home Improvement Loans
F) Non-occupant Loans on < 5 Family Dwellings (A B C & D)
Number
Average Value
Number
Average Value
Number
Average Value
Number
Average Value
Number
Average Value
LOANS ORIGINATED
5
$69,880
40
$153,296
82
$102,558
15
$12,924
43
$179,242
APPLICATIONS APPROVED, NOT ACCEPTED
0
$0
2
$135,705
14
$106,184
1
$27,760
5
$193,424
APPLICATIONS DENIED
0
$0
7
$72,133
50
$92,420
12
$27,757
7
$240,567
APPLICATIONS WITHDRAWN
0
$0
3
$70,643
29
$68,855
1
$25,110
4
$73,470
FILES CLOSED FOR INCOMPLETENESS
0
$0
1
$70,500
3
$70,937
0
$0
1
$129,100
Aggregated Statistics For Year 2002 (Based on 2 partial tracts)
A) FHA, FSA/RHS & VA Home Purchase Loans
B) Conventional Home Purchase Loans
C) Refinancings
D) Home Improvement Loans
F) Non-occupant Loans on < 5 Family Dwellings (A B C & D)
Number
Average Value
Number
Average Value
Number
Average Value
Number
Average Value
Number
Average Value
LOANS ORIGINATED
3
$83,713
31
$130,844
69
$119,799
13
$9,727
32
$189,954
APPLICATIONS APPROVED, NOT ACCEPTED
0
$0
4
$83,715
15
$83,361
1
$39,650
4
$162,692
APPLICATIONS DENIED
0
$0
4
$56,948
52
$72,563
7
$18,253
2
$136,585
APPLICATIONS WITHDRAWN
0
$0
3
$95,757
28
$83,132
1
$31,280
3
$183,437
FILES CLOSED FOR INCOMPLETENESS
0
$0
0
$0
4
$135,485
0
$0
1
$274,930
Aggregated Statistics For Year 2001 (Based on 2 partial tracts)
A) FHA, FSA/RHS & VA Home Purchase Loans
B) Conventional Home Purchase Loans
C) Refinancings
D) Home Improvement Loans
F) Non-occupant Loans on < 5 Family Dwellings (A B C & D)
Number
Average Value
Number
Average Value
Number
Average Value
Number
Average Value
Number
Average Value
LOANS ORIGINATED
3
$49,787
32
$110,480
45
$113,254
15
$12,278
27
$154,928
APPLICATIONS APPROVED, NOT ACCEPTED
0
$0
10
$104,907
9
$64,083
2
$46,705
4
$200,582
APPLICATIONS DENIED
0
$0
12
$63,410
39
$54,341
6
$24,160
7
$85,413
APPLICATIONS WITHDRAWN
0
$0
3
$68,293
25
$68,892
3
$30,990
2
$98,475
FILES CLOSED FOR INCOMPLETENESS
0
$0
0
$0
3
$102,807
1
$19,830
0
$0
Aggregated Statistics For Year 2000 (Based on 2 partial tracts)
A) FHA, FSA/RHS & VA Home Purchase Loans
B) Conventional Home Purchase Loans
C) Refinancings
D) Home Improvement Loans
F) Non-occupant Loans on < 5 Family Dwellings (A B C & D)
Number
Average Value
Number
Average Value
Number
Average Value
Number
Average Value
Number
Average Value
LOANS ORIGINATED
4
$70,605
37
$106,518
20
$63,821
14
$16,900
12
$179,692
APPLICATIONS APPROVED, NOT ACCEPTED
0
$0
7
$77,420
5
$90,940
2
$27,980
2
$170,955
APPLICATIONS DENIED
0
$0
12
$97,777
23
$53,772
14
$23,100
2
$48,025
APPLICATIONS WITHDRAWN
0
$0
1
$128,210
13
$42,264
3
$24,967
0
$0
FILES CLOSED FOR INCOMPLETENESS
0
$0
1
$59,920
1
$60,360
0
$0
0
$0
Aggregated Statistics For Year 1999 (Based on 1 partial tract)
A) FHA, FSA/RHS & VA Home Purchase Loans
B) Conventional Home Purchase Loans
C) Refinancings
D) Home Improvement Loans
F) Non-occupant Loans on < 5 Family Dwellings (A B C & D)


 Nearest zip codes: 14728, 14752, 14716, 14718, 14769, 14063.


