Estimated zip code population in 2022: 585 Zip code population in 2010: 520 Zip code population in 2000: 624
Houses and condos: 283 Renter-occupied apartments: 19
% of renters here:
8%
State:
46%
March 2022 cost of living index in zip code 14816: 92.6 (less than average, U.S. average is 100)
Land area: 3.9 sq. mi. Water area: 0.0 sq. mi.
Population density: 152 people per square mile
(very low).
OSM Map
General Map
Google Map
MSN Map
OSM Map
General Map
Google Map
MSN Map
OSM Map
General Map
Google Map
MSN Map
OSM Map
General Map
Google Map
MSN Map
Please wait while loading the map...
Real estate property taxes paid for housing units in 2022:
This zip code:
2.2% ($2,384)
New York:
1.5% ($6,180)
Median real estate property taxes paid for housing units with mortgages in 2022: $2,236 (1.2%) Median real estate property taxes paid for housing units with no mortgage in 2022: $2,411 (2.6%)
Business Search- 14 Million verified businesses
Males: 307
(52.5%)
Females: 278
(47.5%)
For population 25 years and over in 14816:
High school or higher: 97.3%
Bachelor's degree or higher: 22.2%
Graduate or professional degree: 14.1%
Mean travel time to work (commute): 26.7 minutes
For population 15 years and over in 14816:
Never married: 16.5%
Now married: 71.9%
Separated: 2.7%
Widowed: 3.2%
Divorced: 5.7%
Zip code 14816 compared to state average:
Median household income below state average.
Median house value significantly below state average.
Unemployed percentage significantly below state average.
Black race population percentage significantly below state average.
Hispanic race population percentage significantly below state average.
Median age significantly above state average.
Foreign-born population percentage significantly below state average.
Renting percentage significantly below state average.
Length of stay since moving in above state average.
Number of rooms per house above state average.
Number of college students below state average.
Percentage of population with a bachelor's degree or higher below state average.
Averages for the 2020 tax year for zip code 14816, filed in 2021:
Average Adjusted Gross Income (AGI) in 2020: $56,356 (Individual Income Tax Returns)
Here:
$56,356
State:
$90,930
Salary/wage: $53,633 (reported on 75.0% of returns)
Here:
$53,633
State:
$72,104
(% of AGI for various income ranges: 916.2% for AGIs below $25k, 2801.7% for AGIs $25k-50k, 4854.0% for AGIs $50k-75k, 8310.0% for AGIs $75k-100k, 21230.0% for AGIs $100k-200k)
Taxable interest for individuals: $187 (reported on 46.9% of returns)
This zip code:
$187
New York:
$3,075
(% of AGI for various income ranges: 10.0% for AGIs below $25k, 3.3% for AGIs $25k-50k, 20.0% for AGIs $50k-75k, 25.0% for AGIs $75k-100k, 10.0% for AGIs $100k-200k)
Ordinary dividends: $650 (reported on 18.8% of returns)
Here:
$650
State:
$11,095
(% of AGI for various income ranges: 20.0% for AGIs $25k-50k, 135.0% for AGIs $75k-100k)
Net capital gain/loss in AGI: +$1,333 (reported on 9.4% of returns)
Here:
+$1,333
State:
+$44,925
(% of AGI for various income ranges: 66.7% for AGIs $25k-50k)
Profit/loss from business: +$4,050 (reported on 12.5% of returns)
Here:
+$4,050
State:
+$14,940
(% of AGI for various income ranges: 128.8% for AGIs below $25k, 118.0% for AGIs $50k-75k)
Taxable individual retirement arrangement distribution: $17,900 (reported on 9.4% of returns)
14816:
$17,900
New York:
$19,609
(% of AGI for various income ranges: 1074.0% for AGIs $50k-75k)
Earned income credit: $2,133 (reported on 9.4% of returns)
Here:
$2,133
State:
$2,138
(% of AGI for various income ranges: 80.0% for AGIs below $25k)
Percentage of individuals using paid preparers for their 2020 taxes: 96.9%
Here:
97%
State:
95%
(% for various income ranges: 100.0% for AGIs below $25k, 85.7% for AGIs $25k-50k, 100.0% for AGIs $50k-75k, 100.0% for AGIs $75k-100k, 100.0% for AGIs $100k-200k)
Averages for the 2012 tax year for zip code 14816, filed in 2013:
Average Adjusted Gross Income (AGI) in 2012: $44,676 (Individual Income Tax Returns)
Here:
$44,676
State:
$77,088
Salary/wage: $43,004 (reported on 81.8% of returns)
Here:
$43,004
State:
$60,593
(% of AGI for various income ranges: 71.8% for AGIs below $25k, 74.9% for AGIs $25k-50k, 77.5% for AGIs $50k-75k, 96.3% for AGIs $75k-100k, 77.2% for AGIs $100k-200k)
Taxable interest for individuals: $220 (reported on 45.5% of returns)
This zip code:
$220
New York:
$3,125
(% of AGI for various income ranges: 0.5% for AGIs below $25k, 0.3% for AGIs $25k-50k, 0.2% for AGIs $50k-75k, 0.2% for AGIs $100k-200k)
Ordinary dividends: $529 (reported on 21.2% of returns)
Here:
$529
State:
$10,299
Profit/loss from business: +$8,600 (reported on 15.2% of returns)
Here:
+$8,600
State:
+$16,168
Taxable individual retirement arrangement distribution: $6,400 (reported on 9.1% of returns)
14816:
$6,400
New York:
$17,621
Total itemized deductions: $19,471 (23% of AGI, reported on 21.2% of returns)
Here:
$19,471
State:
$34,985
Here:
22.8% of AGI
State:
21.3% of AGI
(% of AGI for various income ranges: 19.3% for AGIs below $25k, 15.1% for AGIs $50k-75k, 11.9% for AGIs $100k-200k)
Charity contributions: $4,480 (reported on 15.2% of returns)
Here:
$4,480
State:
$5,572
(% of AGI for various income ranges: 4.5% for AGIs $50k-75k, 1.6% for AGIs $100k-200k)
Taxes paid: $8,700 (reported on 21.2% of returns)
14816:
$8,700
State:
$18,656
Earned income credit: $1,660 (reported on 15.2% of returns)
Here:
$1,660
State:
$2,230
(% of AGI for various income ranges: 5.2% for AGIs below $25k)
Percentage of individuals using paid preparers for their 2012 taxes: 45.5%
Here:
45%
State:
66%
(% for various income ranges: 38.5% for AGIs below $25k, 44.4% for AGIs $25k-50k, 80.0% for AGIs $50k-75k, 50.0% for AGIs $100k-200k)
Averages for the 2004 tax year for zip code 14816, filed in 2005:
Average Adjusted Gross Income (AGI) in 2004: $37,315 (Individual Income Tax Returns)
Here:
$37,315
State:
$59,519
Salary/wage: $36,088 (reported on 86.9% of returns)
Here:
$36,088
State:
$50,673
(% of AGI for various income ranges: 87.8% for AGIs below $10k, 71.0% for AGIs $10k-25k, 83.9% for AGIs $25k-50k, 89.9% for AGIs $50k-75k, 91.9% for AGIs $75k-100k, 78.2% for AGIs over 100k)
Taxable interest for individuals: $309 (reported on 54.3% of returns)
This zip code:
$309
New York:
$2,377
(% of AGI for various income ranges: 1.7% for AGIs below $10k, 0.9% for AGIs $10k-25k, 0.4% for AGIs $25k-50k, 0.3% for AGIs $50k-75k, 0.1% for AGIs $75k-100k, 0.5% for AGIs over 100k)
Taxable dividends: $667 (reported on 20.5% of returns)
Here:
$667
State:
$5,394
(% of AGI for various income ranges: 0.8% for AGIs below $10k, 0.7% for AGIs $10k-25k, 0.1% for AGIs $25k-50k, 0.1% for AGIs $50k-75k, 0.1% for AGIs $75k-100k, 0.9% for AGIs over 100k)
Net capital gain/loss: +$286 (reported on 13.9% of returns)
Here:
+$286
State:
+$23,581
(% of AGI for various income ranges: 1.8% for AGIs $10k-25k, -0.2% for AGIs $50k-75k, -0.3% for AGIs over 100k)
Profit/loss from business: +$6,095 (reported on 11.9% of returns)
Here:
+$6,095
State:
+$13,809
Total itemized deductions: $14,678 (21% of AGI, reported on 25.6% of returns)
Here:
$14,678
State:
$25,864
Here:
21.0% of AGI
State:
21.9% of AGI
(% of AGI for various income ranges: 9.1% for AGIs $25k-50k, 11.9% for AGIs $50k-75k, 12.4% for AGIs $75k-100k, 14.4% for AGIs over 100k)
Charity contributions deductions: $2,697 (4% of AGI, reported on 21.6% of returns)
Here:
$2,697
State:
$4,439
Here:
3.6% of AGI
State:
3.6% of AGI
(% of AGI for various income ranges: 1.5% for AGIs $25k-50k, 2.1% for AGIs $50k-75k, 1.2% for AGIs $75k-100k, 2.4% for AGIs over 100k)
Total tax: $4,453 (reported on 73.3% of returns)
14816:
$4,453
State:
$11,730
(% of AGI for various income ranges: 1.4% for AGIs below $10k, 4.4% for AGIs $10k-25k, 6.7% for AGIs $25k-50k, 8.4% for AGIs $50k-75k, 9.6% for AGIs $75k-100k, 14.6% for AGIs over 100k)
Earned income credit: $1,780 (reported on 14.2% of returns)
Here:
$1,780
State:
$1,757
Percentage of individuals using paid preparers for their 2004 taxes: 59.1%
Here:
59%
State:
67%
(% for various income ranges: 59.7% for AGIs below $10k, 55.7% for AGIs $10k-25k, 58.7% for AGIs $25k-50k, 66.0% for AGIs $50k-75k, 60.0% for AGIs $75k-100k, 55.0% for AGIs over 100k)
Household received Food Stamps/SNAP in the past 12 months: 44 Household did not receive Food Stamps/SNAP in the past 12 months: 211
Women who did not have a birth in the past 12 months: 80 (38 now married, 41 unmarried)
Housing units in zip code 14816 with a mortgage: 91 Median monthly owner costs for units with a mortgage: $1,153 Median monthly owner costs for units without a mortgage: $523
Residents with income below the poverty level in 2022:
This zip code:
4.5%
Whole state:
14.3%
Residents with income below 50% of the poverty level in 2022:
This zip code:
3.6%
Whole state:
6.8%
Median number of rooms in houses and condos:
Here:
6.9
State:
6.3
Notable locations in this zip code not listed on our city pages
Size of family households: 117 2-persons, 30 3-persons, 15 4-persons, 25 5-persons
Size of nonfamily households: 59 1-person, 6 2-persons
82 married couples with children.
23 single-parent households (23 women).
100.4% of residents of 14816 zip code speak English at home.
Foreign born population: 26 (4.6%) (0.0% of them are naturalized citizens)
:
4.6%
Whole state:
22.7%
96%St. Vincent and the Grenadines
28%English
21%Italian
17%American
14%French
8%Irish
2%German
Year of entry for the foreign-born population
02010 or later
02000 to 2009
01990 to 1999
26Before 1990
Facilities with environmental interests located in this zip code:
ANDERSON REAL ESTATE (131 ORMISTON RD in BREESPORT, NY)
ENFORCEMENT/COMPLIANCE ACTIVITY (Integrated Compliance Information System) COMPLIANCE ACTIVITY (Tracking inspections of insecticide, fungicide, and rodenticide, and toxic substances) Business SIC classification: OPERATORS OF APARTMENT BUILDINGS
Housing units lacking complete plumbing facilities: 9.8%
63.8%Utility gas
15.4%Fuel oil, kerosene, etc.
9.3%Electricity
7.3%Wood
5.3%Bottled, tank, or LP gas
Population in 1990: 160. Population change in the 1990s: +464 (+290.0%).
Place of birth for U.S.-born residents:
This state: 470
Northeast: 59
South: 9
West: 17
61% of the 14816 zip code residents lived in the same house 5 years ago. Out of people who lived in different houses, 78% lived in this county. Out of people who lived in different counties, 50% lived in New York.
99% of the 14816 zip code residents lived in the same house 1 year ago. Out of people who lived in different houses, 40% moved from this county. Out of people who lived in different houses, 40% moved from different county within same state.
Private vs. public school enrollment:
Students in private schools in grades 1 to 8 (elementary and middle school):
Here:
0.0%
New York:
15.6%
Students in private schools in grades 9 to 12 (high school):
Here:
0.0%
New York:
15.0%
Students in private undergraduate colleges:
Here:
0.0%
New York:
39.2%
Occupation by median earnings in the past 12 months ($)
57,820Construction and extraction occupations
39,386Office and administrative support occupations
Top industries in this zip code by the number of employees in 2005:
Educational Services: Elementary and Secondary Schools (10-19 employees: 1 establishment)
Health Care and Social Assistance: Offices of Physicians (except Mental Health Specialists) (1-4: 1)
Construction: All Other Specialty Trade Contractors (1-4: 1)
Administrative and Support and Waste Management and Remediation Services: Landscaping Services (1-4: 1)
Other Services (except Public Administration): Religious Organizations (1-4: 1)
Home Mortgage Disclosure Act Aggregated Statistics For Year 2009 (Based on 2 partial tracts)
A) FHA, FSA/RHS & VA Home Purchase Loans
B) Conventional Home Purchase Loans
C) Refinancings
D) Home Improvement Loans
F) Non-occupant Loans on < 5 Family Dwellings (A B C & D)
Number
Average Value
Number
Average Value
Number
Average Value
Number
Average Value
Number
Average Value
LOANS ORIGINATED
6
$138,760
15
$164,324
39
$133,594
9
$24,959
2
$173,325
APPLICATIONS APPROVED, NOT ACCEPTED
1
$86,460
1
$116,550
2
$100,000
1
$7,110
0
$0
APPLICATIONS DENIED
1
$162,790
1
$141,180
9
$164,069
2
$38,990
0
$0
APPLICATIONS WITHDRAWN
0
$0
2
$198,770
7
$134,337
1
$89,740
0
$0
FILES CLOSED FOR INCOMPLETENESS
0
$0
0
$0
1
$116,280
1
$10,940
0
$0
Aggregated Statistics For Year 2008 (Based on 2 partial tracts)
A) FHA, FSA/RHS & VA Home Purchase Loans
B) Conventional Home Purchase Loans
C) Refinancings
D) Home Improvement Loans
F) Non-occupant Loans on < 5 Family Dwellings (A B C & D)
G) Loans On Manufactured Home Dwelling (A B C & D)
Number
Average Value
Number
Average Value
Number
Average Value
Number
Average Value
Number
Average Value
Number
Average Value
LOANS ORIGINATED
5
$165,692
18
$155,891
25
$122,168
13
$27,634
1
$198,910
1
$26,270
APPLICATIONS APPROVED, NOT ACCEPTED
0
$0
2
$136,390
2
$164,845
0
$0
0
$0
0
$0
APPLICATIONS DENIED
0
$0
1
$94,120
5
$104,516
5
$45,636
0
$0
0
$0
APPLICATIONS WITHDRAWN
1
$82,080
1
$248,980
6
$127,817
1
$53,630
0
$0
0
$0
FILES CLOSED FOR INCOMPLETENESS
0
$0
0
$0
0
$0
0
$0
0
$0
0
$0
Aggregated Statistics For Year 2007 (Based on 2 partial tracts)
A) FHA, FSA/RHS & VA Home Purchase Loans
B) Conventional Home Purchase Loans
C) Refinancings
D) Home Improvement Loans
F) Non-occupant Loans on < 5 Family Dwellings (A B C & D)
G) Loans On Manufactured Home Dwelling (A B C & D)
Number
Average Value
Number
Average Value
Number
Average Value
Number
Average Value
Number
Average Value
Number
Average Value
LOANS ORIGINATED
2
$98,770
23
$159,009
24
$106,316
15
$33,781
1
$220,250
1
$16,690
APPLICATIONS APPROVED, NOT ACCEPTED
0
$0
2
$87,550
3
$78,160
2
$32,420
0
$0
0
$0
APPLICATIONS DENIED
0
$0
3
$106,613
12
$96,968
10
$29,303
0
$0
0
$0
APPLICATIONS WITHDRAWN
0
$0
1
$168,260
6
$129,140
2
$54,585
0
$0
0
$0
FILES CLOSED FOR INCOMPLETENESS
0
$0
0
$0
2
$157,185
0
$0
0
$0
0
$0
Aggregated Statistics For Year 2006 (Based on 2 partial tracts)
A) FHA, FSA/RHS & VA Home Purchase Loans
B) Conventional Home Purchase Loans
C) Refinancings
D) Home Improvement Loans
F) Non-occupant Loans on < 5 Family Dwellings (A B C & D)
G) Loans On Manufactured Home Dwelling (A B C & D)
Number
Average Value
Number
Average Value
Number
Average Value
Number
Average Value
Number
Average Value
Number
Average Value
LOANS ORIGINATED
3
$109,803
27
$133,851
22
$89,890
14
$39,555
1
$116,830
0
$0
APPLICATIONS APPROVED, NOT ACCEPTED
0
$0
4
$116,760
4
$86,320
1
$37,480
0
$0
0
$0
APPLICATIONS DENIED
0
$0
3
$97,857
16
$95,212
7
$18,331
1
$92,200
1
$31,740
APPLICATIONS WITHDRAWN
0
$0
3
$173,920
12
$105,062
1
$19,970
0
$0
0
$0
FILES CLOSED FOR INCOMPLETENESS
0
$0
1
$45,420
2
$144,325
0
$0
0
$0
0
$0
Aggregated Statistics For Year 2005 (Based on 2 partial tracts)
A) FHA, FSA/RHS & VA Home Purchase Loans
B) Conventional Home Purchase Loans
C) Refinancings
D) Home Improvement Loans
F) Non-occupant Loans on < 5 Family Dwellings (A B C & D)
Number
Average Value
Number
Average Value
Number
Average Value
Number
Average Value
Number
Average Value
LOANS ORIGINATED
1
$90,290
30
$138,195
24
$86,207
15
$19,261
1
$58,280
APPLICATIONS APPROVED, NOT ACCEPTED
0
$0
3
$131,327
5
$99,918
2
$36,115
0
$0
APPLICATIONS DENIED
1
$67,850
5
$65,882
18
$100,761
5
$21,724
2
$90,015
APPLICATIONS WITHDRAWN
0
$0
2
$98,360
9
$138,989
1
$200,820
1
$89,740
FILES CLOSED FOR INCOMPLETENESS
0
$0
1
$64,840
6
$141,862
0
$0
0
$0
Aggregated Statistics For Year 2004 (Based on 2 partial tracts)
A) FHA, FSA/RHS & VA Home Purchase Loans
B) Conventional Home Purchase Loans
C) Refinancings
D) Home Improvement Loans
F) Non-occupant Loans on < 5 Family Dwellings (A B C & D)
G) Loans On Manufactured Home Dwelling (A B C & D)
Number
Average Value
Number
Average Value
Number
Average Value
Number
Average Value
Number
Average Value
Number
Average Value
LOANS ORIGINATED
2
$130,370
28
$126,833
30
$114,520
12
$31,396
1
$51,980
1
$63,750
APPLICATIONS APPROVED, NOT ACCEPTED
0
$0
2
$91,380
5
$75,678
1
$94,120
0
$0
0
$0
APPLICATIONS DENIED
0
$0
2
$73,325
19
$103,766
4
$40,972
0
$0
1
$25,990
APPLICATIONS WITHDRAWN
0
$0
2
$109,715
11
$121,105
2
$45,280
0
$0
0
$0
FILES CLOSED FOR INCOMPLETENESS
0
$0
0
$0
4
$128,045
1
$54,720
0
$0
0
$0
Aggregated Statistics For Year 2003 (Based on 2 partial tracts)
A) FHA, FSA/RHS & VA Home Purchase Loans
B) Conventional Home Purchase Loans
C) Refinancings
D) Home Improvement Loans
F) Non-occupant Loans on < 5 Family Dwellings (A B C & D)
Number
Average Value
Number
Average Value
Number
Average Value
Number
Average Value
Number
Average Value
LOANS ORIGINATED
3
$88,373
24
$120,053
75
$95,439
11
$16,665
2
$84,130
APPLICATIONS APPROVED, NOT ACCEPTED
0
$0
2
$149,385
8
$98,496
0
$0
0
$0
APPLICATIONS DENIED
0
$0
2
$40,630
20
$89,672
2
$19,835
1
$45,420
APPLICATIONS WITHDRAWN
0
$0
4
$129,960
15
$94,939
1
$8,210
1
$82,900
FILES CLOSED FOR INCOMPLETENESS
0
$0
1
$124,490
2
$102,190
0
$0
0
$0
Aggregated Statistics For Year 2002 (Based on 2 partial tracts)
A) FHA, FSA/RHS & VA Home Purchase Loans
B) Conventional Home Purchase Loans
C) Refinancings
D) Home Improvement Loans
F) Non-occupant Loans on < 5 Family Dwellings (A B C & D)
Number
Average Value
Number
Average Value
Number
Average Value
Number
Average Value
Number
Average Value
LOANS ORIGINATED
2
$87,825
22
$128,343
40
$91,594
8
$14,706
1
$50,070
APPLICATIONS APPROVED, NOT ACCEPTED
0
$0
1
$169,910
3
$105,427
0
$0
0
$0
APPLICATIONS DENIED
0
$0
4
$75,582
11
$85,662
4
$10,260
0
$0
APPLICATIONS WITHDRAWN
0
$0
3
$100,683
8
$90,185
1
$32,560
1
$139,260
FILES CLOSED FOR INCOMPLETENESS
0
$0
1
$84,000
1
$124,490
0
$0
0
$0
Aggregated Statistics For Year 2001 (Based on 2 partial tracts)
A) FHA, FSA/RHS & VA Home Purchase Loans
B) Conventional Home Purchase Loans
C) Refinancings
D) Home Improvement Loans
F) Non-occupant Loans on < 5 Family Dwellings (A B C & D)
Number
Average Value
Number
Average Value
Number
Average Value
Number
Average Value
Number
Average Value
LOANS ORIGINATED
5
$86,512
23
$130,079
39
$91,537
10
$9,850
1
$22,440
APPLICATIONS APPROVED, NOT ACCEPTED
0
$0
4
$77,430
5
$80,930
1
$9,300
1
$23,530
APPLICATIONS DENIED
0
$0
3
$42,133
13
$67,705
3
$14,320
0
$0
APPLICATIONS WITHDRAWN
0
$0
1
$108,620
7
$65,547
0
$0
0
$0
FILES CLOSED FOR INCOMPLETENESS
0
$0
0
$0
1
$65,940
0
$0
0
$0
Aggregated Statistics For Year 2000 (Based on 2 partial tracts)
A) FHA, FSA/RHS & VA Home Purchase Loans
B) Conventional Home Purchase Loans
C) Refinancings
D) Home Improvement Loans
F) Non-occupant Loans on < 5 Family Dwellings (A B C & D)
Number
Average Value
Number
Average Value
Number
Average Value
Number
Average Value
Number
Average Value
LOANS ORIGINATED
3
$107,250
26
$112,997
9
$78,098
9
$12,312
1
$47,330
APPLICATIONS APPROVED, NOT ACCEPTED
0
$0
2
$66,760
4
$38,168
2
$18,605
0
$0
APPLICATIONS DENIED
1
$68,130
5
$83,996
7
$50,069
4
$24,760
1
$14,500
APPLICATIONS WITHDRAWN
1
$65,120
2
$62,520
6
$57,867
1
$10,940
0
$0
FILES CLOSED FOR INCOMPLETENESS
0
$0
0
$0
2
$49,930
0
$0
0
$0
Aggregated Statistics For Year 1999 (Based on 1 partial tract)
A) FHA, FSA/RHS & VA Home Purchase Loans
B) Conventional Home Purchase Loans
C) Refinancings
D) Home Improvement Loans
F) Non-occupant Loans on < 5 Family Dwellings (A B C & D)

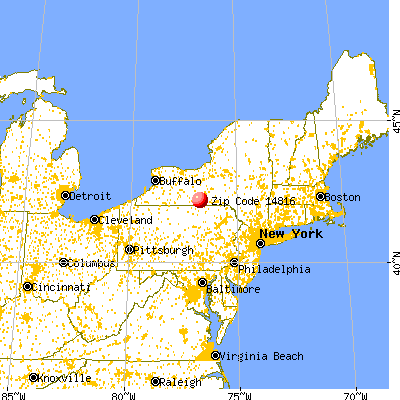


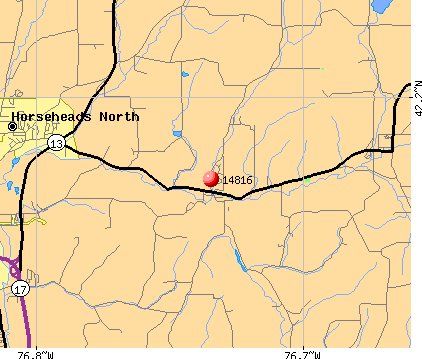 Nearest zip codes: 14824, 14838, 14845, 14901, 14861, 14864.


