Estimated zip code population in 2022: 1,119 Zip code population in 2010: 1,404 Zip code population in 2000: 1,459
Houses and condos: 596 Renter-occupied apartments: 99
% of renters here:
19%
State:
46%
March 2022 cost of living index in zip code 14861: 95.1 (less than average, U.S. average is 100)
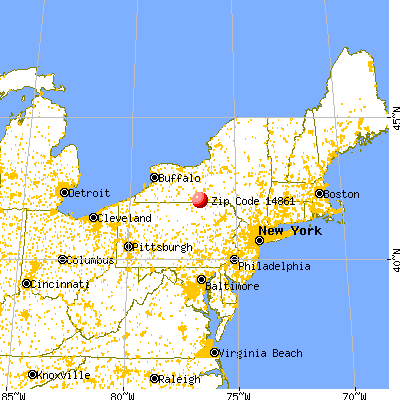
Land area: 34.2 sq. mi. Water area: 0.3 sq. mi.
Population density: 33 people per square mile
(very low).
OSM Map
General Map
Google Map
MSN Map
OSM Map
General Map
Google Map
MSN Map
OSM Map
General Map
Google Map
MSN Map
OSM Map
General Map
Google Map
MSN Map
Please wait while loading the map...
Real estate property taxes paid for housing units in 2022:
This zip code:
2.7% ($3,431)
New York:
1.5% ($6,180)
Median real estate property taxes paid for housing units with mortgages in 2022: $4,195 (2.0%) Median real estate property taxes paid for housing units with no mortgage in 2022: $2,420 (2.3%)
Business Search- 14 Million verified businesses
Males: 603
(53.9%)
Females: 516
(46.1%)
For population 25 years and over in 14861:
High school or higher: 82.7%
Bachelor's degree or higher: 13.1%
Graduate or professional degree: 2.9%
Unemployed: 5.8%
Mean travel time to work (commute): 21.0 minutes
For population 15 years and over in 14861:
Never married: 21.4%
Now married: 55.2%
Separated: 0.0%
Widowed: 8.2%
Divorced: 15.2%
Zip code 14861 compared to state average:
Median house value significantly below state average.
Black race population percentage significantly below state average.
Hispanic race population percentage significantly below state average.
Median age significantly above state average.
Foreign-born population percentage significantly below state average.
Renting percentage significantly below state average.
Length of stay since moving in above state average.
House age below state average.
Number of college students significantly below state average.
Percentage of population with a bachelor's degree or higher significantly below state average.
Averages for the 2020 tax year for zip code 14861, filed in 2021:
Average Adjusted Gross Income (AGI) in 2020: $51,190 (Individual Income Tax Returns)
Here:
$51,190
State:
$90,930
Salary/wage: $43,157 (reported on 78.0% of returns)
Here:
$43,157
State:
$72,104
(% of AGI for various income ranges: 1167.1% for AGIs below $25k, 3191.4% for AGIs $25k-50k, 5512.5% for AGIs $50k-75k, 9683.3% for AGIs $75k-100k, 16087.5% for AGIs $100k-200k)
Taxable interest for individuals: $465 (reported on 33.9% of returns)
This zip code:
$465
New York:
$3,075
(% of AGI for various income ranges: 3.6% for AGIs below $25k, 20.7% for AGIs $25k-50k, 20.0% for AGIs $50k-75k, 90.0% for AGIs $75k-100k, 40.0% for AGIs $100k-200k)
Ordinary dividends: $900 (reported on 11.9% of returns)
Here:
$900
State:
$11,095
(% of AGI for various income ranges: 30.7% for AGIs $25k-50k, 66.7% for AGIs $75k-100k)
Net capital gain/loss in AGI: +$2,100 (reported on 10.2% of returns)
Here:
+$2,100
State:
+$44,925
(% of AGI for various income ranges: 45.0% for AGIs below $25k, 78.8% for AGIs $50k-75k)
Profit/loss from business: +$4,017 (reported on 10.2% of returns)
Here:
+$4,017
State:
+$14,940
(% of AGI for various income ranges: 132.1% for AGIs below $25k, 70.0% for AGIs $50k-75k)
Taxable individual retirement arrangement distribution: $14,233 (reported on 10.2% of returns)
14861:
$14,233
New York:
$19,609
(% of AGI for various income ranges: 211.4% for AGIs $25k-50k, 1860.0% for AGIs $75k-100k)
Earned income credit: $2,111 (reported on 15.3% of returns)
Here:
$2,111
State:
$2,138
(% of AGI for various income ranges: 77.9% for AGIs below $25k, 57.9% for AGIs $25k-50k)
Percentage of individuals using paid preparers for their 2020 taxes: 93.2%
Here:
93%
State:
95%
(% for various income ranges: 94.7% for AGIs below $25k, 94.1% for AGIs $25k-50k, 90.9% for AGIs $50k-75k, 100.0% for AGIs $75k-100k, 85.7% for AGIs $100k-200k)
Averages for the 2012 tax year for zip code 14861, filed in 2013:
Average Adjusted Gross Income (AGI) in 2012: $43,215 (Individual Income Tax Returns)
Here:
$43,215
State:
$77,088
Salary/wage: $38,077 (reported on 86.2% of returns)
Here:
$38,077
State:
$60,593
(% of AGI for various income ranges: 72.0% for AGIs below $25k, 77.5% for AGIs $25k-50k, 76.9% for AGIs $50k-75k, 77.2% for AGIs $75k-100k, 74.7% for AGIs $100k-200k)
Taxable interest for individuals: $400 (reported on 32.3% of returns)
This zip code:
$400
New York:
$3,125
(% of AGI for various income ranges: 0.5% for AGIs below $25k, 0.3% for AGIs $25k-50k, 0.3% for AGIs $50k-75k, 0.4% for AGIs $75k-100k, 0.2% for AGIs $100k-200k)
Ordinary dividends: $588 (reported on 12.3% of returns)
Here:
$588
State:
$10,299
Net capital gain/loss in AGI: +$2,250 (reported on 9.2% of returns)
Here:
+$2,250
State:
+$42,474
Profit/loss from business: +$6,200 (reported on 10.8% of returns)
Here:
+$6,200
State:
+$16,168
Taxable individual retirement arrangement distribution: $6,060 (reported on 7.7% of returns)
14861:
$6,060
New York:
$17,621
Total itemized deductions: $17,957 (21% of AGI, reported on 21.5% of returns)
Here:
$17,957
State:
$34,985
Here:
21.1% of AGI
State:
21.3% of AGI
(% of AGI for various income ranges: 8.2% for AGIs $25k-50k, 7.0% for AGIs $50k-75k, 11.2% for AGIs $75k-100k, 14.2% for AGIs $100k-200k)
Charity contributions: $2,625 (reported on 18.5% of returns)
Here:
$2,625
State:
$5,572
(% of AGI for various income ranges: 1.0% for AGIs $25k-50k, 0.5% for AGIs $50k-75k, 1.8% for AGIs $75k-100k, 2.0% for AGIs $100k-200k)
Taxes paid: $8,264 (reported on 21.5% of returns)
14861:
$8,264
State:
$18,656
(% of AGI for various income ranges: 2.5% for AGIs $25k-50k, 2.7% for AGIs $50k-75k, 6.0% for AGIs $75k-100k, 7.7% for AGIs $100k-200k)
Earned income credit: $2,231 (reported on 20.0% of returns)
Here:
$2,231
State:
$2,230
(% of AGI for various income ranges: 6.4% for AGIs below $25k, 1.1% for AGIs $25k-50k)
Percentage of individuals using paid preparers for their 2012 taxes: 52.3%
Here:
52%
State:
66%
(% for various income ranges: 42.3% for AGIs below $25k, 50.0% for AGIs $25k-50k, 63.6% for AGIs $50k-75k, 80.0% for AGIs $75k-100k, 60.0% for AGIs $100k-200k)
Averages for the 2004 tax year for zip code 14861, filed in 2005:
Average Adjusted Gross Income (AGI) in 2004: $34,218 (Individual Income Tax Returns)
Here:
$34,218
State:
$59,519
Salary/wage: $32,474 (reported on 86.0% of returns)
Here:
$32,474
State:
$50,673
(% of AGI for various income ranges: 116.6% for AGIs below $10k, 73.9% for AGIs $10k-25k, 84.0% for AGIs $25k-50k, 84.1% for AGIs $50k-75k, 84.2% for AGIs $75k-100k, 67.6% for AGIs over 100k)
Taxable interest for individuals: $414 (reported on 45.1% of returns)
This zip code:
$414
New York:
$2,377
(% of AGI for various income ranges: 1.8% for AGIs below $10k, 0.9% for AGIs $10k-25k, 0.4% for AGIs $25k-50k, 0.5% for AGIs $50k-75k, 0.4% for AGIs $75k-100k, 0.7% for AGIs over 100k)
Taxable dividends: $435 (reported on 13.8% of returns)
Here:
$435
State:
$5,394
(% of AGI for various income ranges: 0.9% for AGIs below $10k, 0.1% for AGIs $10k-25k, 0.0% for AGIs $25k-50k, 0.3% for AGIs $50k-75k, 0.6% for AGIs $75k-100k)
Net capital gain/loss: +$300 (reported on 8.1% of returns)
Here:
+$300
State:
+$23,581
Profit/loss from business: +$7,522 (reported on 10.9% of returns)
Here:
+$7,522
State:
+$13,809
(% of AGI for various income ranges: 6.0% for AGIs below $10k, 5.5% for AGIs $10k-25k, 2.1% for AGIs $25k-50k, 3.1% for AGIs $50k-75k)
IRA payment deduction: $1,917 (reported on 1.9% of returns)
14861:
$1,917
New York:
$3,115
Total itemized deductions: $13,125 (20% of AGI, reported on 19.5% of returns)
Here:
$13,125
State:
$25,864
Here:
20.0% of AGI
State:
21.9% of AGI
(% of AGI for various income ranges: 5.8% for AGIs $25k-50k, 9.2% for AGIs $50k-75k, 12.5% for AGIs $75k-100k, 11.8% for AGIs over 100k)
Charity contributions deductions: $2,272 (3% of AGI, reported on 16.7% of returns)
Here:
$2,272
State:
$4,439
Here:
3.4% of AGI
State:
3.6% of AGI
(% of AGI for various income ranges: 0.7% for AGIs $25k-50k, 1.6% for AGIs $50k-75k, 2.8% for AGIs $75k-100k, 1.0% for AGIs over 100k)
Total tax: $4,081 (reported on 72.1% of returns)
14861:
$4,081
State:
$11,730
(% of AGI for various income ranges: 2.5% for AGIs below $10k, 4.1% for AGIs $10k-25k, 6.9% for AGIs $25k-50k, 9.6% for AGIs $50k-75k, 9.5% for AGIs $75k-100k, 15.6% for AGIs over 100k)
Earned income credit: $1,673 (reported on 18.3% of returns)
Here:
$1,673
State:
$1,757
Percentage of individuals using paid preparers for their 2004 taxes: 58.8%
Here:
59%
State:
67%
(% for various income ranges: 51.2% for AGIs below $10k, 56.5% for AGIs $10k-25k, 60.9% for AGIs $25k-50k, 63.7% for AGIs $50k-75k, 63.0% for AGIs $75k-100k, 72.2% for AGIs over 100k)
Household received Food Stamps/SNAP in the past 12 months: 82 Household did not receive Food Stamps/SNAP in the past 12 months: 443
Women who did not have a birth in the past 12 months: 131 (57 now married, 73 unmarried)
Housing units in zip code 14861 with a mortgage: 150 (12 second mortgage, 12 both second mortgage and home equity loan) Median monthly owner costs for units with a mortgage: $1,613 Median monthly owner costs for units without a mortgage: $605
Residents with income below the poverty level in 2022:
This zip code:
12.2%
Whole state:
14.3%
Residents with income below 50% of the poverty level in 2022:
This zip code:
5.6%
Whole state:
6.8%
Median number of rooms in houses and condos:
Here:
6.1
State:
6.3
Median number of rooms in apartments:
Here:
5.1
State:
3.8
Notable locations in this zip code not listed on our city pages
Notable locations in zip code 14861: Wacombers Corners (A), Garner Hill Campground (B), Chemung County Landfill (C), Grace Farms (D), Schmidt Valley Farm (E). Display/hide their locations on the map
Cemeteries: Riverside Cemetery (1), Wacomber Cemetery (2), North Chemung Cemetery (3), Elliott-Searles Cemetery (4). Display/hide their locations on the map
Size of family households: 192 2-persons, 58 3-persons, 52 4-persons, 6 5-persons, 6 6-persons, 1 7-or-more-persons
Size of nonfamily households: 155 1-person, 56 2-persons
72 married couples with children.
30 single-parent households (2 men, 28 women).
99.5% of residents of 14861 zip code speak English at home.
1.0% of residents speak Spanish at home (100% very well).
Foreign born population: 15 (1.4%) (100.0% of them are naturalized citizens)
This zip code:
1.4%
Whole state:
22.7%
71%Bahamas
7%St. Vincent and the Grenadines
33%American
22%German
13%English
7%Irish
5%Scottish
3%Danish
3%Italian
Year of entry for the foreign-born population
02010 or later
02000 to 2009
71990 to 1999
12Before 1990
Facilities with environmental interests located in this zip code:
CHEMUNG COUNTY SWDD SANITARY LANDFILL (4298 COUNTY 60 RD in LOWMAN, NY)
CRITERIA AND HAZARDOUS AIR POLLUTANT INVENTORY (Inventory of air pollution sources) Business SIC classification: REFUSE SYSTEMS Business NAICS classification: SOLID WASTE LANDFILL.
45.2%Bottled, tank, or LP gas
20.9%Wood
14.9%Fuel oil, kerosene, etc.
7.8%Coal or coke
5.9%Electricity
4.1%Other fuel
2.0%Utility gas
Population in 1990: 2,338.
Place of birth for U.S.-born residents:
This state: 822
Northeast: 208
Midwest: 18
South: 46
63% of the 14861 zip code residents lived in the same house 5 years ago. Out of people who lived in different houses, 63% lived in this county. Out of people who lived in different counties, 50% lived in New York.
97% of the 14861 zip code residents lived in the same house 1 year ago. Out of people who lived in different houses, 8% moved from different county within same state. Out of people who lived in different houses, 96% moved from different state.
Private vs. public school enrollment:
Students in private schools in grades 1 to 8 (elementary and middle school):
Here:
0.0%
New York:
15.6%
Students in private schools in grades 9 to 12 (high school): 5
Here:
14.3%
New York:
15.0%
Students in private undergraduate colleges:
Here:
0.0%
New York:
39.2%
Occupation by median earnings in the past 12 months ($)
57,623Installation, maintenance, and repair occupations
47,563Sales and related occupations
46,912Business and financial operations occupations
40,864Health technologists and technicians
36,375Transportation occupations
35,871Production occupations
Top industries in this zip code by the number of employees in 2005:
Health Care and Social Assistance: Residential Mental Retardation Facilities (20-49 employees: 1 establishment)
Construction: Poured Concrete Foundation and Structure Contractors (10-19: 1)
Construction: Electrical Contractors (5-9: 1)
Construction: Plumbing, Heating, and Air-Conditioning Contractors (5-9: 1)
Construction: Siding Contractors (1-4: 2)
Construction: Site Preparation Contractors (1-4: 1)
Mining: Construction Sand and Gravel Mining (1-4: 1)
Construction: Masonry Contractors (1-4: 1)
Fatal accident statistics in 2013:
Fatal accident count: 1
Vehicles involved in fatal accidents: 1
Fatal accidents caused by drunken drivers: 0
Fatalities: 1
Persons involved in fatal accidents: 1
Pedestrians involved in fatal accidents: 0
Home Mortgage Disclosure Act Aggregated Statistics For Year 2009 (Based on 2 partial tracts)
A) FHA, FSA/RHS & VA Home Purchase Loans
B) Conventional Home Purchase Loans
C) Refinancings
D) Home Improvement Loans
F) Non-occupant Loans on < 5 Family Dwellings (A B C & D)
G) Loans On Manufactured Home Dwelling (A B C & D)
Number
Average Value
Number
Average Value
Number
Average Value
Number
Average Value
Number
Average Value
Number
Average Value
LOANS ORIGINATED
2
$88,670
5
$116,506
30
$87,173
10
$27,274
3
$66,783
4
$78,148
APPLICATIONS APPROVED, NOT ACCEPTED
0
$0
2
$116,450
2
$127,390
1
$33,670
1
$41,530
1
$62,850
APPLICATIONS DENIED
1
$87,550
8
$39,004
10
$89,006
4
$8,840
1
$106,070
10
$38,667
APPLICATIONS WITHDRAWN
0
$0
0
$0
11
$124,178
1
$4,490
1
$204,840
0
$0
FILES CLOSED FOR INCOMPLETENESS
0
$0
0
$0
0
$0
0
$0
0
$0
0
$0
Aggregated Statistics For Year 2008 (Based on 2 partial tracts)
A) FHA, FSA/RHS & VA Home Purchase Loans
B) Conventional Home Purchase Loans
C) Refinancings
D) Home Improvement Loans
F) Non-occupant Loans on < 5 Family Dwellings (A B C & D)
G) Loans On Manufactured Home Dwelling (A B C & D)
Number
Average Value
Number
Average Value
Number
Average Value
Number
Average Value
Number
Average Value
Number
Average Value
LOANS ORIGINATED
2
$125,990
12
$102,138
18
$91,071
14
$19,481
2
$77,445
7
$60,289
APPLICATIONS APPROVED, NOT ACCEPTED
0
$0
1
$55,560
2
$75,760
2
$13,190
1
$55,560
1
$55,560
APPLICATIONS DENIED
1
$31,430
7
$82,336
15
$89,755
13
$18,002
3
$46,767
7
$39,926
APPLICATIONS WITHDRAWN
0
$0
1
$39,280
6
$109,433
2
$93,440
0
$0
1
$15,710
FILES CLOSED FOR INCOMPLETENESS
1
$76,320
0
$0
2
$86,985
0
$0
0
$0
0
$0
Aggregated Statistics For Year 2007 (Based on 2 partial tracts)
A) FHA, FSA/RHS & VA Home Purchase Loans
B) Conventional Home Purchase Loans
C) Refinancings
D) Home Improvement Loans
F) Non-occupant Loans on < 5 Family Dwellings (A B C & D)
G) Loans On Manufactured Home Dwelling (A B C & D)
Number
Average Value
Number
Average Value
Number
Average Value
Number
Average Value
Number
Average Value
Number
Average Value
LOANS ORIGINATED
0
$0
14
$73,958
19
$75,112
23
$20,569
1
$38,720
8
$57,664
APPLICATIONS APPROVED, NOT ACCEPTED
1
$54,440
1
$31,430
7
$81,774
2
$48,545
1
$5,610
2
$76,045
APPLICATIONS DENIED
0
$0
5
$56,344
22
$73,390
13
$23,614
3
$19,267
3
$34,607
APPLICATIONS WITHDRAWN
0
$0
2
$69,310
16
$97,509
2
$27,500
0
$0
1
$51,630
FILES CLOSED FOR INCOMPLETENESS
0
$0
0
$0
1
$64,540
1
$28,060
0
$0
1
$28,060
Aggregated Statistics For Year 2006 (Based on 2 partial tracts)
A) FHA, FSA/RHS & VA Home Purchase Loans
B) Conventional Home Purchase Loans
C) Refinancings
D) Home Improvement Loans
F) Non-occupant Loans on < 5 Family Dwellings (A B C & D)
G) Loans On Manufactured Home Dwelling (A B C & D)
Number
Average Value
Number
Average Value
Number
Average Value
Number
Average Value
Number
Average Value
Number
Average Value
LOANS ORIGINATED
2
$75,200
15
$97,050
26
$68,963
12
$16,508
1
$51,070
4
$50,788
APPLICATIONS APPROVED, NOT ACCEPTED
1
$30,870
2
$49,385
6
$95,778
3
$20,017
1
$11,220
1
$37,040
APPLICATIONS DENIED
1
$76,880
11
$82,649
32
$84,250
18
$37,538
2
$49,945
12
$61,077
APPLICATIONS WITHDRAWN
0
$0
6
$91,850
16
$86,390
1
$30,300
2
$90,355
1
$45,460
FILES CLOSED FOR INCOMPLETENESS
0
$0
0
$0
1
$107,190
1
$15,710
0
$0
0
$0
Aggregated Statistics For Year 2005 (Based on 2 partial tracts)
A) FHA, FSA/RHS & VA Home Purchase Loans
B) Conventional Home Purchase Loans
C) Refinancings
D) Home Improvement Loans
F) Non-occupant Loans on < 5 Family Dwellings (A B C & D)
G) Loans On Manufactured Home Dwelling (A B C & D)
Number
Average Value
Number
Average Value
Number
Average Value
Number
Average Value
Number
Average Value
Number
Average Value
LOANS ORIGINATED
3
$60,423
17
$83,817
21
$69,455
17
$13,436
4
$54,718
2
$62,295
APPLICATIONS APPROVED, NOT ACCEPTED
1
$48,820
2
$59,485
6
$83,900
3
$26,750
1
$560
4
$60,750
APPLICATIONS DENIED
0
$0
11
$59,946
33
$75,354
13
$11,742
4
$16,555
12
$53,173
APPLICATIONS WITHDRAWN
1
$25,250
3
$49,947
19
$96,379
0
$0
0
$0
2
$34,515
FILES CLOSED FOR INCOMPLETENESS
0
$0
0
$0
3
$59,113
1
$24,130
0
$0
0
$0
Aggregated Statistics For Year 2004 (Based on 2 partial tracts)
A) FHA, FSA/RHS & VA Home Purchase Loans
B) Conventional Home Purchase Loans
C) Refinancings
D) Home Improvement Loans
F) Non-occupant Loans on < 5 Family Dwellings (A B C & D)
G) Loans On Manufactured Home Dwelling (A B C & D)
Number
Average Value
Number
Average Value
Number
Average Value
Number
Average Value
Number
Average Value
Number
Average Value
LOANS ORIGINATED
1
$42,090
16
$86,425
25
$71,564
11
$20,407
1
$30,300
4
$52,892
APPLICATIONS APPROVED, NOT ACCEPTED
0
$0
4
$81,795
8
$76,955
1
$45,460
1
$67,340
2
$55,280
APPLICATIONS DENIED
1
$19,640
10
$55,447
50
$79,051
12
$24,739
2
$19,080
11
$45,713
APPLICATIONS WITHDRAWN
0
$0
3
$76,697
21
$84,073
4
$26,378
1
$86,420
2
$48,825
FILES CLOSED FOR INCOMPLETENESS
0
$0
1
$121,780
3
$112,053
0
$0
0
$0
0
$0
Aggregated Statistics For Year 2003 (Based on 2 partial tracts)
A) FHA, FSA/RHS & VA Home Purchase Loans
B) Conventional Home Purchase Loans
C) Refinancings
D) Home Improvement Loans
F) Non-occupant Loans on < 5 Family Dwellings (A B C & D)
Number
Average Value
Number
Average Value
Number
Average Value
Number
Average Value
Number
Average Value
LOANS ORIGINATED
2
$87,830
15
$61,881
50
$74,909
14
$14,271
3
$62,667
APPLICATIONS APPROVED, NOT ACCEPTED
0
$0
3
$62,667
8
$87,548
1
$22,450
0
$0
APPLICATIONS DENIED
0
$0
10
$60,610
32
$72,552
8
$16,766
1
$80,810
APPLICATIONS WITHDRAWN
0
$0
1
$32,550
21
$74,399
2
$44,615
1
$51,070
FILES CLOSED FOR INCOMPLETENESS
0
$0
0
$0
4
$102,560
0
$0
0
$0
Aggregated Statistics For Year 2002 (Based on 2 partial tracts)
A) FHA, FSA/RHS & VA Home Purchase Loans
B) Conventional Home Purchase Loans
C) Refinancings
D) Home Improvement Loans
F) Non-occupant Loans on < 5 Family Dwellings (A B C & D)
Number
Average Value
Number
Average Value
Number
Average Value
Number
Average Value
Number
Average Value
LOANS ORIGINATED
2
$75,760
17
$74,276
35
$81,743
13
$23,225
2
$47,985
APPLICATIONS APPROVED, NOT ACCEPTED
1
$52,750
5
$35,916
9
$69,713
2
$11,505
2
$52,755
APPLICATIONS DENIED
0
$0
14
$41,649
39
$64,423
8
$14,661
1
$43,770
APPLICATIONS WITHDRAWN
1
$70,150
1
$126,270
19
$67,374
1
$22,450
0
$0
FILES CLOSED FOR INCOMPLETENESS
1
$28,620
1
$16,270
6
$118,975
0
$0
0
$0
Aggregated Statistics For Year 2001 (Based on 2 partial tracts)
A) FHA, FSA/RHS & VA Home Purchase Loans
B) Conventional Home Purchase Loans
C) Refinancings
D) Home Improvement Loans
F) Non-occupant Loans on < 5 Family Dwellings (A B C & D)
Number
Average Value
Number
Average Value
Number
Average Value
Number
Average Value
Number
Average Value
LOANS ORIGINATED
2
$55,280
15
$77,932
27
$67,490
17
$16,539
1
$11,220
APPLICATIONS APPROVED, NOT ACCEPTED
0
$0
9
$68,966
2
$58,365
1
$11,220
0
$0
APPLICATIONS DENIED
1
$48,260
18
$54,312
25
$66,334
4
$9,680
1
$315,960
APPLICATIONS WITHDRAWN
1
$14,030
2
$50,225
18
$59,051
2
$15,150
0
$0
FILES CLOSED FOR INCOMPLETENESS
0
$0
0
$0
4
$59,628
0
$0
0
$0
Aggregated Statistics For Year 2000 (Based on 2 partial tracts)
A) FHA, FSA/RHS & VA Home Purchase Loans
B) Conventional Home Purchase Loans
C) Refinancings
D) Home Improvement Loans
F) Non-occupant Loans on < 5 Family Dwellings (A B C & D)
Number
Average Value
Number
Average Value
Number
Average Value
Number
Average Value
Number
Average Value
LOANS ORIGINATED
2
$60,330
21
$56,334
19
$54,673
12
$13,562
1
$20,200
APPLICATIONS APPROVED, NOT ACCEPTED
1
$35,360
10
$54,380
3
$72,770
1
$12,910
0
$0
APPLICATIONS DENIED
1
$71,830
51
$39,394
17
$53,875
10
$20,372
1
$56,680
APPLICATIONS WITHDRAWN
1
$46,580
2
$42,650
12
$48,591
1
$12,910
1
$9,540
FILES CLOSED FOR INCOMPLETENESS
0
$0
0
$0
2
$65,660
0
$0
0
$0
Aggregated Statistics For Year 1999 (Based on 1 partial tract)
A) FHA, FSA/RHS & VA Home Purchase Loans
B) Conventional Home Purchase Loans
C) Refinancings
D) Home Improvement Loans
F) Non-occupant Loans on < 5 Family Dwellings (A B C & D)


 Nearest zip codes: 14901, 14825, 14838, 14894, 14904, 14816.


