Estimated zip code population in 2022: 821 Zip code population in 2010: 1,009 Zip code population in 2000: 1,103
Houses and condos: 502 Renter-occupied apartments: 21
% of renters here:
5%
State:
46%
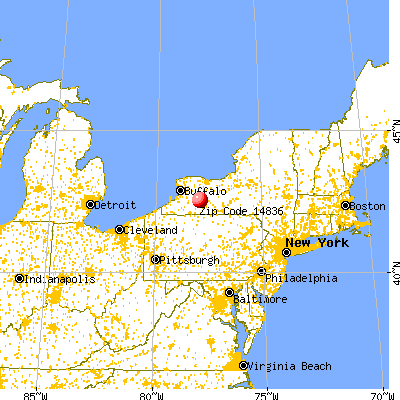
March 2022 cost of living index in zip code 14836: 92.8 (less than average, U.S. average is 100)
Land area: 30.0 sq. mi. Water area: 0.1 sq. mi.
Population density: 27 people per square mile
(very low).
OSM Map
General Map
Google Map
MSN Map
OSM Map
General Map
Google Map
MSN Map
OSM Map
General Map
Google Map
MSN Map
OSM Map
General Map
Google Map
MSN Map
Please wait while loading the map...
Real estate property taxes paid for housing units in 2022:
This zip code:
2.9% ($2,773)
New York:
1.5% ($6,180)
Median real estate property taxes paid for housing units with mortgages in 2022: $3,156 (1.8%) Median real estate property taxes paid for housing units with no mortgage in 2022: $2,027 (1.3%)
Business Search- 14 Million verified businesses
Males: 439
(53.4%)
Females: 382
(46.6%)
For population 25 years and over in 14836:
High school or higher: 90.3%
Bachelor's degree or higher: 19.8%
Graduate or professional degree: 12.1%
Unemployed: 2.0%
Mean travel time to work (commute): 39.8 minutes
For population 15 years and over in 14836:
Never married: 29.2%
Now married: 51.1%
Separated: 4.5%
Widowed: 5.5%
Divorced: 9.7%
Zip code 14836 compared to state average:
Median house value significantly below state average.
Unemployed percentage below state average.
Black race population percentage significantly below state average.
Hispanic race population percentage significantly below state average.
Median age significantly above state average.
Foreign-born population percentage significantly below state average.
Renting percentage significantly below state average.
Length of stay since moving in above state average.
Number of rooms per house above state average.
Number of college students significantly below state average.
Percentage of population with a bachelor's degree or higher below state average.
Averages for the 2020 tax year for zip code 14836, filed in 2021:
Average Adjusted Gross Income (AGI) in 2020: $58,292 (Individual Income Tax Returns)
Here:
$58,292
State:
$90,930
Salary/wage: $49,984 (reported on 77.6% of returns)
Here:
$49,984
State:
$72,104
(% of AGI for various income ranges: 1136.0% for AGIs below $25k, 3537.0% for AGIs $25k-50k, 5562.5% for AGIs $50k-75k, 8596.7% for AGIs $75k-100k, 18230.0% for AGIs $100k-200k)
Taxable interest for individuals: $800 (reported on 34.7% of returns)
This zip code:
$800
New York:
$3,075
(% of AGI for various income ranges: 22.0% for AGIs below $25k, 53.0% for AGIs $25k-50k, 6.2% for AGIs $50k-75k, 20.0% for AGIs $75k-100k, 125.0% for AGIs $100k-200k)
Ordinary dividends: $1,075 (reported on 16.3% of returns)
Here:
$1,075
State:
$11,095
(% of AGI for various income ranges: 40.0% for AGIs $25k-50k, 153.3% for AGIs $75k-100k)
Net capital gain/loss in AGI: +$3,817 (reported on 12.2% of returns)
Here:
+$3,817
State:
+$44,925
(% of AGI for various income ranges: 40.0% for AGIs $25k-50k, 630.0% for AGIs $75k-100k)
Profit/loss from business: +$4,325 (reported on 8.2% of returns)
Here:
+$4,325
State:
+$14,940
(% of AGI for various income ranges: 173.0% for AGIs $25k-50k)
Taxable individual retirement arrangement distribution: $12,417 (reported on 12.2% of returns)
14836:
$12,417
New York:
$19,609
(% of AGI for various income ranges: 413.0% for AGIs $25k-50k, 1106.7% for AGIs $75k-100k)
Earned income credit: $1,960 (reported on 10.2% of returns)
Here:
$1,960
State:
$2,138
(% of AGI for various income ranges: 49.0% for AGIs below $25k, 49.0% for AGIs $25k-50k)
Percentage of individuals using paid preparers for their 2020 taxes: 93.9%
Here:
94%
State:
95%
(% for various income ranges: 92.3% for AGIs below $25k, 92.9% for AGIs $25k-50k, 90.0% for AGIs $50k-75k, 100.0% for AGIs $75k-100k, 100.0% for AGIs $100k-200k)
Averages for the 2012 tax year for zip code 14836, filed in 2013:
Average Adjusted Gross Income (AGI) in 2012: $48,666 (Individual Income Tax Returns)
Here:
$48,666
State:
$77,088
Salary/wage: $43,454 (reported on 79.5% of returns)
Here:
$43,454
State:
$60,593
(% of AGI for various income ranges: 65.3% for AGIs below $25k, 64.7% for AGIs $25k-50k, 74.4% for AGIs $50k-75k, 74.6% for AGIs $75k-100k, 71.3% for AGIs $100k-200k)
Taxable interest for individuals: $589 (reported on 43.2% of returns)
This zip code:
$589
New York:
$3,125
(% of AGI for various income ranges: 2.5% for AGIs below $25k, 0.4% for AGIs $25k-50k, 0.4% for AGIs $50k-75k, 0.2% for AGIs $75k-100k, 0.3% for AGIs $100k-200k)
Ordinary dividends: $814 (reported on 15.9% of returns)
Here:
$814
State:
$10,299
(% of AGI for various income ranges: 1.0% for AGIs below $25k, 0.1% for AGIs $50k-75k, 0.6% for AGIs $75k-100k)
Net capital gain/loss in AGI: +$1,560 (reported on 11.4% of returns)
Here:
+$1,560
State:
+$42,474
Profit/loss from business: +$3,400 (reported on 9.1% of returns)
Here:
+$3,400
State:
+$16,168
Taxable individual retirement arrangement distribution: $7,000 (reported on 9.1% of returns)
14836:
$7,000
New York:
$17,621
Total itemized deductions: $16,591 (21% of AGI, reported on 25.0% of returns)
Here:
$16,591
State:
$34,985
Here:
20.9% of AGI
State:
21.3% of AGI
(% of AGI for various income ranges: 11.4% for AGIs $25k-50k, 6.8% for AGIs $50k-75k, 7.7% for AGIs $75k-100k, 12.0% for AGIs $100k-200k)
Charity contributions: $2,775 (reported on 18.2% of returns)
Here:
$2,775
State:
$5,572
(% of AGI for various income ranges: 2.3% for AGIs $25k-50k, 1.3% for AGIs $75k-100k, 1.2% for AGIs $100k-200k)
Taxes paid: $7,373 (reported on 25.0% of returns)
14836:
$7,373
State:
$18,656
(% of AGI for various income ranges: 3.4% for AGIs $25k-50k, 2.7% for AGIs $50k-75k, 3.9% for AGIs $75k-100k, 6.6% for AGIs $100k-200k)
Earned income credit: $2,117 (reported on 13.6% of returns)
Here:
$2,117
State:
$2,230
(% of AGI for various income ranges: 4.4% for AGIs below $25k, 1.0% for AGIs $25k-50k)
Percentage of individuals using paid preparers for their 2012 taxes: 65.9%
Here:
66%
State:
66%
(% for various income ranges: 60.0% for AGIs below $25k, 63.6% for AGIs $25k-50k, 75.0% for AGIs $50k-75k, 66.7% for AGIs $75k-100k, 75.0% for AGIs $100k-200k)
Averages for the 2004 tax year for zip code 14836, filed in 2005:
Average Adjusted Gross Income (AGI) in 2004: $38,304 (Individual Income Tax Returns)
Here:
$38,304
State:
$59,519
Salary/wage: $36,096 (reported on 84.2% of returns)
Here:
$36,096
State:
$50,673
(% of AGI for various income ranges: 97.7% for AGIs below $10k, 65.4% for AGIs $10k-25k, 82.1% for AGIs $25k-50k, 78.0% for AGIs $50k-75k, 114.1% for AGIs $75k-100k)
Taxable interest for individuals: $1,144 (reported on 48.4% of returns)
This zip code:
$1,144
New York:
$2,377
(% of AGI for various income ranges: 2.7% for AGIs below $10k, 2.8% for AGIs $10k-25k, 0.3% for AGIs $25k-50k, 3.0% for AGIs $50k-75k, 0.4% for AGIs $75k-100k)
Taxable dividends: $537 (reported on 21.4% of returns)
Here:
$537
State:
$5,394
(% of AGI for various income ranges: 0.9% for AGIs $10k-25k, 0.1% for AGIs $25k-50k, 0.3% for AGIs $50k-75k, 0.4% for AGIs $75k-100k)
Net capital gain/loss: +$1,157 (reported on 11.5% of returns)
Here:
+$1,157
State:
+$23,581
(% of AGI for various income ranges: 0.2% for AGIs $10k-25k, -0.4% for AGIs $25k-50k, 0.1% for AGIs $50k-75k, 2.1% for AGIs $75k-100k)
Profit/loss from business: +$3,833 (reported on 13.5% of returns)
Here:
+$3,833
State:
+$13,809
(% of AGI for various income ranges: 5.0% for AGIs below $10k, 8.0% for AGIs $10k-25k, 0.3% for AGIs $25k-50k, 1.1% for AGIs $50k-75k)
Total itemized deductions: $13,102 (22% of AGI, reported on 26.6% of returns)
Here:
$13,102
State:
$25,864
Here:
21.6% of AGI
State:
21.9% of AGI
(% of AGI for various income ranges: 7.3% for AGIs $10k-25k, 8.7% for AGIs $25k-50k, 8.8% for AGIs $50k-75k, 10.0% for AGIs $75k-100k, 13.8% for AGIs over 100k)
Charity contributions deductions: $2,390 (4% of AGI, reported on 22.5% of returns)
Here:
$2,390
State:
$4,439
Here:
3.7% of AGI
State:
3.6% of AGI
(% of AGI for various income ranges: 1.2% for AGIs $25k-50k, 1.8% for AGIs $50k-75k, 1.6% for AGIs $75k-100k, 2.2% for AGIs over 100k)
Total tax: $4,150 (reported on 76.6% of returns)
14836:
$4,150
State:
$11,730
(% of AGI for various income ranges: 3.0% for AGIs below $10k, 4.0% for AGIs $10k-25k, 6.5% for AGIs $25k-50k, 8.7% for AGIs $50k-75k, 10.6% for AGIs $75k-100k, 14.3% for AGIs over 100k)
Earned income credit: $1,413 (reported on 14.2% of returns)
Here:
$1,413
State:
$1,757
Percentage of individuals using paid preparers for their 2004 taxes: 69.1%
Here:
69%
State:
67%
(% for various income ranges: 52.6% for AGIs below $10k, 71.0% for AGIs $10k-25k, 70.2% for AGIs $25k-50k, 77.0% for AGIs $50k-75k, 92.5% for AGIs $75k-100k)
Likely homosexual households (counted as self-reported same-sex unmarried-partner households)
Lesbian couples: 0.8% of all households
Gay men: 0.0% of all households
Household received Food Stamps/SNAP in the past 12 months: 44 Household did not receive Food Stamps/SNAP in the past 12 months: 405
Women who had a birth in the past 12 months: 1 (1 now married, 0 unmarried) Women who did not have a birth in the past 12 months: 108 (38 now married, 69 unmarried)
Housing units in zip code 14836 with a mortgage: 242 (9 second mortgage, 3 home equity loan, 4 both second mortgage and home equity loan) Houses without a mortgage: 28
Median monthly owner costs for units with a mortgage: $910 Median monthly owner costs for units without a mortgage: $482
Residents with income below the poverty level in 2022:
This zip code:
7.9%
Whole state:
14.3%
Residents with income below 50% of the poverty level in 2022:
This zip code:
7.6%
Whole state:
6.8%
Median number of rooms in houses and condos:
Here:
6.9
State:
6.3
Median number of rooms in apartments:
Here:
7.4
State:
3.8
Notable locations in this zip code not listed on our city pages
Size of family households: 145 2-persons, 41 3-persons, 13 4-persons, 4 6-persons, 5 7-or-more-persons
Size of nonfamily households: 208 1-person, 38 2-persons, 1 3-persons
67 married couples with children.
12 single-parent households (1 men, 11 women).
99.6% of residents of 14836 zip code speak English at home.
0.6% of residents speak other Indo-European language at home (100% very well).
Foreign born population: 9 (1.2%) (20.8% of them are naturalized citizens)
This zip code:
1.2%
Whole state:
22.7%
11%Sweden
11%United Kingdom, excluding England and Scotland
39%German
17%English
15%Italian
9%European
8%American
6%Pennsylvania German
4%Polish
Year of entry for the foreign-born population
02010 or later
02000 to 2009
01990 to 1999
9Before 1990
Facilities with environmental interests located in this zip code:
AGWAY ENERGY PRODUCTS (STATE RD COR MAIN ST in DALTON, NY)
Conditionally Exempt Small Quantity Generators, less than 100 kg/month of hazardous waste (Resource Conservation and Recovery Act (tracking hazardous waste)) - notification Organizations: AGWAY PETROLEUM CORP (CONTACT/OWNER)
Housing units lacking complete plumbing facilities: 3.7% Housing units lacking complete kitchen facilities: 1.3%
52.3%Utility gas
17.7%Wood
16.1%Bottled, tank, or LP gas
4.8%Electricity
4.1%Fuel oil, kerosene, etc.
3.2%Coal or coke
2.5%Other fuel
Population in 1990: 875. Population change in the 1990s: +228 (+26.1%).
Place of birth for U.S.-born residents:
This state: 743
Northeast: 16
Midwest: 11
South: 7
West: 32
76% of the 14836 zip code residents lived in the same house 5 years ago. Out of people who lived in different houses, 58% lived in this county. Out of people who lived in different counties, 50% lived in New York.
95% of the 14836 zip code residents lived in the same house 1 year ago. Out of people who lived in different houses, 89% moved from this county. Out of people who lived in different houses, 6% moved from different county within same state.
Private vs. public school enrollment:
Students in private schools in grades 1 to 8 (elementary and middle school): 1
Here:
2.8%
New York:
15.6%
Students in private schools in grades 9 to 12 (high school):
Here:
0.0%
New York:
15.0%
Students in private undergraduate colleges:
Here:
0.0%
New York:
39.2%
Occupation by median earnings in the past 12 months ($)
86,754Construction and extraction occupations
78,721Education, training, and library occupations
54,041Law enforcement workers including supervisors
53,114Community and social service occupations
50,131Health technologists and technicians
46,123Transportation occupations
Top industries in this zip code by the number of employees in 2005:
Mining: Construction Sand and Gravel Mining (5-9 employees: 1 establishment)
Construction: Commercial and Institutional Building Construction (5-9: 1)
Construction: New Single-Family Housing Construction (except Operative Builders) (5-9: 1)
Professional, Scientific, and Technical Services: Surveying and Mapping (except Geophysical) Services (1-4: 1)
Construction: Poured Concrete Foundation and Structure Contractors (1-4: 1)
Other Services (except Public Administration): Religious Organizations (1-4: 1)
Home Mortgage Disclosure Act Aggregated Statistics For Year 2009 (Based on 2 partial tracts)
A) FHA, FSA/RHS & VA Home Purchase Loans
B) Conventional Home Purchase Loans
C) Refinancings
D) Home Improvement Loans
E) Loans on Dwellings For 5+ Families
F) Non-occupant Loans on < 5 Family Dwellings (A B C & D)
G) Loans On Manufactured Home Dwelling (A B C & D)
Number
Average Value
Number
Average Value
Number
Average Value
Number
Average Value
Number
Average Value
Number
Average Value
Number
Average Value
LOANS ORIGINATED
3
$83,410
7
$59,170
12
$78,871
7
$24,297
1
$78,310
1
$45,880
6
$53,737
APPLICATIONS APPROVED, NOT ACCEPTED
0
$0
1
$35,480
1
$104,010
1
$22,640
0
$0
0
$0
0
$0
APPLICATIONS DENIED
2
$42,825
3
$89,527
15
$95,359
4
$18,660
1
$104,010
1
$52,610
4
$61,945
APPLICATIONS WITHDRAWN
0
$0
1
$45,270
4
$70,050
2
$82,595
0
$0
0
$0
1
$45,270
FILES CLOSED FOR INCOMPLETENESS
0
$0
1
$32,430
1
$26,310
1
$11,010
0
$0
0
$0
1
$37,320
Aggregated Statistics For Year 2008 (Based on 2 partial tracts)
A) FHA, FSA/RHS & VA Home Purchase Loans
B) Conventional Home Purchase Loans
C) Refinancings
D) Home Improvement Loans
F) Non-occupant Loans on < 5 Family Dwellings (A B C & D)
G) Loans On Manufactured Home Dwelling (A B C & D)
Number
Average Value
Number
Average Value
Number
Average Value
Number
Average Value
Number
Average Value
Number
Average Value
LOANS ORIGINATED
6
$81,370
10
$80,207
12
$101,355
6
$12,848
2
$46,495
2
$59,650
APPLICATIONS APPROVED, NOT ACCEPTED
0
$0
0
$0
3
$72,600
1
$34,870
1
$53,840
0
$0
APPLICATIONS DENIED
1
$85,040
2
$54,755
16
$112,342
9
$12,848
1
$12,240
1
$73,420
APPLICATIONS WITHDRAWN
0
$0
0
$0
9
$122,088
0
$0
0
$0
1
$104,620
FILES CLOSED FOR INCOMPLETENESS
0
$0
0
$0
1
$152,950
0
$0
0
$0
0
$0
Aggregated Statistics For Year 2007 (Based on 2 partial tracts)
A) FHA, FSA/RHS & VA Home Purchase Loans
B) Conventional Home Purchase Loans
C) Refinancings
D) Home Improvement Loans
F) Non-occupant Loans on < 5 Family Dwellings (A B C & D)
G) Loans On Manufactured Home Dwelling (A B C & D)
Number
Average Value
Number
Average Value
Number
Average Value
Number
Average Value
Number
Average Value
Number
Average Value
LOANS ORIGINATED
7
$68,521
9
$73,620
17
$90,475
7
$17,917
0
$0
4
$65,002
APPLICATIONS APPROVED, NOT ACCEPTED
0
$0
2
$84,125
6
$79,432
2
$15,295
0
$0
0
$0
APPLICATIONS DENIED
0
$0
3
$101,967
38
$96,053
19
$24,858
2
$172,835
4
$49,710
APPLICATIONS WITHDRAWN
0
$0
2
$78,005
13
$99,300
0
$0
0
$0
1
$70,360
FILES CLOSED FOR INCOMPLETENESS
0
$0
1
$26,920
1
$145,000
1
$35,480
1
$7,950
0
$0
Aggregated Statistics For Year 2006 (Based on 2 partial tracts)
A) FHA, FSA/RHS & VA Home Purchase Loans
B) Conventional Home Purchase Loans
C) Refinancings
D) Home Improvement Loans
F) Non-occupant Loans on < 5 Family Dwellings (A B C & D)
G) Loans On Manufactured Home Dwelling (A B C & D)
Number
Average Value
Number
Average Value
Number
Average Value
Number
Average Value
Number
Average Value
Number
Average Value
LOANS ORIGINATED
4
$59,802
18
$69,541
21
$81,195
15
$24,431
1
$4,280
5
$56,286
APPLICATIONS APPROVED, NOT ACCEPTED
0
$0
1
$40,990
4
$75,405
4
$22,942
0
$0
1
$7,950
APPLICATIONS DENIED
1
$42,210
7
$86,089
31
$80,777
22
$24,416
4
$18,965
2
$68,215
APPLICATIONS WITHDRAWN
1
$47,110
1
$151,730
20
$76,720
4
$68,675
0
$0
1
$76,470
FILES CLOSED FOR INCOMPLETENESS
0
$0
1
$170,080
4
$108,442
0
$0
0
$0
1
$22,640
Aggregated Statistics For Year 2005 (Based on 2 partial tracts)
A) FHA, FSA/RHS & VA Home Purchase Loans
B) Conventional Home Purchase Loans
C) Refinancings
D) Home Improvement Loans
F) Non-occupant Loans on < 5 Family Dwellings (A B C & D)
G) Loans On Manufactured Home Dwelling (A B C & D)
Number
Average Value
Number
Average Value
Number
Average Value
Number
Average Value
Number
Average Value
Number
Average Value
LOANS ORIGINATED
6
$73,927
18
$89,764
20
$90,148
10
$14,867
4
$41,450
1
$27,530
APPLICATIONS APPROVED, NOT ACCEPTED
0
$0
2
$85,345
12
$66,992
1
$11,010
1
$42,210
0
$0
APPLICATIONS DENIED
0
$0
2
$66,990
38
$83,350
13
$26,731
2
$116,550
6
$34,260
APPLICATIONS WITHDRAWN
0
$0
3
$28,753
22
$87,320
4
$90,240
1
$63,020
0
$0
FILES CLOSED FOR INCOMPLETENESS
0
$0
1
$124,810
9
$102,034
0
$0
1
$76,470
0
$0
Aggregated Statistics For Year 2004 (Based on 2 partial tracts)
A) FHA, FSA/RHS & VA Home Purchase Loans
B) Conventional Home Purchase Loans
C) Refinancings
D) Home Improvement Loans
F) Non-occupant Loans on < 5 Family Dwellings (A B C & D)
G) Loans On Manufactured Home Dwelling (A B C & D)
Number
Average Value
Number
Average Value
Number
Average Value
Number
Average Value
Number
Average Value
Number
Average Value
LOANS ORIGINATED
7
$62,840
10
$78,677
28
$67,560
16
$19,692
1
$102,170
6
$56,592
APPLICATIONS APPROVED, NOT ACCEPTED
0
$0
1
$39,160
13
$66,592
1
$17,740
0
$0
2
$38,235
APPLICATIONS DENIED
2
$54,755
4
$57,358
45
$65,259
24
$28,551
2
$16,215
4
$61,332
APPLICATIONS WITHDRAWN
0
$0
2
$47,415
15
$53,186
2
$51,695
0
$0
0
$0
FILES CLOSED FOR INCOMPLETENESS
0
$0
1
$29,370
7
$88,624
2
$42,825
1
$15,300
0
$0
Aggregated Statistics For Year 2003 (Based on 2 partial tracts)
A) FHA, FSA/RHS & VA Home Purchase Loans
B) Conventional Home Purchase Loans
C) Refinancings
D) Home Improvement Loans
F) Non-occupant Loans on < 5 Family Dwellings (A B C & D)
Number
Average Value
Number
Average Value
Number
Average Value
Number
Average Value
Number
Average Value
LOANS ORIGINATED
8
$72,040
17
$61,900
43
$72,121
20
$17,498
2
$110,125
APPLICATIONS APPROVED, NOT ACCEPTED
1
$91,160
2
$72,190
7
$76,650
4
$19,118
0
$0
APPLICATIONS DENIED
0
$0
5
$45,518
51
$71,113
22
$18,882
1
$48,940
APPLICATIONS WITHDRAWN
1
$99,720
1
$59,960
13
$69,557
1
$31,200
1
$61,790
FILES CLOSED FOR INCOMPLETENESS
0
$0
1
$83,820
1
$123,580
0
$0
0
$0
Aggregated Statistics For Year 2002 (Based on 2 partial tracts)
A) FHA, FSA/RHS & VA Home Purchase Loans
B) Conventional Home Purchase Loans
C) Refinancings
D) Home Improvement Loans
F) Non-occupant Loans on < 5 Family Dwellings (A B C & D)
Number
Average Value
Number
Average Value
Number
Average Value
Number
Average Value
Number
Average Value
LOANS ORIGINATED
7
$83,641
23
$71,660
32
$59,631
15
$13,501
2
$128,480
APPLICATIONS APPROVED, NOT ACCEPTED
0
$0
0
$0
7
$63,366
1
$18,350
0
$0
APPLICATIONS DENIED
1
$47,720
7
$56,636
26
$54,780
9
$14,548
1
$19,580
APPLICATIONS WITHDRAWN
1
$33,040
2
$67,300
20
$56,714
2
$23,555
0
$0
FILES CLOSED FOR INCOMPLETENESS
0
$0
0
$0
3
$55,470
1
$28,140
1
$6,120
Aggregated Statistics For Year 2001 (Based on 2 partial tracts)
A) FHA, FSA/RHS & VA Home Purchase Loans
B) Conventional Home Purchase Loans
C) Refinancings
D) Home Improvement Loans
F) Non-occupant Loans on < 5 Family Dwellings (A B C & D)
Number
Average Value
Number
Average Value
Number
Average Value
Number
Average Value
Number
Average Value
LOANS ORIGINATED
6
$60,977
15
$64,525
27
$66,052
18
$15,669
1
$31,810
APPLICATIONS APPROVED, NOT ACCEPTED
0
$0
2
$38,235
4
$62,098
2
$57,510
0
$0
APPLICATIONS DENIED
2
$42,215
10
$49,433
32
$53,188
7
$15,731
2
$32,730
APPLICATIONS WITHDRAWN
0
$0
0
$0
23
$60,807
2
$16,215
0
$0
FILES CLOSED FOR INCOMPLETENESS
0
$0
0
$0
4
$57,510
0
$0
0
$0
Aggregated Statistics For Year 2000 (Based on 2 partial tracts)
A) FHA, FSA/RHS & VA Home Purchase Loans
B) Conventional Home Purchase Loans
C) Refinancings
D) Home Improvement Loans
F) Non-occupant Loans on < 5 Family Dwellings (A B C & D)
Number
Average Value
Number
Average Value
Number
Average Value
Number
Average Value
Number
Average Value
LOANS ORIGINATED
7
$59,083
15
$52,697
17
$44,734
12
$11,879
2
$28,755
APPLICATIONS APPROVED, NOT ACCEPTED
1
$31,200
7
$59,083
8
$48,102
1
$6,730
0
$0
APPLICATIONS DENIED
1
$56,290
18
$43,812
25
$42,190
6
$22,025
2
$20,495
APPLICATIONS WITHDRAWN
1
$44,660
4
$45,732
8
$43,896
1
$53,840
1
$16,520
FILES CLOSED FOR INCOMPLETENESS
0
$0
0
$0
6
$47,822
0
$0
0
$0
Aggregated Statistics For Year 1999 (Based on 1 partial tract)
A) FHA, FSA/RHS & VA Home Purchase Loans
B) Conventional Home Purchase Loans
C) Refinancings
D) Home Improvement Loans
F) Non-occupant Loans on < 5 Family Dwellings (A B C & D)


 Nearest zip codes: 14884, 14517, 14822, 14846, 14437, 14510.


