Estimated zip code population in 2022: 5,158 Zip code population in 2010: 5,569 Zip code population in 2000: 5,430
Houses and condos: 2,545 Renter-occupied apartments: 605
% of renters here:
25%
State:
46%
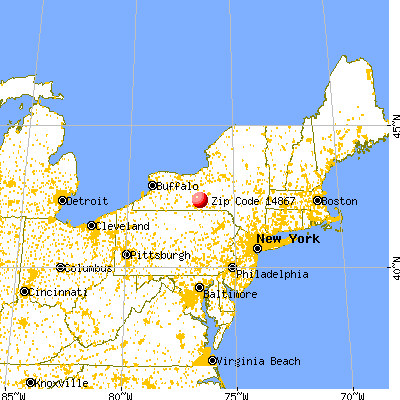
March 2022 cost of living index in zip code 14867: 95.5 (near average, U.S. average is 100)
Land area: 67.1 sq. mi. Water area: 0.1 sq. mi.
Population density: 77 people per square mile
(very low).
OSM Map
General Map
Google Map
MSN Map
OSM Map
General Map
Google Map
MSN Map
OSM Map
General Map
Google Map
MSN Map
OSM Map
General Map
Google Map
MSN Map
Please wait while loading the map...
Real estate property taxes paid for housing units in 2022:
This zip code:
2.1% ($3,664)
New York:
1.5% ($6,180)
Median real estate property taxes paid for housing units with mortgages in 2022: $4,162 (2.2%) Median real estate property taxes paid for housing units with no mortgage in 2022: $3,330 (2.3%)
Business Search- 14 Million verified businesses
Males: 2,601
(50.4%)
Females: 2,557
(49.6%)
For population 25 years and over in 14867:
High school or higher: 93.3%
Bachelor's degree or higher: 30.0%
Graduate or professional degree: 12.1%
Unemployed: 3.7%
Mean travel time to work (commute): 26.8 minutes
For population 15 years and over in 14867:
Never married: 27.8%
Now married: 51.8%
Separated: 1.2%
Widowed: 5.1%
Divorced: 14.1%
Zip code 14867 compared to state average:
Median house value significantly below state average.
Black race population percentage significantly below state average.
Hispanic race population percentage significantly below state average.
Median age above state average.
Foreign-born population percentage significantly below state average.
Renting percentage below state average.
Length of stay since moving in significantly above state average.
House age below state average.
Number of college students significantly below state average.
Averages for the 2020 tax year for zip code 14867, filed in 2021:
Average Adjusted Gross Income (AGI) in 2020: $53,903 (Individual Income Tax Returns)
Here:
$53,903
State:
$90,930
Salary/wage: $45,147 (reported on 81.0% of returns)
Here:
$45,147
State:
$72,104
(% of AGI for various income ranges: 1049.5% for AGIs below $25k, 3286.5% for AGIs $25k-50k, 5926.2% for AGIs $50k-75k, 8168.9% for AGIs $75k-100k, 14643.0% for AGIs $100k-200k)
Taxable interest for individuals: $644 (reported on 33.0% of returns)
This zip code:
$644
New York:
$3,075
(% of AGI for various income ranges: 11.8% for AGIs below $25k, 21.2% for AGIs $25k-50k, 23.1% for AGIs $50k-75k, 26.7% for AGIs $75k-100k, 85.5% for AGIs $100k-200k)
Ordinary dividends: $3,442 (reported on 14.7% of returns)
Here:
$3,442
State:
$11,095
(% of AGI for various income ranges: 12.2% for AGIs below $25k, 25.1% for AGIs $25k-50k, 70.0% for AGIs $50k-75k, 155.6% for AGIs $75k-100k, 225.5% for AGIs $100k-200k)
Net capital gain/loss in AGI: +$10,894 (reported on 11.7% of returns)
Here:
+$10,894
State:
+$44,925
(% of AGI for various income ranges: 8.2% for AGIs below $25k, 17.0% for AGIs $25k-50k, 64.4% for AGIs $50k-75k, 238.9% for AGIs $75k-100k, 503.5% for AGIs $100k-200k)
Profit/loss from business: +$10,536 (reported on 12.1% of returns)
Here:
+$10,536
State:
+$14,940
(% of AGI for various income ranges: 90.3% for AGIs below $25k, 108.3% for AGIs $25k-50k, 153.1% for AGIs $50k-75k, 155.0% for AGIs $75k-100k, 687.0% for AGIs $100k-200k)
Taxable individual retirement arrangement distribution: $15,471 (reported on 8.8% of returns)
14867:
$15,471
New York:
$19,609
(% of AGI for various income ranges: 47.7% for AGIs below $25k, 79.3% for AGIs $25k-50k, 150.0% for AGIs $50k-75k, 491.7% for AGIs $75k-100k, 745.5% for AGIs $100k-200k)
Total itemized deductions: $24,040 (reported on 3.7% of returns)
Here:
$24,040
State:
$39,326
(% of AGI for various income ranges: 69.4% for AGIs below $25k, 119.1% for AGIs $50k-75k, 329.4% for AGIs $75k-100k, 489.5% for AGIs $100k-200k)
Charity contributions: $6,200 (reported on 2.6% of returns)
Here:
$6,200
State:
$15,420
(% of AGI for various income ranges: 61.9% for AGIs $50k-75k, 118.0% for AGIs $100k-200k)
Taxes paid: $8,578 (reported on 3.3% of returns)
14867:
$8,578
State:
$9,183
(% of AGI for various income ranges: 16.5% for AGIs below $25k, 52.2% for AGIs $50k-75k, 99.4% for AGIs $75k-100k, 159.5% for AGIs $100k-200k)
Earned income credit: $2,210 (reported on 17.6% of returns)
Here:
$2,210
State:
$2,138
(% of AGI for various income ranges: 97.5% for AGIs below $25k, 61.9% for AGIs $25k-50k)
Percentage of individuals using paid preparers for their 2020 taxes: 95.6%
Here:
96%
State:
95%
(% for various income ranges: 94.1% for AGIs below $25k, 96.4% for AGIs $25k-50k, 95.2% for AGIs $50k-75k, 96.2% for AGIs $75k-100k, 96.9% for AGIs $100k-200k, 100.0% for AGIs over 200k)
Averages for the 2012 tax year for zip code 14867, filed in 2013:
Average Adjusted Gross Income (AGI) in 2012: $45,360 (Individual Income Tax Returns)
Here:
$45,360
State:
$77,088
Salary/wage: $40,062 (reported on 83.6% of returns)
Here:
$40,062
State:
$60,593
(% of AGI for various income ranges: 72.4% for AGIs below $25k, 80.4% for AGIs $25k-50k, 76.5% for AGIs $50k-75k, 76.1% for AGIs $75k-100k, 78.6% for AGIs $100k-200k, 41.4% for AGIs over 200k)
Taxable interest for individuals: $606 (reported on 37.7% of returns)
This zip code:
$606
New York:
$3,125
(% of AGI for various income ranges: 1.4% for AGIs below $25k, 0.5% for AGIs $25k-50k, 0.4% for AGIs $50k-75k, 0.4% for AGIs $75k-100k, 0.4% for AGIs $100k-200k, 0.1% for AGIs over 200k)
Ordinary dividends: $2,186 (reported on 15.7% of returns)
Here:
$2,186
State:
$10,299
(% of AGI for various income ranges: 1.1% for AGIs below $25k, 0.8% for AGIs $25k-50k, 0.6% for AGIs $50k-75k, 0.6% for AGIs $75k-100k, 0.5% for AGIs $100k-200k, 1.5% for AGIs over 200k)
Net capital gain/loss in AGI: +$8,293 (reported on 10.4% of returns)
Here:
+$8,293
State:
+$42,474
(% of AGI for various income ranges: 0.3% for AGIs below $25k, 0.1% for AGIs $25k-50k, 0.2% for AGIs $50k-75k, 0.3% for AGIs $75k-100k, 8.9% for AGIs $100k-200k)
Profit/loss from business: +$12,926 (reported on 14.2% of returns)
Here:
+$12,926
State:
+$16,168
(% of AGI for various income ranges: 6.5% for AGIs below $25k, 3.2% for AGIs $25k-50k, 3.3% for AGIs $50k-75k, 1.4% for AGIs $75k-100k, 8.7% for AGIs $100k-200k)
Taxable individual retirement arrangement distribution: $12,562 (reported on 9.0% of returns)
14867:
$12,562
New York:
$17,621
(% of AGI for various income ranges: 3.0% for AGIs below $25k, 1.6% for AGIs $25k-50k, 2.6% for AGIs $50k-75k, 1.6% for AGIs $75k-100k, 5.1% for AGIs $100k-200k)
Self-employment retirement plans: $15,050 (reported on 0.7% of returns)
14867:
$15,050
New York:
$27,330
Total itemized deductions: $18,021 (20% of AGI, reported on 22.8% of returns)
Here:
$18,021
State:
$34,985
Here:
19.8% of AGI
State:
21.3% of AGI
(% of AGI for various income ranges: 4.4% for AGIs below $25k, 6.1% for AGIs $25k-50k, 8.9% for AGIs $50k-75k, 10.1% for AGIs $75k-100k, 13.2% for AGIs $100k-200k, 11.1% for AGIs over 200k)
Charity contributions: $2,505 (reported on 15.7% of returns)
Here:
$2,505
State:
$5,572
(% of AGI for various income ranges: 0.3% for AGIs below $25k, 0.5% for AGIs $25k-50k, 0.7% for AGIs $50k-75k, 1.1% for AGIs $75k-100k, 1.4% for AGIs $100k-200k, 1.1% for AGIs over 200k)
Taxes paid: $8,769 (reported on 22.8% of returns)
14867:
$8,769
State:
$18,656
(% of AGI for various income ranges: 1.0% for AGIs below $25k, 2.7% for AGIs $25k-50k, 3.5% for AGIs $50k-75k, 4.7% for AGIs $75k-100k, 7.6% for AGIs $100k-200k, 7.2% for AGIs over 200k)
Earned income credit: $2,057 (reported on 19.0% of returns)
Here:
$2,057
State:
$2,230
(% of AGI for various income ranges: 5.8% for AGIs below $25k, 1.1% for AGIs $25k-50k)
Percentage of individuals using paid preparers for their 2012 taxes: 42.9%
Here:
43%
State:
66%
(% for various income ranges: 37.1% for AGIs below $25k, 39.7% for AGIs $25k-50k, 51.2% for AGIs $50k-75k, 54.5% for AGIs $75k-100k, 52.6% for AGIs $100k-200k, 66.7% for AGIs over 200k)
Averages for the 2004 tax year for zip code 14867, filed in 2005:
Average Adjusted Gross Income (AGI) in 2004: $37,745 (Individual Income Tax Returns)
Here:
$37,745
State:
$59,519
Salary/wage: $33,705 (reported on 87.0% of returns)
Here:
$33,705
State:
$50,673
(% of AGI for various income ranges: 92.7% for AGIs below $10k, 78.9% for AGIs $10k-25k, 85.2% for AGIs $25k-50k, 82.0% for AGIs $50k-75k, 86.9% for AGIs $75k-100k, 52.2% for AGIs over 100k)
Taxable interest for individuals: $773 (reported on 46.3% of returns)
This zip code:
$773
New York:
$2,377
(% of AGI for various income ranges: 2.9% for AGIs below $10k, 1.6% for AGIs $10k-25k, 0.6% for AGIs $25k-50k, 1.0% for AGIs $50k-75k, 0.5% for AGIs $75k-100k, 1.0% for AGIs over 100k)
Taxable dividends: $2,264 (reported on 18.2% of returns)
Here:
$2,264
State:
$5,394
(% of AGI for various income ranges: 2.4% for AGIs below $10k, 0.5% for AGIs $10k-25k, 0.4% for AGIs $25k-50k, 0.7% for AGIs $50k-75k, 0.4% for AGIs $75k-100k, 3.3% for AGIs over 100k)
Net capital gain/loss: +$3,831 (reported on 12.3% of returns)
Here:
+$3,831
State:
+$23,581
(% of AGI for various income ranges: 0.3% for AGIs below $10k, 0.3% for AGIs $10k-25k, 0.2% for AGIs $25k-50k, 1.3% for AGIs $50k-75k, 0.8% for AGIs $75k-100k, 3.8% for AGIs over 100k)
Profit/loss from business: +$6,780 (reported on 14.6% of returns)
Here:
+$6,780
State:
+$13,809
(% of AGI for various income ranges: 4.3% for AGIs below $10k, 5.3% for AGIs $10k-25k, 2.7% for AGIs $25k-50k, 2.5% for AGIs $50k-75k, 0.9% for AGIs $75k-100k, 2.0% for AGIs over 100k)
IRA payment deduction: $2,750 (reported on 2.7% of returns)
14867:
$2,750
New York:
$3,115
Self-employed pension: $7,071 (reported on 0.5% of returns)
Here:
$7,071
New York:
$19,016
Total itemized deductions: $14,487 (19% of AGI, reported on 22.3% of returns)
Here:
$14,487
State:
$25,864
Here:
19.1% of AGI
State:
21.9% of AGI
(% of AGI for various income ranges: 11.7% for AGIs below $10k, 4.6% for AGIs $10k-25k, 6.7% for AGIs $25k-50k, 8.8% for AGIs $50k-75k, 10.6% for AGIs $75k-100k, 11.6% for AGIs over 100k)
Charity contributions deductions: $1,876 (2% of AGI, reported on 17.7% of returns)
Here:
$1,876
State:
$4,439
Here:
2.3% of AGI
State:
3.6% of AGI
(% of AGI for various income ranges: 0.4% for AGIs $10k-25k, 0.7% for AGIs $25k-50k, 1.0% for AGIs $50k-75k, 1.1% for AGIs $75k-100k, 1.2% for AGIs over 100k)
Total tax: $4,250 (reported on 75.7% of returns)
14867:
$4,250
State:
$11,730
(% of AGI for various income ranges: 2.5% for AGIs below $10k, 4.8% for AGIs $10k-25k, 7.1% for AGIs $25k-50k, 9.0% for AGIs $50k-75k, 10.7% for AGIs $75k-100k, 11.3% for AGIs over 100k)
Earned income credit: $1,651 (reported on 18.6% of returns)
Here:
$1,651
State:
$1,757
Percentage of individuals using paid preparers for their 2004 taxes: 51.8%
Here:
52%
State:
67%
(% for various income ranges: 46.8% for AGIs below $10k, 53.4% for AGIs $10k-25k, 49.9% for AGIs $25k-50k, 52.7% for AGIs $50k-75k, 58.8% for AGIs $75k-100k, 67.7% for AGIs over 100k)
Likely homosexual households (counted as self-reported same-sex unmarried-partner households)
Lesbian couples: 0.4% of all households
Gay men: 0.0% of all households
Household received Food Stamps/SNAP in the past 12 months: 420 Household did not receive Food Stamps/SNAP in the past 12 months: 2,021
Women who had a birth in the past 12 months: 74 (73 now married, 0 unmarried) Women who did not have a birth in the past 12 months: 1,021 (380 now married, 639 unmarried)
Housing units in zip code 14867 with a mortgage: 852 (101 second mortgage, 61 both second mortgage and home equity loan) Houses without a mortgage: 56
Median monthly owner costs for units with a mortgage: $1,410 Median monthly owner costs for units without a mortgage: $559
Residents with income below the poverty level in 2022:
This zip code:
7.0%
Whole state:
14.3%
Residents with income below 50% of the poverty level in 2022:
This zip code:
3.5%
Whole state:
6.8%
Median number of rooms in houses and condos:
Here:
6.2
State:
6.3
Median number of rooms in apartments:
Here:
4.1
State:
3.8
Notable locations in this zip code not listed on our city pages
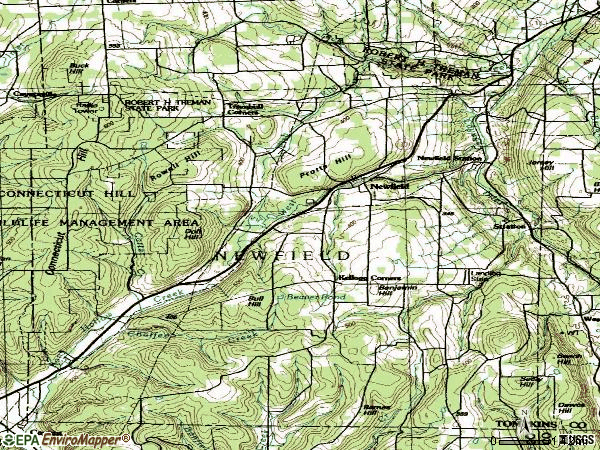
Notable locations in zip code 14867: Kellogg Corners (A), Newfield Station (B), Stoneybrook Farm (C), Littletree Orchards (D), Indian Creek Fruit Farm (E), Pinecreek Campground (F), Newfield Public Library (G), Newfield Town Hall (H). Display/hide their locations on the map
Churches in zip code 14867 include: First Baptist Church (A), Newfield United Methodist Church (B), Peoples Baptist Church (C), Trumbulls Corners Community Church (D). Display/hide their locations on the map
Cemeteries: Sebring Cemetery (1), Turnbulls Corners Cemetery (2), Chaffee Creek Cemetery (3), Hine Family Cemetery (4), Old Newfield Village Cemetery (5), Estabrook Cemetery (6), Connecticut Hill Cemetery (7). Display/hide their locations on the map
386 married couples with children.
655 single-parent households (115 men, 540 women).
99.2% of residents of 14867 zip code speak English at home.
0.4% of residents speak other Indo-European language at home (68% very well, 32% not well).
0.3% of residents speak other language at home (100% very well).
Foreign born population: 59 (1.2%) (61.2% of them are naturalized citizens)
This zip code:
1.2%
Whole state:
22.7%
37%Serbia
25%Czechoslovakia (includes Czech Republic and Slovakia)
7%Germany
16%German
14%English
13%Irish
13%American
10%Italian
7%European
6%Dutch
Year of entry for the foreign-born population
02010 or later
222000 to 2009
191990 to 1999
14Before 1990
Facilities with environmental interests located in this zip code:
HARBERT DIANE (107 BURDGE HILL RD in NEWFIELD, NY)
(Resource Conservation and Recovery Act (tracking hazardous waste))
ITHACA RECREATION SPORTS (1906 ELMIRA ROAD in NEWFIELD, NY)
ENFORCEMENT/COMPLIANCE ACTIVITY (Integrated Compliance Information System)
28.2%Bottled, tank, or LP gas
20.7%Utility gas
17.0%Electricity
16.7%Fuel oil, kerosene, etc.
10.8%Wood
3.3%Other fuel
2.4%Coal or coke
0.6%Solar energy
0.6%No fuel used
Population in 1990: 5,311. Population change in the 1990s: +119 (+2.2%).
Place of birth for U.S.-born residents:
This state: 4,166
Northeast: 471
Midwest: 207
South: 165
West: 79
52% of the 14867 zip code residents lived in the same house 5 years ago. Out of people who lived in different houses, 64% lived in this county. Out of people who lived in different counties, 50% lived in New York.
92% of the 14867 zip code residents lived in the same house 1 year ago. Out of people who lived in different houses, 39% moved from this county. Out of people who lived in different houses, 31% moved from different county within same state. Out of people who lived in different houses, 21% moved from different state. Out of people who lived in different houses, 11% moved from abroad.
Private vs. public school enrollment:
Students in private schools in grades 1 to 8 (elementary and middle school): 61
Here:
12.2%
New York:
15.6%
Students in private schools in grades 9 to 12 (high school):
Here:
0.0%
New York:
15.0%
Students in private undergraduate colleges: 30
Here:
100.0%
New York:
39.2%
Occupation by median earnings in the past 12 months ($)
97,439Architecture and engineering occupations
68,627Health diagnosing and treating practitioners and other technical occupations
64,928Installation, maintenance, and repair occupations
55,750Management occupations
45,938Arts, design, entertainment, sports, and media occupations
44,851Production occupations
Companies with federal contracts located in this zip code:
SUPERIOR DISPOSAL SERVICE INC (1180 ELMIRA RD in NEWFIELD, NY; small business) : $45,896 in 6 contractsfrom 2003 to 2005
Contracts for Trash/Garbage Collection Services - Including Portable Sanitation Services by Bureau of Prisoners/Federal Prison System, Army Signed by year:2000: $0; 2001: $0; 2002: $0; 2003: $2,819; 2004: $40,874; 2005: $2,203; 2006: $0.
Biggest contracts:
$38,000 with Bureau of Prisoners/Federal Prison System for Trash/Garbage Collection Services - Including Portable Sanitation Services. Signed on 2004-10-25. Effective on 2004-10-01. Completion date: 2005-02-06.
$2,904 with Army for Trash/Garbage Collection Services - Including Portable Sanitation Services. Signed on 2005-03-29. Completion date: 2004-04-30.
$2,874, same as above.Signed on 2004-05-01. Completion date: 2004-04-30.
$2,819, same as above.Signed on 2003-06-12. Completion date: 2004-04-30.
Top industries in this zip code by the number of employees in 2005:
Administrative and Support and Waste Management and Remediation Services: Solid Waste Collection (50-99 employees: 1 establishment)
Information: Software Publishers (20-49: 1)
Real Estate and Rental and Leasing: Lessors of Other Real Estate Property (5-9: 1, 1-4: 1)
Construction: New Single-Family Housing Construction (except Operative Builders) (1-4: 4)
Construction: Poured Concrete Foundation and Structure Contractors (5-9: 1)
Finance and Insurance: Commercial Banking (5-9: 1)
Fatal accident statistics in 2013:
Fatal accident count: 3
Vehicles involved in fatal accidents: 5
Fatal accidents caused by drunken drivers: 0
Fatalities: 4
Persons involved in fatal accidents: 10
Pedestrians involved in fatal accidents: 0
Fatal accident statistics in 2012:
Fatal accident count: 2
Vehicles involved in fatal accidents: 3
Fatal accidents caused by drunken drivers: 1
Fatalities: 4
Persons involved in fatal accidents: 5
Pedestrians involved in fatal accidents: 0
Home Mortgage Disclosure Act Aggregated Statistics For Year 2009 (Based on 6 partial tracts)
A) FHA, FSA/RHS & VA Home Purchase Loans
B) Conventional Home Purchase Loans
C) Refinancings
D) Home Improvement Loans
E) Loans on Dwellings For 5+ Families
F) Non-occupant Loans on < 5 Family Dwellings (A B C & D)
G) Loans On Manufactured Home Dwelling (A B C & D)
Number
Average Value
Number
Average Value
Number
Average Value
Number
Average Value
Number
Average Value
Number
Average Value
Number
Average Value
LOANS ORIGINATED
35
$139,777
74
$109,847
128
$114,030
69
$37,794
1
$135,360
13
$162,057
45
$67,876
APPLICATIONS APPROVED, NOT ACCEPTED
0
$0
2
$76,955
10
$102,696
2
$13,665
0
$0
0
$0
5
$52,712
APPLICATIONS DENIED
0
$0
24
$73,156
57
$110,256
32
$18,319
2
$199,150
2
$99,460
28
$45,424
APPLICATIONS WITHDRAWN
0
$0
7
$113,229
22
$126,088
3
$110,317
0
$0
0
$0
4
$45,075
FILES CLOSED FOR INCOMPLETENESS
3
$117,850
0
$0
2
$83,140
0
$0
0
$0
0
$0
3
$105,473
Aggregated Statistics For Year 2008 (Based on 6 partial tracts)
A) FHA, FSA/RHS & VA Home Purchase Loans
B) Conventional Home Purchase Loans
C) Refinancings
D) Home Improvement Loans
E) Loans on Dwellings For 5+ Families
F) Non-occupant Loans on < 5 Family Dwellings (A B C & D)
G) Loans On Manufactured Home Dwelling (A B C & D)
Number
Average Value
Number
Average Value
Number
Average Value
Number
Average Value
Number
Average Value
Number
Average Value
Number
Average Value
LOANS ORIGINATED
8
$131,611
80
$116,043
89
$108,870
52
$24,992
3
$749,153
22
$98,793
35
$56,305
APPLICATIONS APPROVED, NOT ACCEPTED
2
$75,070
10
$91,377
10
$84,591
1
$30,290
0
$0
1
$100,200
8
$94,822
APPLICATIONS DENIED
0
$0
14
$88,927
66
$116,211
60
$32,480
0
$0
7
$93,971
27
$59,193
APPLICATIONS WITHDRAWN
0
$0
3
$140,940
25
$85,631
8
$37,918
0
$0
0
$0
4
$60,958
FILES CLOSED FOR INCOMPLETENESS
0
$0
0
$0
5
$155,952
0
$0
0
$0
0
$0
2
$78,300
Aggregated Statistics For Year 2007 (Based on 6 partial tracts)
A) FHA, FSA/RHS & VA Home Purchase Loans
B) Conventional Home Purchase Loans
C) Refinancings
D) Home Improvement Loans
E) Loans on Dwellings For 5+ Families
F) Non-occupant Loans on < 5 Family Dwellings (A B C & D)
G) Loans On Manufactured Home Dwelling (A B C & D)
Number
Average Value
Number
Average Value
Number
Average Value
Number
Average Value
Number
Average Value
Number
Average Value
Number
Average Value
LOANS ORIGINATED
1
$152,450
135
$116,280
153
$94,283
74
$31,849
2
$158,125
36
$107,191
48
$44,669
APPLICATIONS APPROVED, NOT ACCEPTED
0
$0
11
$89,570
22
$102,478
6
$24,863
0
$0
8
$108,148
2
$23,695
APPLICATIONS DENIED
2
$127,540
30
$84,156
78
$108,124
46
$31,505
0
$0
19
$82,267
23
$44,083
APPLICATIONS WITHDRAWN
0
$0
4
$116,532
40
$103,642
7
$52,273
0
$0
2
$118,285
3
$38,417
FILES CLOSED FOR INCOMPLETENESS
0
$0
6
$124,103
9
$145,503
2
$60,540
0
$0
0
$0
0
$0
Aggregated Statistics For Year 2006 (Based on 6 partial tracts)
A) FHA, FSA/RHS & VA Home Purchase Loans
B) Conventional Home Purchase Loans
C) Refinancings
D) Home Improvement Loans
F) Non-occupant Loans on < 5 Family Dwellings (A B C & D)
G) Loans On Manufactured Home Dwelling (A B C & D)
Number
Average Value
Number
Average Value
Number
Average Value
Number
Average Value
Number
Average Value
Number
Average Value
LOANS ORIGINATED
6
$112,017
121
$112,997
143
$73,252
112
$25,310
32
$102,009
50
$50,290
APPLICATIONS APPROVED, NOT ACCEPTED
0
$0
10
$106,984
26
$104,432
9
$28,766
3
$105,340
3
$64,473
APPLICATIONS DENIED
3
$129,690
23
$78,388
130
$92,259
108
$31,121
12
$88,628
46
$38,882
APPLICATIONS WITHDRAWN
0
$0
8
$142,441
80
$96,058
13
$58,968
3
$132,400
4
$35,368
FILES CLOSED FOR INCOMPLETENESS
0
$0
6
$123,515
16
$148,382
2
$32,290
2
$134,420
0
$0
Aggregated Statistics For Year 2005 (Based on 6 partial tracts)
A) FHA, FSA/RHS & VA Home Purchase Loans
B) Conventional Home Purchase Loans
C) Refinancings
D) Home Improvement Loans
E) Loans on Dwellings For 5+ Families
F) Non-occupant Loans on < 5 Family Dwellings (A B C & D)
G) Loans On Manufactured Home Dwelling (A B C & D)
Number
Average Value
Number
Average Value
Number
Average Value
Number
Average Value
Number
Average Value
Number
Average Value
Number
Average Value
LOANS ORIGINATED
5
$101,146
127
$99,957
147
$95,861
77
$34,921
1
$124,860
27
$103,745
54
$48,641
APPLICATIONS APPROVED, NOT ACCEPTED
3
$112,470
7
$102,674
32
$87,454
8
$47,795
0
$0
1
$147,630
8
$57,172
APPLICATIONS DENIED
0
$0
38
$65,387
138
$103,311
63
$33,545
0
$0
13
$43,703
47
$45,071
APPLICATIONS WITHDRAWN
0
$0
7
$128,939
79
$108,478
5
$78,348
0
$0
0
$0
10
$97,327
FILES CLOSED FOR INCOMPLETENESS
0
$0
2
$109,980
20
$121,829
2
$42,025
2
$68,610
0
$0
0
$0
Aggregated Statistics For Year 2004 (Based on 6 partial tracts)
A) FHA, FSA/RHS & VA Home Purchase Loans
B) Conventional Home Purchase Loans
C) Refinancings
D) Home Improvement Loans
E) Loans on Dwellings For 5+ Families
F) Non-occupant Loans on < 5 Family Dwellings (A B C & D)
G) Loans On Manufactured Home Dwelling (A B C & D)
2002 - 2018 National Fire Incident Reporting System (NFIRS) incidents
According to the data from the years 2002 - 2018 the average number of fires per year is 6. The highest number of reported fire incidents - 23 took place in 2003, and the least - 0 in 2009. The data has a decreasing trend.
When looking into fire subcategories, the most reports belonged to: Structure Fires (55.4%), and Mobile Property/Vehicle Fires (16.8%).
Fire incident types reported to NFIRS in Zip Code 14867


 Nearest zip codes: 14805, 14889, 14824, 14850, 14869, 14838.


 According to the data from the years 2002 - 2018 the average number of fires per year is 6. The highest number of reported fire incidents - 23 took place in 2003, and the least - 0 in 2009. The data has a decreasing trend.
 When looking into fire subcategories, the most reports belonged to: Structure Fires (55.4%), and Mobile Property/Vehicle Fires (16.8%).