Estimated zip code population in 2022: 1,447 Zip code population in 2010: 1,378 Zip code population in 2000: 1,435
Houses and condos: 609 Renter-occupied apartments: 186
% of renters here:
33%
State:
46%
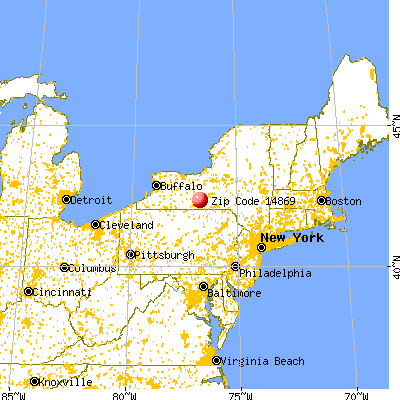
March 2022 cost of living index in zip code 14869: 94.2 (less than average, U.S. average is 100)
Land area: 20.2 sq. mi. Water area: 0.0 sq. mi.
Population density: 72 people per square mile
(very low).
OSM Map
General Map
Google Map
MSN Map
OSM Map
General Map
Google Map
MSN Map
OSM Map
General Map
Google Map
MSN Map
OSM Map
General Map
Google Map
MSN Map
Please wait while loading the map...
Real estate property taxes paid for housing units in 2022:
This zip code:
2.2% ($3,258)
New York:
1.5% ($6,180)
Median real estate property taxes paid for housing units with mortgages in 2022: $3,450 (2.0%) Median real estate property taxes paid for housing units with no mortgage in 2022: $3,012 (2.2%)
Averages for the 2020 tax year for zip code 14869, filed in 2021:
Average Adjusted Gross Income (AGI) in 2020: $52,960 (Individual Income Tax Returns)
Here:
$52,960
State:
$90,930
Salary/wage: $45,569 (reported on 80.0% of returns)
Here:
$45,569
State:
$72,104
(% of AGI for various income ranges: 1065.8% for AGIs below $25k, 3318.6% for AGIs $25k-50k, 5742.5% for AGIs $50k-75k, 9088.0% for AGIs $75k-100k, 13620.0% for AGIs $100k-200k)
Taxable interest for individuals: $318 (reported on 28.3% of returns)
This zip code:
$318
New York:
$3,075
(% of AGI for various income ranges: 7.5% for AGIs below $25k, 3.6% for AGIs $25k-50k, 2.5% for AGIs $50k-75k, 34.0% for AGIs $75k-100k, 42.0% for AGIs $100k-200k)
Ordinary dividends: $978 (reported on 15.0% of returns)
Here:
$978
State:
$11,095
(% of AGI for various income ranges: 15.8% for AGIs below $25k, 40.0% for AGIs $50k-75k, 74.0% for AGIs $100k-200k)
Net capital gain/loss in AGI: +$1,900 (reported on 10.0% of returns)
Here:
+$1,900
State:
+$44,925
(% of AGI for various income ranges: 65.0% for AGIs $25k-50k, 46.0% for AGIs $75k-100k)
Profit/loss from business: +$10,962 (reported on 13.3% of returns)
Here:
+$10,962
State:
+$14,940
(% of AGI for various income ranges: 156.7% for AGIs below $25k, 270.0% for AGIs $50k-75k, 946.0% for AGIs $100k-200k)
Taxable individual retirement arrangement distribution: $15,117 (reported on 10.0% of returns)
14869:
$15,117
New York:
$19,609
(% of AGI for various income ranges: 327.1% for AGIs $25k-50k, 898.0% for AGIs $75k-100k)
Earned income credit: $2,057 (reported on 11.7% of returns)
Here:
$2,057
State:
$2,138
(% of AGI for various income ranges: 65.8% for AGIs below $25k, 46.4% for AGIs $25k-50k)
Percentage of individuals using paid preparers for their 2020 taxes: 95.0%
Here:
95%
State:
95%
(% for various income ranges: 94.4% for AGIs below $25k, 94.1% for AGIs $25k-50k, 100.0% for AGIs $50k-75k, 100.0% for AGIs $75k-100k, 87.5% for AGIs $100k-200k)
Averages for the 2012 tax year for zip code 14869, filed in 2013:
Average Adjusted Gross Income (AGI) in 2012: $43,121 (Individual Income Tax Returns)
Here:
$43,121
State:
$77,088
Salary/wage: $36,085 (reported on 87.3% of returns)
Here:
$36,085
State:
$60,593
(% of AGI for various income ranges: 78.2% for AGIs below $25k, 77.5% for AGIs $25k-50k, 76.5% for AGIs $50k-75k, 82.4% for AGIs $75k-100k, 58.1% for AGIs $100k-200k)
Taxable interest for individuals: $590 (reported on 33.3% of returns)
This zip code:
$590
New York:
$3,125
(% of AGI for various income ranges: 1.2% for AGIs below $25k, 0.7% for AGIs $25k-50k, 0.3% for AGIs $50k-75k, 0.2% for AGIs $75k-100k, 0.2% for AGIs $100k-200k)
Ordinary dividends: $967 (reported on 14.3% of returns)
Here:
$967
State:
$10,299
(% of AGI for various income ranges: 0.9% for AGIs below $25k, 0.3% for AGIs $25k-50k, 0.3% for AGIs $50k-75k, 0.5% for AGIs $75k-100k)
Net capital gain/loss in AGI: +$1,750 (reported on 9.5% of returns)
Here:
+$1,750
State:
+$42,474
Profit/loss from business: +$6,912 (reported on 12.7% of returns)
Here:
+$6,912
State:
+$16,168
Taxable individual retirement arrangement distribution: $11,900 (reported on 7.9% of returns)
14869:
$11,900
New York:
$17,621
Total itemized deductions: $14,808 (19% of AGI, reported on 20.6% of returns)
Here:
$14,808
State:
$34,985
Here:
19.0% of AGI
State:
21.3% of AGI
(% of AGI for various income ranges: 6.3% for AGIs $25k-50k, 6.7% for AGIs $50k-75k, 8.9% for AGIs $75k-100k, 10.0% for AGIs $100k-200k)
Charity contributions: $2,275 (reported on 12.7% of returns)
Here:
$2,275
State:
$5,572
(% of AGI for various income ranges: 1.1% for AGIs $25k-50k, 1.2% for AGIs $75k-100k, 0.8% for AGIs $100k-200k)
Taxes paid: $7,185 (reported on 20.6% of returns)
14869:
$7,185
State:
$18,656
(% of AGI for various income ranges: 2.3% for AGIs $25k-50k, 3.5% for AGIs $50k-75k, 4.0% for AGIs $75k-100k, 5.5% for AGIs $100k-200k)
Earned income credit: $2,300 (reported on 17.5% of returns)
Here:
$2,300
State:
$2,230
(% of AGI for various income ranges: 5.7% for AGIs below $25k, 1.1% for AGIs $25k-50k)
Percentage of individuals using paid preparers for their 2012 taxes: 49.2%
Here:
49%
State:
66%
(% for various income ranges: 44.0% for AGIs below $25k, 52.9% for AGIs $25k-50k, 55.6% for AGIs $50k-75k, 50.0% for AGIs $75k-100k, 50.0% for AGIs $100k-200k)
Averages for the 2004 tax year for zip code 14869, filed in 2005:
Average Adjusted Gross Income (AGI) in 2004: $34,575 (Individual Income Tax Returns)
Here:
$34,575
State:
$59,519
Salary/wage: $32,744 (reported on 84.4% of returns)
Here:
$32,744
State:
$50,673
(% of AGI for various income ranges: 86.0% for AGIs below $10k, 67.5% for AGIs $10k-25k, 85.0% for AGIs $25k-50k, 82.4% for AGIs $50k-75k, 74.3% for AGIs $75k-100k, 86.4% for AGIs over 100k)
Taxable interest for individuals: $624 (reported on 47.9% of returns)
This zip code:
$624
New York:
$2,377
(% of AGI for various income ranges: 1.9% for AGIs below $10k, 1.6% for AGIs $10k-25k, 0.4% for AGIs $25k-50k, 0.9% for AGIs $50k-75k, 1.1% for AGIs $75k-100k, 0.3% for AGIs over 100k)
Taxable dividends: $748 (reported on 18.7% of returns)
Here:
$748
State:
$5,394
(% of AGI for various income ranges: 0.5% for AGIs below $10k, 0.9% for AGIs $10k-25k, 0.3% for AGIs $25k-50k, 0.4% for AGIs $50k-75k, 0.5% for AGIs $75k-100k)
Net capital gain/loss: +$753 (reported on 13.8% of returns)
Here:
+$753
State:
+$23,581
(% of AGI for various income ranges: -0.5% for AGIs below $10k, -0.2% for AGIs $10k-25k, 0.8% for AGIs $25k-50k, -0.2% for AGIs $50k-75k, 0.8% for AGIs $75k-100k)
Profit/loss from business: +$1,326 (reported on 14.0% of returns)
Here:
+$1,326
State:
+$13,809
(% of AGI for various income ranges: -11.0% for AGIs below $10k, 7.3% for AGIs $10k-25k, -1.6% for AGIs $25k-50k, 0.0% for AGIs $50k-75k, 1.8% for AGIs $75k-100k)
IRA payment deduction: $1,941 (reported on 2.8% of returns)
14869:
$1,941
New York:
$3,115
Total itemized deductions: $15,126 (23% of AGI, reported on 21.9% of returns)
Here:
$15,126
State:
$25,864
Here:
23.4% of AGI
State:
21.9% of AGI
(% of AGI for various income ranges: 3.8% for AGIs $10k-25k, 7.1% for AGIs $25k-50k, 9.1% for AGIs $50k-75k, 14.7% for AGIs $75k-100k, 17.5% for AGIs over 100k)
Charity contributions deductions: $2,804 (4% of AGI, reported on 18.2% of returns)
Here:
$2,804
State:
$4,439
Here:
4.1% of AGI
State:
3.6% of AGI
(% of AGI for various income ranges: 1.5% for AGIs $25k-50k, 0.9% for AGIs $50k-75k, 2.6% for AGIs $75k-100k, 3.0% for AGIs over 100k)
Total tax: $3,808 (reported on 72.6% of returns)
14869:
$3,808
State:
$11,730
(% of AGI for various income ranges: 1.9% for AGIs below $10k, 4.2% for AGIs $10k-25k, 6.6% for AGIs $25k-50k, 7.6% for AGIs $50k-75k, 10.7% for AGIs $75k-100k, 14.0% for AGIs over 100k)
Earned income credit: $1,923 (reported on 16.9% of returns)
Here:
$1,923
State:
$1,757
Percentage of individuals using paid preparers for their 2004 taxes: 57.3%
Here:
57%
State:
67%
(% for various income ranges: 47.8% for AGIs below $10k, 66.2% for AGIs $10k-25k, 53.8% for AGIs $25k-50k, 59.2% for AGIs $50k-75k, 76.4% for AGIs $75k-100k)
Household received Food Stamps/SNAP in the past 12 months: 174 Household did not receive Food Stamps/SNAP in the past 12 months: 408
Women who had a birth in the past 12 months: 15 (13 now married, 2 unmarried) Women who did not have a birth in the past 12 months: 235 (71 now married, 164 unmarried)
Housing units in zip code 14869 with a mortgage: 159 (15 second mortgage, 2 home equity loan, 13 both second mortgage and home equity loan) Houses without a mortgage: 12
Median monthly owner costs for units with a mortgage: $1,350 Median monthly owner costs for units without a mortgage: $534
Residents with income below the poverty level in 2022:
This zip code:
25.0%
Whole state:
14.3%
Residents with income below 50% of the poverty level in 2022:
This zip code:
12.2%
Whole state:
6.8%
Median number of rooms in houses and condos:
Here:
6.5
State:
6.3
Median number of rooms in apartments:
Here:
5.5
State:
3.8
Notable locations in this zip code not listed on our city pages
Notable locations in zip code 14869: Bergen Farms (A), Dutton S Peterson Memorial Library (B), Catharine Town Hall (C), Odessa Fire Department (D). Display/hide their locations on the map
Churches in zip code 14869 include: Catharine United Methodist Church (A), Saint Benedict's Church (B), Wesleyan Church (C), Odessa United Methodist Church (D), Odessa Baptist Church (E). Display/hide their locations on the map
In group quarters: 19 (-1 institutionalized population)
Size of family households: 201 2-persons, 45 3-persons, 120 4-persons, 26 5-persons, 15 6-persons
Size of nonfamily households: 121 1-person, 40 2-persons
152 married couples with children.
54 single-parent households (29 men, 25 women).
97.2% of residents of 14869 zip code speak English at home.
0.8% of residents speak Spanish at home (80% very well, 20% well).
1.3% of residents speak other Indo-European language at home (100% very well).
0.3% of residents speak Asian or Pacific Island language at home (100% very well).
Foreign born population: 8 (0.6%) (100.0% of them are naturalized citizens)
This zip code:
0.6%
Whole state:
22.7%
29%Sweden
29%Thailand
24%Irish
22%American
14%German
12%English
5%Italian
3%Scottish
3%European
Year of entry for the foreign-born population
22010 or later
22000 to 2009
01990 to 1999
2Before 1990
Facilities with environmental interests located in this zip code:
BERGEN FARMS (4060 BERGEN ROAD in ODESSA, NY)
STATE MASTER (New York facility tracking) - National Pollutant Discharge Elimination System Permit National Pollutant Discharge Elimination System NON-MAJOR (Tracking pollutant discharge elimination systems) - permit Business SIC classification: GENERAL FARMS, PRIMARILY LIVESTOCK AND ANIMAL SPECIALTIES Organizations: SKIP/MIKE/JIM BERGEN (CONTACT/OWNER)
Alternative names: SKIP/MIKE/JIM BERGEN
HOWARD A. HANLON ES ( in ODESSA, NY)
(National Center for Education Statistics) - STATE ID-550101040002 Organizations: ODESSA-MONTOUR CSD (SCHOOL DISTRICT)
Housing units lacking complete plumbing facilities: 0.5% Housing units lacking complete kitchen facilities: 0.9%
36.1%Fuel oil, kerosene, etc.
23.9%Wood
23.5%Bottled, tank, or LP gas
9.5%Electricity
3.9%Coal or coke
2.7%Other fuel
0.5%Utility gas
0.5%Solar energy
Population in 1990: 1,471.
Place of birth for U.S.-born residents:
This state: 1,107
Northeast: 275
Midwest: 4
South: 47
62% of the 14869 zip code residents lived in the same house 5 years ago. Out of people who lived in different houses, 66% lived in this county. Out of people who lived in different counties, 50% lived in New York.
96% of the 14869 zip code residents lived in the same house 1 year ago. Out of people who lived in different houses, 8% moved from this county. Out of people who lived in different houses, 56% moved from different county within same state. Out of people who lived in different houses, 33% moved from different state.
Private vs. public school enrollment:
Students in private schools in grades 1 to 8 (elementary and middle school):
Here:
0.0%
New York:
15.6%
Students in private schools in grades 9 to 12 (high school):
Here:
0.0%
New York:
15.0%
Students in private undergraduate colleges:
Here:
0.0%
New York:
39.2%
Occupation by median earnings in the past 12 months ($)
80,646Health diagnosing and treating practitioners and other technical occupations
73,560Law enforcement workers including supervisors
64,441Management occupations
62,650Sales and related occupations
58,458Production occupations
57,572Installation, maintenance, and repair occupations
Top industries in this zip code by the number of employees in 2005:
Health Care and Social Assistance: Residential Mental Retardation Facilities (10-19: 1)
Accommodation and Food Services: Full-Service Restaurants (5-9: 1, 1-4: 1)
Finance and Insurance: Insurance Agencies and Brokerages (5-9: 1)
Construction: All Other Specialty Trade Contractors (1-4: 2)
Other Services (except Public Administration): Religious Organizations (1-4: 1)
Health Care and Social Assistance: Child Day Care Services (1-4: 1)
People in group quarters in 2010:
10 people in residential treatment centers for adults
People in group quarters in 2000:
11 people in homes for the mentally retarded
2002 - 2018 National Fire Incident Reporting System (NFIRS) incidents
According to the data from the years 2002 - 2018 the average number of fires per year is 8. The highest number of reported fire incidents - 20 took place in 2008, and the least - 1 in 2002. The data has an increasing trend.
When looking into fire subcategories, the most reports belonged to: Structure Fires (59.6%), and Outside Fires (25.5%).
Fire incident types reported to NFIRS in Zip Code 14869


 Nearest zip codes: 14805, 14865, 14818, 14864, 14824, 14867.


 According to the data from the years 2002 - 2018 the average number of fires per year is 8. The highest number of reported fire incidents - 20 took place in 2008, and the least - 1 in 2002. The data has an increasing trend.
 When looking into fire subcategories, the most reports belonged to: Structure Fires (59.6%), and Outside Fires (25.5%).