Estimated zip code population in 2022: 4,478 Zip code population in 2010: 5,456 Zip code population in 2000: 4,908
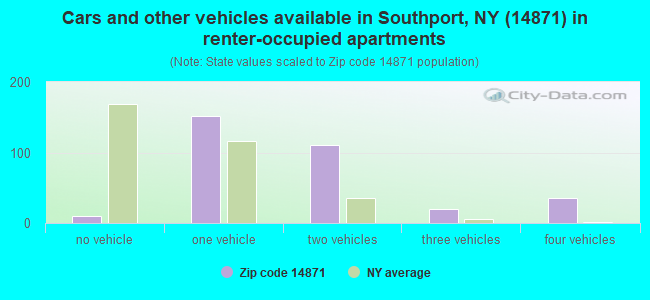
Houses and condos: 1,972 Renter-occupied apartments: 327
% of renters here:
18%
State:
46%
March 2022 cost of living index in zip code 14871: 95.4 (near average, U.S. average is 100)
Land area: 57.2 sq. mi. Water area: 0.5 sq. mi.
Population density: 78 people per square mile
(very low).
OSM Map
General Map
Google Map
MSN Map
OSM Map
General Map
Google Map
MSN Map
OSM Map
General Map
Google Map
MSN Map
OSM Map
General Map
Google Map
MSN Map
Please wait while loading the map...
Real estate property taxes paid for housing units in 2022:
This zip code:
2.1% ($3,699)
New York:
1.5% ($6,180)
Median real estate property taxes paid for housing units with mortgages in 2022: $4,630 (2.3%) Median real estate property taxes paid for housing units with no mortgage in 2022: $2,905 (1.9%)
Business Search- 14 Million verified businesses
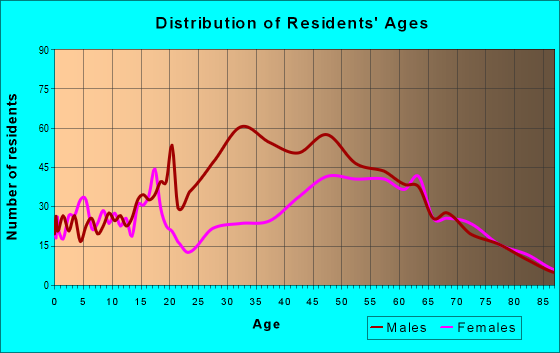
Males: 2,080
(46.4%)
Females: 2,398
(53.6%)
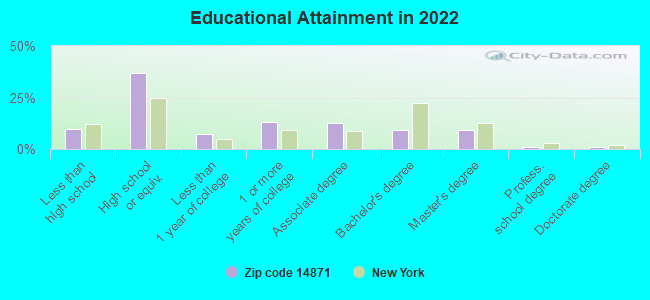
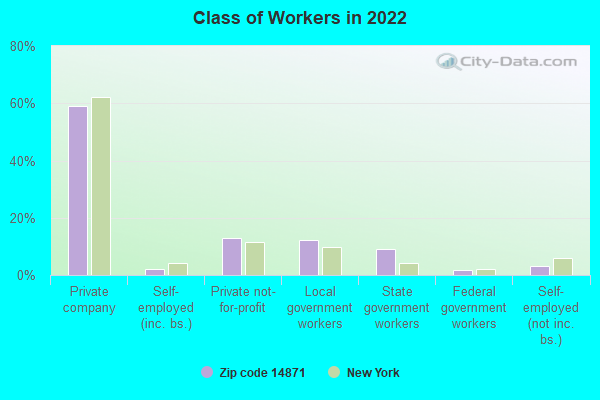
For population 25 years and over in 14871:
High school or higher: 89.4%
Bachelor's degree or higher: 20.6%
Graduate or professional degree: 11.4%
Unemployed: 4.3%
Mean travel time to work (commute): 23.6 minutes
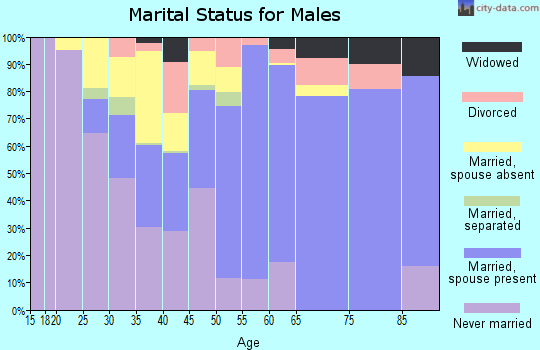
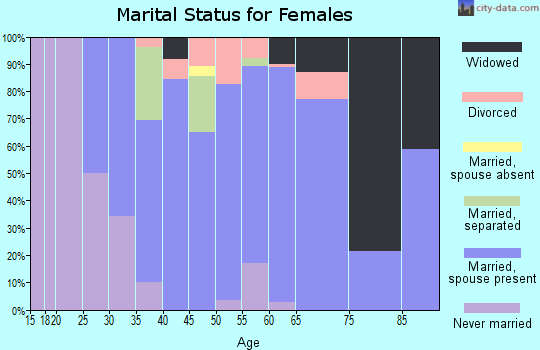
For population 15 years and over in 14871:
Never married: 23.8%
Now married: 61.7%
Separated: 1.2%
Widowed: 6.6%
Divorced: 6.7%
Zip code 14871 compared to state average:
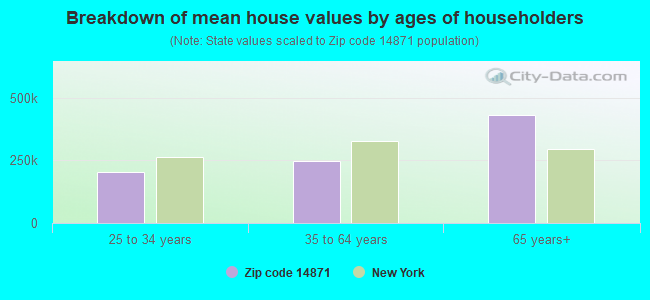
Median house value significantly below state average.
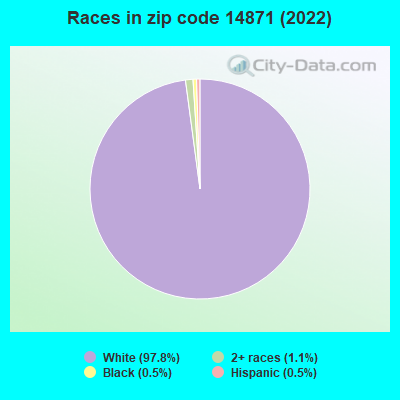
Black race population percentage significantly below state average.
Hispanic race population percentage significantly below state average.
Median age significantly above state average.
Foreign-born population percentage significantly below state average.
Renting percentage significantly below state average.
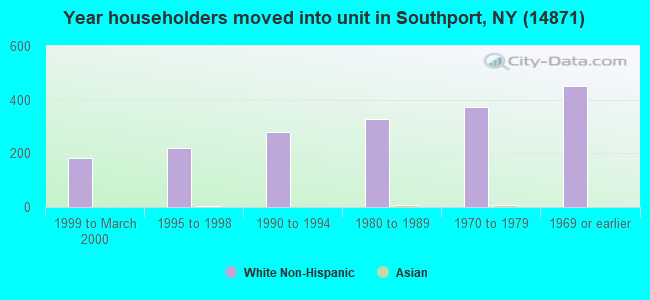
Length of stay since moving in significantly above state average.
Number of college students below state average.
Percentage of population with a bachelor's degree or higher below state average.
Estimated median house/condo value in 2022: $176,276
14871:
$176,276
New York:
$400,400
According to our research of New York and other state lists, there were 3 registered sex offenders living in 14871 zip code as of May 21, 2024. The ratio of all residents to sex offenders in zip code 14871 is 1,790 to 1. The ratio of registered sex offenders to all residents in this zip code is lower than the state average.
Median resident age:
This zip code:
50.4 years
New York median age:
40.0 years
Average household size:
This zip code:
2.4 people
New York:
2.5 people
Averages for the 2020 tax year for zip code 14871, filed in 2021:
Average Adjusted Gross Income (AGI) in 2020: $69,151 (Individual Income Tax Returns)
Here:
$69,151
State:
$90,930
Salary/wage: $58,119 (reported on 75.0% of returns)
Here:
$58,119
State:
$72,104
(% of AGI for various income ranges: 994.3% for AGIs below $25k, 3115.0% for AGIs $25k-50k, 5299.3% for AGIs $50k-75k, 7970.0% for AGIs $75k-100k, 12770.0% for AGIs $100k-200k)
Taxable interest for individuals: $1,050 (reported on 48.6% of returns)
This zip code:
$1,050
New York:
$3,075
(% of AGI for various income ranges: 30.3% for AGIs below $25k, 27.9% for AGIs $25k-50k, 76.6% for AGIs $50k-75k, 61.5% for AGIs $75k-100k, 98.1% for AGIs $100k-200k)
Ordinary dividends: $4,586 (reported on 23.6% of returns)
Here:
$4,586
State:
$11,095
(% of AGI for various income ranges: 26.2% for AGIs below $25k, 46.8% for AGIs $25k-50k, 103.1% for AGIs $50k-75k, 106.5% for AGIs $75k-100k, 314.8% for AGIs $100k-200k)
Net capital gain/loss in AGI: +$9,308 (reported on 17.0% of returns)
Here:
+$9,308
State:
+$44,925
(% of AGI for various income ranges: 14.1% for AGIs below $25k, 13.2% for AGIs $25k-50k, 98.3% for AGIs $50k-75k, 188.5% for AGIs $75k-100k, 367.4% for AGIs $100k-200k)
Profit/loss from business: +$9,961 (reported on 10.8% of returns)
Here:
+$9,961
State:
+$14,940
(% of AGI for various income ranges: 46.8% for AGIs below $25k, 8.9% for AGIs $25k-50k, 74.5% for AGIs $50k-75k, 96.5% for AGIs $75k-100k, 620.4% for AGIs $100k-200k)
Taxable individual retirement arrangement distribution: $15,168 (reported on 16.0% of returns)
14871:
$15,168
New York:
$19,609
(% of AGI for various income ranges: 119.7% for AGIs below $25k, 164.5% for AGIs $25k-50k, 241.7% for AGIs $50k-75k, 535.0% for AGIs $75k-100k, 858.5% for AGIs $100k-200k)
Total itemized deductions: $24,670 (reported on 4.7% of returns)
Here:
$24,670
State:
$39,326
(% of AGI for various income ranges: 142.6% for AGIs $25k-50k, 231.5% for AGIs $75k-100k, 541.5% for AGIs $100k-200k)
Charity contributions: $7,888 (reported on 3.8% of returns)
Here:
$7,888
State:
$15,420
(% of AGI for various income ranges: 134.5% for AGIs $75k-100k, 134.1% for AGIs $100k-200k)
Taxes paid: $8,700 (reported on 4.2% of returns)
14871:
$8,700
State:
$9,183
(% of AGI for various income ranges: 48.2% for AGIs $25k-50k, 92.0% for AGIs $75k-100k, 154.1% for AGIs $100k-200k)
Earned income credit: $1,818 (reported on 8.0% of returns)
Here:
$1,818
State:
$2,138
(% of AGI for various income ranges: 50.3% for AGIs below $25k, 32.4% for AGIs $25k-50k)
Percentage of individuals using paid preparers for their 2020 taxes: 95.8%
Here:
96%
State:
95%
(% for various income ranges: 92.6% for AGIs below $25k, 95.7% for AGIs $25k-50k, 97.4% for AGIs $50k-75k, 96.4% for AGIs $75k-100k, 97.4% for AGIs $100k-200k, 100.0% for AGIs over 200k)
Averages for the 2012 tax year for zip code 14871, filed in 2013:
Average Adjusted Gross Income (AGI) in 2012: $60,770 (Individual Income Tax Returns)
Here:
$60,770
State:
$77,088
Salary/wage: $51,150 (reported on 80.5% of returns)
Here:
$51,150
State:
$60,593
(% of AGI for various income ranges: 64.7% for AGIs below $25k, 71.8% for AGIs $25k-50k, 72.6% for AGIs $50k-75k, 72.7% for AGIs $75k-100k, 73.8% for AGIs $100k-200k, 44.4% for AGIs over 200k)
Taxable interest for individuals: $1,215 (reported on 48.4% of returns)
This zip code:
$1,215
New York:
$3,125
(% of AGI for various income ranges: 1.3% for AGIs below $25k, 0.7% for AGIs $25k-50k, 0.7% for AGIs $50k-75k, 0.9% for AGIs $75k-100k, 0.7% for AGIs $100k-200k, 1.7% for AGIs over 200k)
Ordinary dividends: $3,040 (reported on 28.5% of returns)
Here:
$3,040
State:
$10,299
(% of AGI for various income ranges: 1.9% for AGIs below $25k, 1.0% for AGIs $25k-50k, 1.3% for AGIs $50k-75k, 0.9% for AGIs $75k-100k, 1.1% for AGIs $100k-200k, 2.7% for AGIs over 200k)
Net capital gain/loss in AGI: +$8,289 (reported on 15.8% of returns)
Here:
+$8,289
State:
+$42,474
(% of AGI for various income ranges: 0.9% for AGIs below $25k, 0.5% for AGIs $50k-75k, 0.1% for AGIs $75k-100k, 0.4% for AGIs $100k-200k, 11.5% for AGIs over 200k)
Profit/loss from business: +$11,745 (reported on 13.1% of returns)
Here:
+$11,745
State:
+$16,168
(% of AGI for various income ranges: 5.4% for AGIs below $25k, 2.3% for AGIs $25k-50k, 0.9% for AGIs $50k-75k, 1.8% for AGIs $75k-100k, 4.8% for AGIs $100k-200k)
Taxable individual retirement arrangement distribution: $11,066 (reported on 13.1% of returns)
14871:
$11,066
New York:
$17,621
(% of AGI for various income ranges: 5.4% for AGIs below $25k, 3.5% for AGIs $25k-50k, 1.9% for AGIs $50k-75k, 2.3% for AGIs $75k-100k, 3.0% for AGIs $100k-200k)
Total itemized deductions: $20,185 (18% of AGI, reported on 29.9% of returns)
Here:
$20,185
State:
$34,985
Here:
17.6% of AGI
State:
21.3% of AGI
(% of AGI for various income ranges: 5.5% for AGIs below $25k, 6.7% for AGIs $25k-50k, 8.8% for AGIs $50k-75k, 9.5% for AGIs $75k-100k, 12.4% for AGIs $100k-200k, 11.1% for AGIs over 200k)
Charity contributions: $3,389 (reported on 24.0% of returns)
Here:
$3,389
State:
$5,572
(% of AGI for various income ranges: 0.5% for AGIs below $25k, 1.1% for AGIs $25k-50k, 1.1% for AGIs $50k-75k, 1.1% for AGIs $75k-100k, 2.1% for AGIs $100k-200k, 1.0% for AGIs over 200k)
Taxes paid: $10,336 (reported on 29.9% of returns)
14871:
$10,336
State:
$18,656
(% of AGI for various income ranges: 1.8% for AGIs below $25k, 2.4% for AGIs $25k-50k, 3.8% for AGIs $50k-75k, 4.4% for AGIs $75k-100k, 6.6% for AGIs $100k-200k, 7.8% for AGIs over 200k)
Earned income credit: $1,625 (reported on 10.9% of returns)
Here:
$1,625
State:
$2,230
(% of AGI for various income ranges: 3.5% for AGIs below $25k, 0.5% for AGIs $25k-50k)
Percentage of individuals using paid preparers for their 2012 taxes: 57.5%
Here:
57%
State:
66%
(% for various income ranges: 46.7% for AGIs below $25k, 53.5% for AGIs $25k-50k, 64.1% for AGIs $50k-75k, 67.9% for AGIs $75k-100k, 67.7% for AGIs $100k-200k, 80.0% for AGIs over 200k)
Averages for the 2004 tax year for zip code 14871, filed in 2005:
Average Adjusted Gross Income (AGI) in 2004: $48,336 (Individual Income Tax Returns)
Here:
$48,336
State:
$59,519
Salary/wage: $42,357 (reported on 82.4% of returns)
Here:
$42,357
State:
$50,673
(% of AGI for various income ranges: 78.4% for AGIs below $10k, 63.6% for AGIs $10k-25k, 77.6% for AGIs $25k-50k, 79.1% for AGIs $50k-75k, 81.8% for AGIs $75k-100k, 58.5% for AGIs over 100k)
Taxable interest for individuals: $1,019 (reported on 59.5% of returns)
This zip code:
$1,019
New York:
$2,377
(% of AGI for various income ranges: 4.6% for AGIs below $10k, 2.9% for AGIs $10k-25k, 1.4% for AGIs $25k-50k, 1.0% for AGIs $50k-75k, 1.1% for AGIs $75k-100k, 0.8% for AGIs over 100k)
Taxable dividends: $1,981 (reported on 30.9% of returns)
Here:
$1,981
State:
$5,394
(% of AGI for various income ranges: 3.9% for AGIs below $10k, 2.7% for AGIs $10k-25k, 1.0% for AGIs $25k-50k, 0.8% for AGIs $50k-75k, 0.6% for AGIs $75k-100k, 1.7% for AGIs over 100k)
Net capital gain/loss: +$5,363 (reported on 22.6% of returns)
Here:
+$5,363
State:
+$23,581
(% of AGI for various income ranges: 3.8% for AGIs below $10k, 1.1% for AGIs $10k-25k, 0.8% for AGIs $25k-50k, 1.0% for AGIs $50k-75k, 0.7% for AGIs $75k-100k, 6.3% for AGIs over 100k)
Profit/loss from business: +$6,348 (reported on 13.4% of returns)
Here:
+$6,348
State:
+$13,809
(% of AGI for various income ranges: 5.5% for AGIs below $10k, 2.8% for AGIs $10k-25k, 1.8% for AGIs $25k-50k, 1.3% for AGIs $50k-75k, 0.4% for AGIs $75k-100k, 2.6% for AGIs over 100k)
IRA payment deduction: $2,986 (reported on 3.2% of returns)
14871:
$2,986
New York:
$3,115
Self-employed pension: $9,200 (reported on 0.5% of returns)
Here:
$9,200
New York:
$19,016
Total itemized deductions: $16,882 (19% of AGI, reported on 33.4% of returns)
Here:
$16,882
State:
$25,864
Here:
19.4% of AGI
State:
21.9% of AGI
(% of AGI for various income ranges: 11.0% for AGIs $10k-25k, 9.6% for AGIs $25k-50k, 10.9% for AGIs $50k-75k, 13.1% for AGIs $75k-100k, 13.5% for AGIs over 100k)
Charity contributions deductions: $2,886 (3% of AGI, reported on 30.4% of returns)
Here:
$2,886
State:
$4,439
Here:
3.2% of AGI
State:
3.6% of AGI
(% of AGI for various income ranges: 0.7% for AGIs $10k-25k, 1.1% for AGIs $25k-50k, 1.7% for AGIs $50k-75k, 2.2% for AGIs $75k-100k, 2.4% for AGIs over 100k)
Total tax: $6,514 (reported on 78.9% of returns)
14871:
$6,514
State:
$11,730
(% of AGI for various income ranges: 2.9% for AGIs below $10k, 4.0% for AGIs $10k-25k, 6.7% for AGIs $25k-50k, 9.0% for AGIs $50k-75k, 10.1% for AGIs $75k-100k, 16.9% for AGIs over 100k)
Earned income credit: $1,534 (reported on 9.5% of returns)
Here:
$1,534
State:
$1,757
Percentage of individuals using paid preparers for their 2004 taxes: 63.4%
Here:
63%
State:
67%
(% for various income ranges: 50.9% for AGIs below $10k, 60.4% for AGIs $10k-25k, 68.0% for AGIs $25k-50k, 66.7% for AGIs $50k-75k, 67.0% for AGIs $75k-100k, 73.1% for AGIs over 100k)
Likely homosexual households (counted as self-reported same-sex unmarried-partner households)
Lesbian couples: 0.0% of all households
Gay men: 0.5% of all households
Household received Food Stamps/SNAP in the past 12 months: 92 Household did not receive Food Stamps/SNAP in the past 12 months: 1,749
Women who had a birth in the past 12 months: 103 (53 now married, 50 unmarried) Women who did not have a birth in the past 12 months: 690 (282 now married, 407 unmarried)
Housing units in zip code 14871 with a mortgage: 665 (44 second mortgage, 1 home equity loan, 33 both second mortgage and home equity loan) Houses without a mortgage: 40
Median monthly owner costs for units with a mortgage: $1,429 Median monthly owner costs for units without a mortgage: $679
Residents with income below the poverty level in 2022:
This zip code:
8.5%
Whole state:
14.3%
Residents with income below 50% of the poverty level in 2022:
This zip code:
4.8%
Whole state:
6.8%
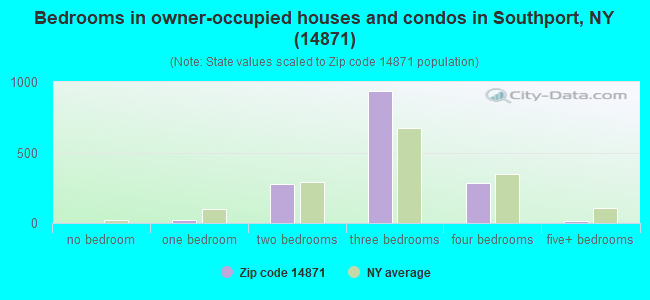
Median number of rooms in houses and condos:
Here:
5.9
State:
6.3
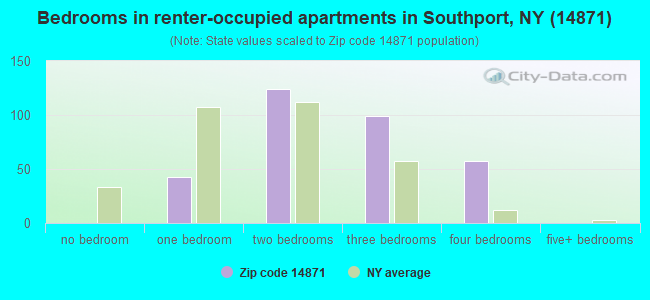
Median number of rooms in apartments:
Here:
4.7
State:
3.8
Notable locations in this zip code not listed on our city pages
537 married couples with children.
107 single-parent households (107 men).
99.8% of residents of 14871 zip code speak English at home.
0.1% of residents speak Spanish at home (100% very well).
0.6% of residents speak other Indo-European language at home (46% very well, 54% well).
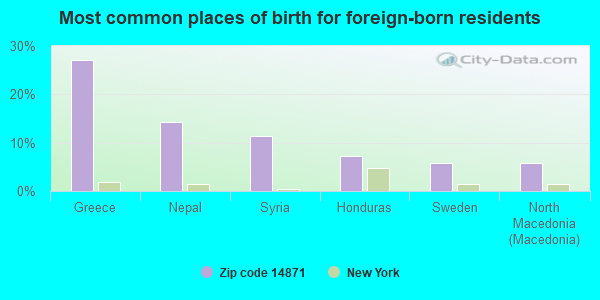
Foreign born population: 70 (1.6%) (79.7% of them are naturalized citizens)
This zip code:
1.6%
Whole state:
22.7%
27%Greece
14%Nepal
11%Syria
7%Honduras
6%Sweden
6%North Macedonia (Macedonia)
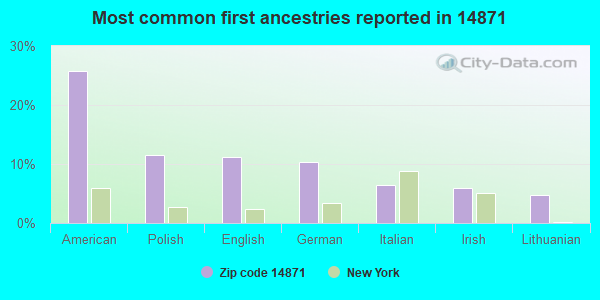
26%American
11%Polish
11%English
10%German
6%Italian
6%Irish
5%Lithuanian
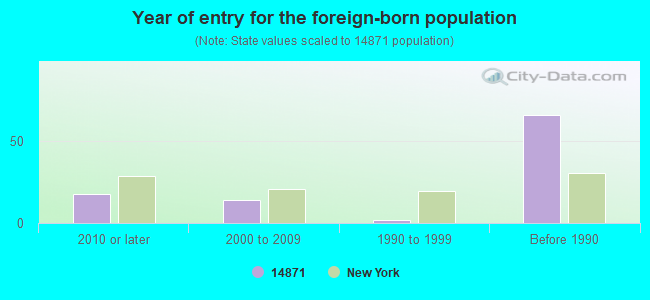
Year of entry for the foreign-born population
182010 or later
142000 to 2009
21990 to 1999
66Before 1990
Facilities with environmental interests located in this zip code:
AIRPORT STRIPING (SAGETOWN RD & KINNERHILL RD in PINE CITY, NY)
Small Quantity Generators, between 100 kg and 1000 kg of hazardous waste/month (Resource Conservation and Recovery Act (tracking hazardous waste)) - notification Organizations: WILLIAM COOK (CONTACT/OWNER)
Housing units lacking complete plumbing facilities: 0.4% Housing units lacking complete kitchen facilities: 0.7%
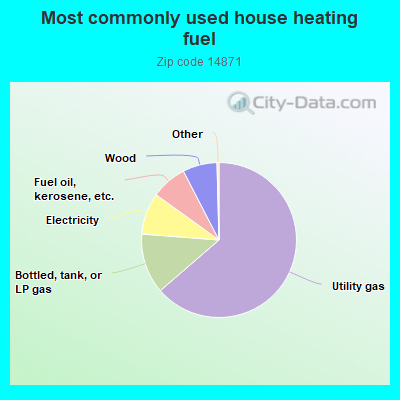
63.8%Utility gas
12.6%Bottled, tank, or LP gas
8.7%Electricity
7.5%Fuel oil, kerosene, etc.
7.2%Wood
Population in 1990: 4,911.
Place of birth for U.S.-born residents:
This state: 3,736
Northeast: 413
Midwest: 152
South: 33
West: 27
76% of the 14871 zip code residents lived in the same house 5 years ago. Out of people who lived in different houses, 70% lived in this county. Out of people who lived in different counties, 50% lived in New York.
98% of the 14871 zip code residents lived in the same house 1 year ago. Out of people who lived in different houses, 15% moved from this county. Out of people who lived in different houses, 36% moved from different county within same state. Out of people who lived in different houses, 28% moved from different state. Out of people who lived in different houses, 16% moved from abroad.
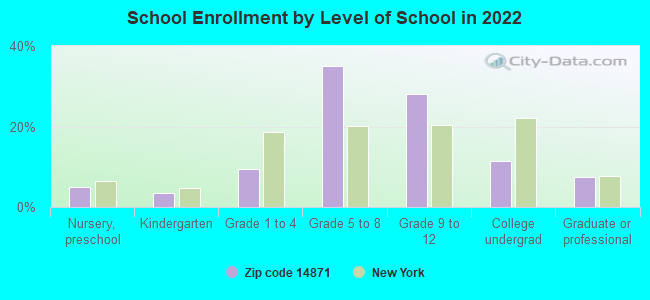
Private vs. public school enrollment:
Students in private schools in grades 1 to 8 (elementary and middle school): 69
Here:
22.1%
New York:
15.6%
Students in private schools in grades 9 to 12 (high school): 64
Here:
32.1%
New York:
15.0%
Students in private undergraduate colleges: 4
Here:
6.2%
New York:
39.2%
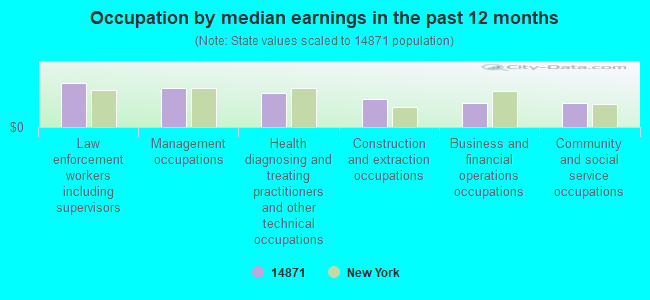
Occupation by median earnings in the past 12 months ($)
100,771Law enforcement workers including supervisors
88,446Management occupations
78,181Health diagnosing and treating practitioners and other technical occupations
64,432Construction and extraction occupations
55,804Business and financial operations occupations
55,343Community and social service occupations
Companies with federal contracts located in this zip code:
NELSON & STREETER CONSTRUCTION (70 SAGETWON ROAD in PINE CITY, NY; small business) : $658,731 in 9 contractsfrom 2001 to 2005
Contracts for Maintenance, Repair or Alteration of Real Property -- Highways, Roads, Streets, Bridges, and Railways (includes resurfacing), Maintenance, Repair or Alteration of Real Property -- Other Non-Building Facilities by Department of Veterans Affairs, Army, U.S. Army Corps of Engineers - civil program financing only, National Park Service, and others Signed by year:2000: $0; 2001: $430,441; 2002: $0; 2003: -$1,000; 2004: $179,560; 2005: $49,730; 2006: $0.
Biggest contracts:
$225,000 with Department of Veterans Affairs for Maintenance, Repair or Alteration of Real Property -- Highways, Roads, Streets, Bridges, and Railways (includes resurfacing). Signed on 2001-09-15. Completion date: 2002-08-15.
$89,780 with Army for Maintenance, Repair or Alteration of Real Property -- Highways, Roads, Streets, Bridges, and Railways (includes resurfacing). Taking place in PA. Signed on 2004-04-27. Completion date: 2004-09-30.
$89,780 with U.S. Army Corps of Engineers - civil program financing only for Maintenance, Repair or Alteration of Real Property -- Highways, Roads, Streets, Bridges, and Railways (includes resurfacing). Taking place in PA. Signed on 2004-04-27. Completion date: 2004-09-30.
$84,500 with U.S. Army Corps of Engineers - civil program financing only for Maintenance, Repair or Alteration of Real Property -- Other Non-Building Facilities. Taking place in PA. Signed on 2001-08-03. Completion date: 2001-09-30.
Top industries in this zip code by the number of employees in 2005:
Construction: Highway, Street, and Bridge Construction (20-49 employees: 2 establishments, 10-19 employees: 1 establishment, 1-4 employees: 1 establishment)
Wholesale Trade: Beer and Ale Merchant Wholesalers (20-49: 1)
Accommodation and Food Services: Hotels (except Casino Hotels) and Motels (20-49: 1)
Management of Companies and Enterprises: Offices of Other Holding Companies (20-49: 1)
Management of Companies and Enterprises: Corporate, Subsidiary, and Regional Managing Offices (20-49: 1)
Real Estate and Rental and Leasing: Lessors of Nonresidential Buildings (except Miniwarehouses) (20-49: 1)
Health Care and Social Assistance: Offices of Physicians (except Mental Health Specialists) (10-19: 1)
Other Services (except Public Administration): Religious Organizations (5-9: 1, 1-4: 2)
People in group quarters in 2010:
878 people in state prisons
9 people in group homes intended for adults
9 people in other noninstitutional facilities
People in group quarters in 2000:
14 people in other nonhousehold living situations
9 people in homes for the mentally retarded
Fatal accident statistics in 2014:
Fatal accident count: 1
Vehicles involved in fatal accidents: 1
Fatal accidents caused by drunken drivers: 0
Fatalities: 1
Persons involved in fatal accidents: 1
Pedestrians involved in fatal accidents: 1
Fatal accident statistics in 2013:
Fatal accident count: 1
Vehicles involved in fatal accidents: 1
Fatal accidents caused by drunken drivers: 0
Fatalities: 1
Persons involved in fatal accidents: 2
Pedestrians involved in fatal accidents: 0
Home Mortgage Disclosure Act Aggregated Statistics For Year 2009 (Based on 6 partial tracts)
A) FHA, FSA/RHS & VA Home Purchase Loans
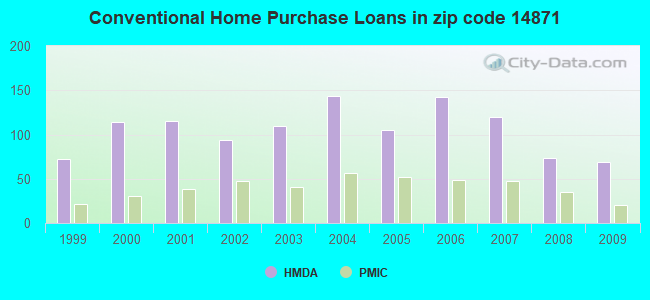
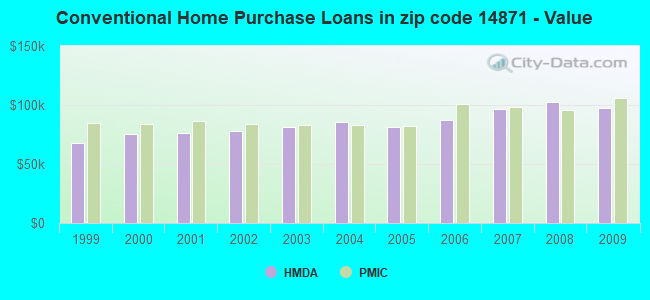
B) Conventional Home Purchase Loans
C) Refinancings
D) Home Improvement Loans
E) Loans on Dwellings For 5+ Families
F) Non-occupant Loans on < 5 Family Dwellings (A B C & D)
G) Loans On Manufactured Home Dwelling (A B C & D)
Number
Average Value
Number
Average Value
Number
Average Value
Number
Average Value
Number
Average Value
Number
Average Value
Number
Average Value
LOANS ORIGINATED
48
$100,615
69
$97,880
170
$101,213
72
$31,167
1
$1,755,030
10
$59,277
3
$31,870
APPLICATIONS APPROVED, NOT ACCEPTED
2
$62,855
7
$99,807
12
$115,402
3
$37,963
0
$0
0
$0
4
$85,292
APPLICATIONS DENIED
6
$95,303
25
$72,990
51
$97,297
24
$20,807
0
$0
2
$57,610
13
$53,702
APPLICATIONS WITHDRAWN
4
$96,038
6
$135,925
35
$92,139
3
$59,900
0
$0
1
$62,740
0
$0
FILES CLOSED FOR INCOMPLETENESS
1
$88,370
1
$31,450
7
$107,257
0
$0
0
$0
1
$29,390
0
$0
Aggregated Statistics For Year 2008 (Based on 6 partial tracts)
A) FHA, FSA/RHS & VA Home Purchase Loans
B) Conventional Home Purchase Loans
C) Refinancings
D) Home Improvement Loans
E) Loans on Dwellings For 5+ Families
F) Non-occupant Loans on < 5 Family Dwellings (A B C & D)
G) Loans On Manufactured Home Dwelling (A B C & D)
Number
Average Value
Number
Average Value
Number
Average Value
Number
Average Value
Number
Average Value
Number
Average Value
Number
Average Value
LOANS ORIGINATED
25
$90,040
74
$102,582
88
$85,734
92
$22,317
1
$670,610
14
$81,874
2
$13,230
APPLICATIONS APPROVED, NOT ACCEPTED
1
$63,800
8
$109,436
9
$102,940
3
$21,637
0
$0
0
$0
1
$30,080
APPLICATIONS DENIED
5
$97,634
14
$94,017
77
$95,748
52
$29,048
0
$0
7
$36,297
1
$62,280
APPLICATIONS WITHDRAWN
1
$155,550
7
$130,186
39
$95,173
8
$53,326
0
$0
1
$77,250
0
$0
FILES CLOSED FOR INCOMPLETENESS
2
$68,780
2
$149,060
5
$84,444
1
$12,910
0
$0
1
$38,660
0
$0
Aggregated Statistics For Year 2007 (Based on 6 partial tracts)
A) FHA, FSA/RHS & VA Home Purchase Loans
B) Conventional Home Purchase Loans
C) Refinancings
D) Home Improvement Loans
F) Non-occupant Loans on < 5 Family Dwellings (A B C & D)
G) Loans On Manufactured Home Dwelling (A B C & D)
Number
Average Value
Number
Average Value
Number
Average Value
Number
Average Value
Number
Average Value
Number
Average Value
LOANS ORIGINATED
15
$98,635
120
$96,485
123
$83,091
124
$26,297
16
$55,677
9
$38,118
APPLICATIONS APPROVED, NOT ACCEPTED
2
$40,265
15
$76,461
33
$102,198
10
$20,015
7
$58,307
1
$45,800
APPLICATIONS DENIED
2
$117,075
24
$84,080
114
$75,813
53
$29,591
5
$76,592
3
$14,397
APPLICATIONS WITHDRAWN
1
$82,720
13
$65,970
58
$93,049
12
$52,814
3
$48,270
0
$0
FILES CLOSED FOR INCOMPLETENESS
1
$113,230
2
$67,145
14
$105,375
0
$0
0
$0
0
$0
Aggregated Statistics For Year 2006 (Based on 6 partial tracts)
A) FHA, FSA/RHS & VA Home Purchase Loans
B) Conventional Home Purchase Loans
C) Refinancings
D) Home Improvement Loans
F) Non-occupant Loans on < 5 Family Dwellings (A B C & D)
G) Loans On Manufactured Home Dwelling (A B C & D)
Number
Average Value
Number
Average Value
Number
Average Value
Number
Average Value
Number
Average Value
Number
Average Value
LOANS ORIGINATED
9
$83,111
142
$87,562
165
$65,681
126
$28,625
27
$57,917
7
$37,224
APPLICATIONS APPROVED, NOT ACCEPTED
2
$119,340
19
$96,052
33
$88,114
10
$32,028
5
$80,824
4
$42,490
APPLICATIONS DENIED
1
$38,280
23
$73,380
166
$86,202
71
$23,250
6
$40,338
11
$27,742
APPLICATIONS WITHDRAWN
1
$37,600
12
$76,159
106
$79,767
11
$50,509
9
$91,159
0
$0
FILES CLOSED FOR INCOMPLETENESS
1
$38,280
1
$69,730
18
$92,681
0
$0
0
$0
0
$0
Aggregated Statistics For Year 2005 (Based on 6 partial tracts)
A) FHA, FSA/RHS & VA Home Purchase Loans
B) Conventional Home Purchase Loans
C) Refinancings
D) Home Improvement Loans
F) Non-occupant Loans on < 5 Family Dwellings (A B C & D)
G) Loans On Manufactured Home Dwelling (A B C & D)
Number
Average Value
Number
Average Value
Number
Average Value
Number
Average Value
Number
Average Value
Number
Average Value
LOANS ORIGINATED
16
$76,027
105
$81,763
147
$78,468
130
$19,164
14
$38,909
8
$35,656
APPLICATIONS APPROVED, NOT ACCEPTED
1
$102,180
15
$79,399
34
$85,670
9
$37,868
2
$40,330
2
$30,270
APPLICATIONS DENIED
4
$48,995
31
$67,611
152
$92,693
62
$36,787
7
$70,239
9
$36,091
APPLICATIONS WITHDRAWN
0
$0
18
$100,536
106
$89,799
11
$71,702
9
$113,233
1
$29,470
FILES CLOSED FOR INCOMPLETENESS
0
$0
2
$70,845
33
$94,181
5
$66,182
1
$70,790
0
$0
Aggregated Statistics For Year 2004 (Based on 6 partial tracts)
A) FHA, FSA/RHS & VA Home Purchase Loans
B) Conventional Home Purchase Loans
C) Refinancings
D) Home Improvement Loans
E) Loans on Dwellings For 5+ Families
F) Non-occupant Loans on < 5 Family Dwellings (A B C & D)
G) Loans On Manufactured Home Dwelling (A B C & D)
Number
Average Value
Number
Average Value
Number
Average Value
Number
Average Value
Number
Average Value
Number
Average Value
Number
Average Value
LOANS ORIGINATED
6
$69,673
143
$85,957
208
$77,308
109
$20,923
1
$155,860
15
$53,037
5
$117,796
APPLICATIONS APPROVED, NOT ACCEPTED
4
$89,475
11
$110,769
31
$63,943
16
$33,169
0
$0
0
$0
2
$88,400
APPLICATIONS DENIED
3
$56,000
32
$99,876
144
$72,896
63
$20,499
0
$0
5
$34,286
9
$51,347
APPLICATIONS WITHDRAWN
1
$142,790
10
$72,872
102
$78,766
11
$44,719
0
$0
3
$90,313
1
$121,510
FILES CLOSED FOR INCOMPLETENESS
0
$0
7
$103,223
30
$81,889
3
$43,547
0
$0
1
$34,860
0
$0
Aggregated Statistics For Year 2003 (Based on 6 partial tracts)
A) FHA, FSA/RHS & VA Home Purchase Loans
B) Conventional Home Purchase Loans
C) Refinancings
D) Home Improvement Loans
F) Non-occupant Loans on < 5 Family Dwellings (A B C & D)
Number
Average Value
Number
Average Value
Number
Average Value
Number
Average Value
Number
Average Value
LOANS ORIGINATED
17
$75,733
110
$81,221
377
$76,871
93
$14,490
22
$47,217
APPLICATIONS APPROVED, NOT ACCEPTED
4
$47,742
15
$78,629
50
$74,823
4
$22,520
2
$25,325
APPLICATIONS DENIED
2
$59,700
30
$48,958
150
$64,522
38
$20,667
6
$43,948
APPLICATIONS WITHDRAWN
1
$117,370
14
$54,841
83
$71,066
7
$41,809
5
$42,904
FILES CLOSED FOR INCOMPLETENESS
0
$0
5
$76,360
16
$93,826
1
$21,880
0
$0
Aggregated Statistics For Year 2002 (Based on 6 partial tracts)
A) FHA, FSA/RHS & VA Home Purchase Loans
B) Conventional Home Purchase Loans
C) Refinancings
D) Home Improvement Loans
E) Loans on Dwellings For 5+ Families
F) Non-occupant Loans on < 5 Family Dwellings (A B C & D)
Number
Average Value
Number
Average Value
Number
Average Value
Number
Average Value
Number
Average Value
Number
Average Value
LOANS ORIGINATED
22
$62,774
94
$77,766
220
$75,639
74
$18,932
1
$216,460
14
$50,847
APPLICATIONS APPROVED, NOT ACCEPTED
1
$161,550
10
$45,934
43
$75,001
9
$22,610
0
$0
2
$26,835
APPLICATIONS DENIED
4
$101,180
46
$36,826
122
$60,067
30
$11,181
0
$0
12
$50,485
APPLICATIONS WITHDRAWN
1
$60,760
7
$74,039
86
$71,478
7
$42,436
0
$0
3
$47,983
FILES CLOSED FOR INCOMPLETENESS
0
$0
3
$61,367
18
$72,348
0
$0
0
$0
1
$103,560
Aggregated Statistics For Year 2001 (Based on 6 partial tracts)
A) FHA, FSA/RHS & VA Home Purchase Loans
B) Conventional Home Purchase Loans
C) Refinancings
D) Home Improvement Loans
E) Loans on Dwellings For 5+ Families
F) Non-occupant Loans on < 5 Family Dwellings (A B C & D)
Number
Average Value
Number
Average Value
Number
Average Value
Number
Average Value
Number
Average Value
Number
Average Value
LOANS ORIGINATED
33
$63,973
115
$76,188
216
$71,733
87
$15,710
1
$85,060
25
$40,788
APPLICATIONS APPROVED, NOT ACCEPTED
1
$77,250
25
$58,750
27
$73,488
6
$18,223
0
$0
3
$139,853
APPLICATIONS DENIED
2
$51,610
65
$41,046
103
$56,023
36
$9,094
0
$0
6
$44,002
APPLICATIONS WITHDRAWN
2
$53,265
10
$79,294
68
$55,551
11
$17,738
0
$0
4
$54,525
FILES CLOSED FOR INCOMPLETENESS
0
$0
3
$53,493
13
$43,441
0
$0
0
$0
0
$0
Aggregated Statistics For Year 2000 (Based on 6 partial tracts)
A) FHA, FSA/RHS & VA Home Purchase Loans
B) Conventional Home Purchase Loans
C) Refinancings
D) Home Improvement Loans
F) Non-occupant Loans on < 5 Family Dwellings (A B C & D)
Number
Average Value
Number
Average Value
Number
Average Value
Number
Average Value
Number
Average Value
LOANS ORIGINATED
28
$56,284
114
$75,555
73
$56,206
71
$11,977
10
$46,414
APPLICATIONS APPROVED, NOT ACCEPTED
2
$61,525
42
$58,997
35
$56,363
6
$22,765
1
$34,520
APPLICATIONS DENIED
7
$57,301
174
$37,976
81
$45,630
45
$14,569
11
$50,031
APPLICATIONS WITHDRAWN
2
$67,715
12
$60,238
44
$49,107
9
$19,010
1
$53,320
FILES CLOSED FOR INCOMPLETENESS
0
$0
2
$39,115
6
$70,580
0
$0
2
$72,625
Aggregated Statistics For Year 1999 (Based on 3 partial tracts)
A) FHA, FSA/RHS & VA Home Purchase Loans
B) Conventional Home Purchase Loans
C) Refinancings
D) Home Improvement Loans
E) Loans on Dwellings For 5+ Families
F) Non-occupant Loans on < 5 Family Dwellings (A B C & D)
2002 - 2018 National Fire Incident Reporting System (NFIRS) incidents
Based on the data from the years 2002 - 2018 the average number of fire incidents per year is 11. The highest number of reported fires - 25 took place in 2006, and the least - 0 in 2017. The data has a declining trend.
When looking into fire subcategories, the most reports belonged to: Structure Fires (45.4%), and Outside Fires (35.1%).
Fire incident types reported to NFIRS in Zip Code 14871


 Nearest zip codes: 14905, 14903, 16936, 14904, 14814, 14894.
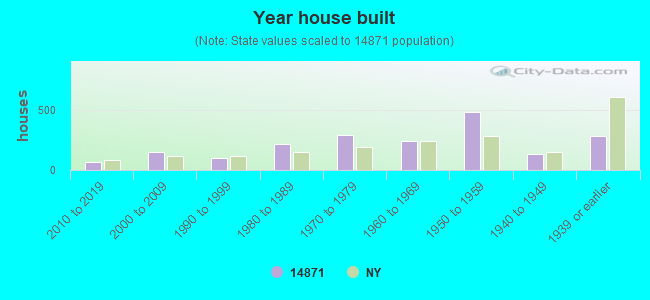


 Based on the data from the years 2002 - 2018 the average number of fire incidents per year is 11. The highest number of reported fires - 25 took place in 2006, and the least - 0 in 2017. The data has a declining trend.
 When looking into fire subcategories, the most reports belonged to: Structure Fires (45.4%), and Outside Fires (35.1%).