Estimated zip code population in 2022: 2,222 Zip code population in 2010: 2,095 Zip code population in 2000: 2,445
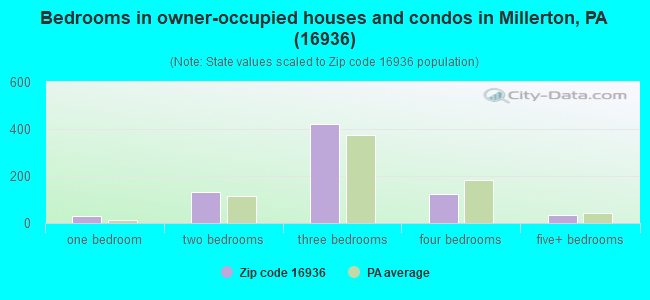
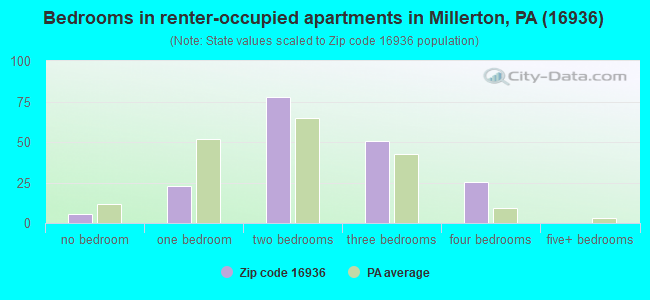
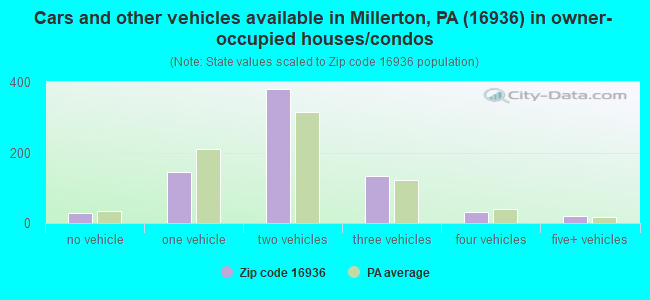
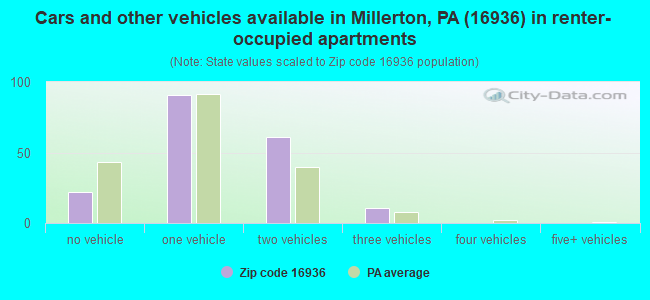
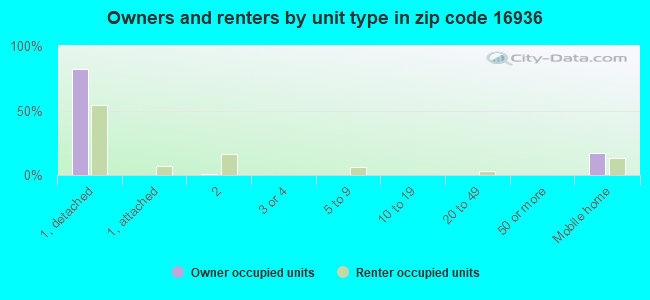
Houses and condos: 1,059 Renter-occupied apartments: 185
% of renters here:
20%
State:
31%
March 2022 cost of living index in zip code 16936: 92.4 (less than average, U.S. average is 100)
Land area: 48.2 sq. mi. Water area: 0.1 sq. mi.
Population density: 46 people per square mile
(very low).
OSM Map
General Map
Google Map
MSN Map
OSM Map
General Map
Google Map
MSN Map
OSM Map
General Map
Google Map
MSN Map
OSM Map
General Map
Google Map
MSN Map
Please wait while loading the map...
Real estate property taxes paid for housing units in 2022:
This zip code:
1.1% ($1,938)
Pennsylvania:
1.3% ($3,094)
Median real estate property taxes paid for housing units with mortgages in 2022: $2,056 (1.0%) Median real estate property taxes paid for housing units with no mortgage in 2022: $1,816 (1.1%)
Business Search- 14 Million verified businesses
Males: 1,092
(49.1%)
Females: 1,129
(50.9%)
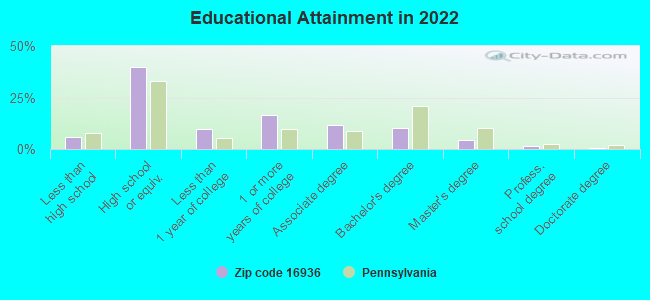
For population 25 years and over in 16936:
High school or higher: 93.2%
Bachelor's degree or higher: 16.3%
Graduate or professional degree: 6.0%
Unemployed: 5.7%
Mean travel time to work (commute): 29.8 minutes
For population 15 years and over in 16936:
Never married: 20.9%
Now married: 61.0%
Separated: 3.1%
Widowed: 5.4%
Divorced: 9.6%
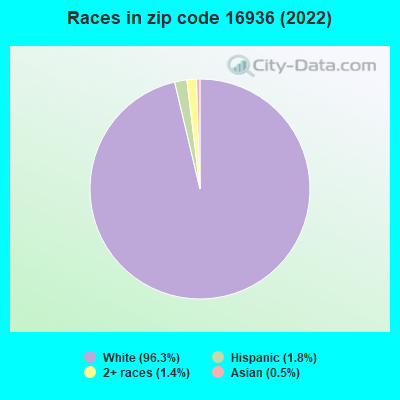
Zip code 16936 compared to state average:
Black race population percentage significantly below state average.
Hispanic race population percentage significantly below state average.
Median age significantly above state average.
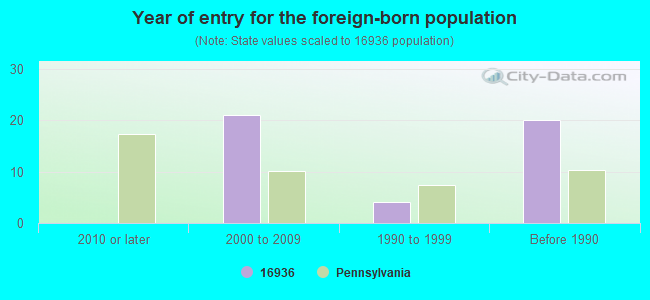
Foreign-born population percentage significantly below state average.
Renting percentage below state average.
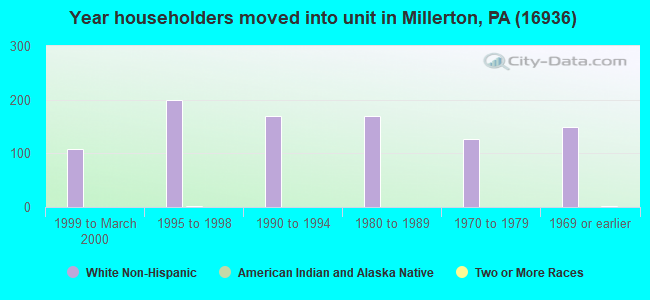
Length of stay since moving in significantly above state average.
Number of college students significantly below state average.
Percentage of population with a bachelor's degree or higher below state average.
Averages for the 2020 tax year for zip code 16936, filed in 2021:
Average Adjusted Gross Income (AGI) in 2020: $52,812 (Individual Income Tax Returns)
Here:
$52,812
State:
$75,707
Salary/wage: $48,357 (reported on 80.2% of returns)
Here:
$48,357
State:
$62,806
(% of AGI for various income ranges: 1143.0% for AGIs below $25k, 3462.5% for AGIs $25k-50k, 5581.5% for AGIs $50k-75k, 9128.3% for AGIs $75k-100k, 21844.3% for AGIs $100k-200k)
Taxable interest for individuals: $508 (reported on 39.6% of returns)
This zip code:
$508
Pennsylvania:
$1,633
(% of AGI for various income ranges: 27.5% for AGIs below $25k, 13.5% for AGIs $25k-50k, 40.0% for AGIs $50k-75k, 13.3% for AGIs $75k-100k, 72.9% for AGIs $100k-200k)
Ordinary dividends: $1,494 (reported on 17.7% of returns)
Here:
$1,494
State:
$7,382
(% of AGI for various income ranges: 15.5% for AGIs below $25k, 11.0% for AGIs $25k-50k, 80.8% for AGIs $50k-75k, 137.1% for AGIs $100k-200k)
Net capital gain/loss in AGI: +$3,892 (reported on 13.5% of returns)
Here:
+$3,892
State:
+$23,522
(% of AGI for various income ranges: 48.5% for AGIs below $25k, 150.8% for AGIs $50k-75k, 304.3% for AGIs $100k-200k)
Profit/loss from business: +$8,491 (reported on 11.5% of returns)
Here:
+$8,491
State:
+$16,274
(% of AGI for various income ranges: 44.5% for AGIs below $25k, 76.0% for AGIs $25k-50k, 333.1% for AGIs $50k-75k, 371.4% for AGIs $100k-200k)
Taxable individual retirement arrangement distribution: $11,436 (reported on 11.5% of returns)
16936:
$11,436
Pennsylvania:
$18,583
(% of AGI for various income ranges: 88.5% for AGIs below $25k, 139.5% for AGIs $25k-50k, 215.4% for AGIs $50k-75k, 870.0% for AGIs $75k-100k)
Earned income credit: $2,136 (reported on 14.6% of returns)
Here:
$2,136
State:
$2,100
(% of AGI for various income ranges: 86.0% for AGIs below $25k, 63.5% for AGIs $25k-50k)
Percentage of individuals using paid preparers for their 2020 taxes: 97.9%
Here:
98%
State:
92%
(% for various income ranges: 93.8% for AGIs below $25k, 100.0% for AGIs $25k-50k, 100.0% for AGIs $50k-75k, 100.0% for AGIs $75k-100k, 100.0% for AGIs $100k-200k)
Averages for the 2012 tax year for zip code 16936, filed in 2013:
Average Adjusted Gross Income (AGI) in 2012: $45,284 (Individual Income Tax Returns)
Here:
$45,284
State:
$61,346
Salary/wage: $43,062 (reported on 84.2% of returns)
Here:
$43,062
State:
$51,902
(% of AGI for various income ranges: 69.1% for AGIs below $25k, 84.2% for AGIs $25k-50k, 84.9% for AGIs $50k-75k, 86.3% for AGIs $75k-100k, 72.2% for AGIs $100k-200k)
Taxable interest for individuals: $695 (reported on 39.6% of returns)
This zip code:
$695
Pennsylvania:
$1,588
(% of AGI for various income ranges: 2.2% for AGIs below $25k, 0.5% for AGIs $25k-50k, 0.3% for AGIs $50k-75k, 0.3% for AGIs $75k-100k, 0.7% for AGIs $100k-200k)
Ordinary dividends: $1,173 (reported on 21.8% of returns)
Here:
$1,173
State:
$5,827
(% of AGI for various income ranges: 1.3% for AGIs below $25k, 0.4% for AGIs $25k-50k, 0.3% for AGIs $50k-75k, 0.5% for AGIs $75k-100k, 0.7% for AGIs $100k-200k)
Net capital gain/loss in AGI: +$5,283 (reported on 11.9% of returns)
Here:
+$5,283
State:
+$14,495
(% of AGI for various income ranges: 0.3% for AGIs below $25k, 1.5% for AGIs $50k-75k, 3.8% for AGIs $100k-200k)
Profit/loss from business: +$3,809 (reported on 10.9% of returns)
Here:
+$3,809
State:
+$16,268
(% of AGI for various income ranges: 1.9% for AGIs below $25k, 0.9% for AGIs $25k-50k, 2.5% for AGIs $50k-75k)
Taxable individual retirement arrangement distribution: $6,922 (reported on 8.9% of returns)
16936:
$6,922
Pennsylvania:
$14,550
(% of AGI for various income ranges: 4.9% for AGIs below $25k, 1.7% for AGIs $25k-50k, 2.2% for AGIs $50k-75k)
Total itemized deductions: $18,153 (21% of AGI, reported on 16.8% of returns)
Here:
$18,153
State:
$23,538
Here:
20.6% of AGI
State:
18.4% of AGI
(% of AGI for various income ranges: 6.0% for AGIs $25k-50k, 6.6% for AGIs $50k-75k, 7.9% for AGIs $75k-100k, 9.2% for AGIs $100k-200k)
Charity contributions: $3,336 (reported on 10.9% of returns)
Here:
$3,336
State:
$4,025
(% of AGI for various income ranges: 1.2% for AGIs $50k-75k, 1.2% for AGIs $75k-100k, 1.1% for AGIs $100k-200k)
Taxes paid: $7,524 (reported on 16.8% of returns)
16936:
$7,524
State:
$9,982
(% of AGI for various income ranges: 1.5% for AGIs $25k-50k, 2.3% for AGIs $50k-75k, 3.4% for AGIs $75k-100k, 4.9% for AGIs $100k-200k)
Earned income credit: $1,819 (reported on 15.8% of returns)
Here:
$1,819
State:
$2,106
(% of AGI for various income ranges: 4.6% for AGIs below $25k, 0.8% for AGIs $25k-50k)
Percentage of individuals using paid preparers for their 2012 taxes: 75.2%
Here:
75%
State:
53%
(% for various income ranges: 66.7% for AGIs below $25k, 73.1% for AGIs $25k-50k, 82.4% for AGIs $50k-75k, 90.0% for AGIs $75k-100k, 88.9% for AGIs $100k-200k)
Averages for the 2004 tax year for zip code 16936, filed in 2005:
Average Adjusted Gross Income (AGI) in 2004: $32,592 (Individual Income Tax Returns)
Here:
$32,592
State:
$48,049
Salary/wage: $32,123 (reported on 83.3% of returns)
Here:
$32,123
State:
$42,646
(% of AGI for various income ranges: 124.8% for AGIs below $10k, 74.5% for AGIs $10k-25k, 85.8% for AGIs $25k-50k, 85.3% for AGIs $50k-75k, 80.2% for AGIs $75k-100k, 67.7% for AGIs over 100k)
Taxable interest for individuals: $665 (reported on 48.6% of returns)
This zip code:
$665
Pennsylvania:
$1,657
(% of AGI for various income ranges: 11.1% for AGIs below $10k, 1.9% for AGIs $10k-25k, 0.5% for AGIs $25k-50k, 0.7% for AGIs $50k-75k, 0.4% for AGIs $75k-100k, 0.6% for AGIs over 100k)
Taxable dividends: $934 (reported on 21.5% of returns)
Here:
$934
State:
$3,566
(% of AGI for various income ranges: 7.1% for AGIs below $10k, 1.3% for AGIs $10k-25k, 0.4% for AGIs $25k-50k, 0.3% for AGIs $50k-75k, 0.5% for AGIs $75k-100k, 0.1% for AGIs over 100k)
Net capital gain/loss: +$3,263 (reported on 17.7% of returns)
Here:
+$3,263
State:
+$9,716
(% of AGI for various income ranges: 1.6% for AGIs below $10k, 1.3% for AGIs $10k-25k, 0.3% for AGIs $25k-50k, 2.5% for AGIs $50k-75k, 3.2% for AGIs $75k-100k, 2.5% for AGIs over 100k)
Profit/loss from business: +$4,717 (reported on 17.5% of returns)
Here:
+$4,717
State:
+$14,267
(% of AGI for various income ranges: 12.2% for AGIs below $10k, 5.0% for AGIs $10k-25k, 2.9% for AGIs $25k-50k, 1.6% for AGIs $50k-75k, 1.9% for AGIs $75k-100k)
IRA payment deduction: $1,950 (reported on 2.0% of returns)
16936:
$1,950
Pennsylvania:
$2,903
Total itemized deductions: $13,434 (20% of AGI, reported on 16.8% of returns)
Here:
$13,434
State:
$18,804
Here:
19.5% of AGI
State:
19.5% of AGI
(% of AGI for various income ranges: 2.6% for AGIs $10k-25k, 6.9% for AGIs $25k-50k, 8.8% for AGIs $50k-75k, 7.7% for AGIs $75k-100k, 7.7% for AGIs over 100k)
Charity contributions deductions: $2,265 (3% of AGI, reported on 11.9% of returns)
Here:
$2,265
State:
$3,337
Here:
3.0% of AGI
State:
3.3% of AGI
(% of AGI for various income ranges: 2.6% for AGIs below $10k, 0.6% for AGIs $25k-50k, 0.9% for AGIs $50k-75k, 1.4% for AGIs $75k-100k, 1.3% for AGIs over 100k)
Total tax: $4,101 (reported on 70.2% of returns)
16936:
$4,101
State:
$8,008
(% of AGI for various income ranges: 5.1% for AGIs below $10k, 3.6% for AGIs $10k-25k, 6.1% for AGIs $25k-50k, 8.1% for AGIs $50k-75k, 10.1% for AGIs $75k-100k, 22.2% for AGIs over 100k)
Earned income credit: $1,757 (reported on 18.3% of returns)
Here:
$1,757
State:
$1,643
Percentage of individuals using paid preparers for their 2004 taxes: 78.7%
Here:
79%
State:
56%
(% for various income ranges: 68.0% for AGIs below $10k, 79.1% for AGIs $10k-25k, 83.1% for AGIs $25k-50k, 86.5% for AGIs $50k-75k, 83.7% for AGIs $75k-100k, 85.0% for AGIs over 100k)
Household received Food Stamps/SNAP in the past 12 months: 113 Household did not receive Food Stamps/SNAP in the past 12 months: 809
Women who had a birth in the past 12 months: 21 (22 now married, 0 unmarried) Women who did not have a birth in the past 12 months: 383 (169 now married, 213 unmarried)
Housing units in zip code 16936 with a mortgage: 290 (20 second mortgage, 12 both second mortgage and home equity loan) Houses without a mortgage: 22
Median monthly owner costs for units with a mortgage: $1,302 Median monthly owner costs for units without a mortgage: $465
Residents with income below the poverty level in 2022:
This zip code:
8.4%
Whole state:
11.8%
Residents with income below 50% of the poverty level in 2022:
This zip code:
6.1%
Whole state:
6.1%
Median number of rooms in houses and condos:
Here:
6.2
State:
6.8
Median number of rooms in apartments:
Here:
4.9
State:
4.3
Notable locations in this zip code not listed on our city pages
Notable locations in zip code 16936: Millerton Volunteer Fire Department (A), Big Elm Volunteer Fire Department (B). Display/hide their locations on the map
Size of family households: 328 2-persons, 139 3-persons, 100 4-persons, 38 5-persons, 47 6-persons
Size of nonfamily households: 240 1-person, 26 2-persons
319 married couples with children.
73 single-parent households (43 men, 30 women).
97.9% of residents of 16936 zip code speak English at home.
1.4% of residents speak Spanish at home (100% very well).
0.1% of residents speak other Indo-European language at home (100% very well).
0.3% of residents speak Asian or Pacific Island language at home (100% not well).
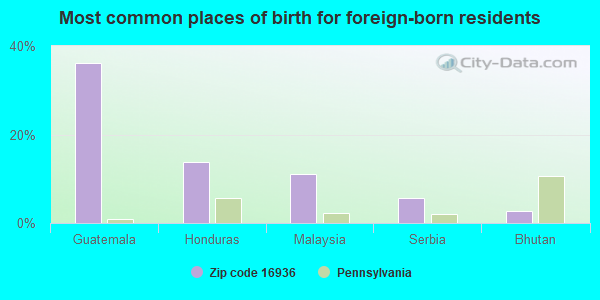
Foreign born population: 36 (1.7%) (77.9% of them are naturalized citizens)
This zip code:
1.7%
Whole state:
7.5%
36%Guatemala
14%Honduras
11%Malaysia
6%Serbia
3%Bhutan
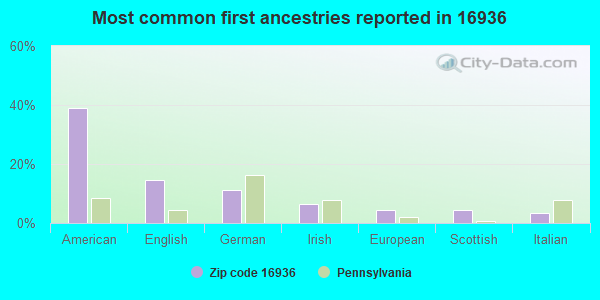
39%American
15%English
11%German
6%Irish
5%European
4%Scottish
3%Italian
Year of entry for the foreign-born population
02010 or later
212000 to 2009
41990 to 1999
20Before 1990
Facilities with environmental interests located in this zip code:
BAKERCREST HOME FOR THE ELDERLY (T-948 BAKERCREST LANE in MILLERTON, PA)
STATE MASTER (Pennsylvania database) - PWSID-2590054, DRINKING WATER PROGRAM, PCS-PA0228761, National Pollutant Discharge Elimination System Permit National Pollutant Discharge Elimination System NON-MAJOR (Tracking pollutant discharge elimination systems) - permit COMMUNITY WATER SYSTEM (SDWIS) - SDWIS-PA2590054 302, WATER TREATMENT PLANT Business SIC classification: NURSING AND PERSONAL CARE FACILITIES Alternative names: BAKERCREST PCH, DONALD BAKER
Housing units lacking complete plumbing facilities: 0.7% Housing units lacking complete kitchen facilities: 0.7%
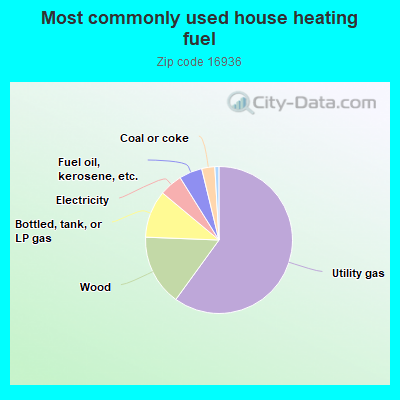
60.3%Utility gas
15.7%Wood
10.5%Bottled, tank, or LP gas
5.1%Electricity
5.1%Fuel oil, kerosene, etc.
2.9%Coal or coke
0.9%No fuel used
Population in 1990: 2,072. Population change in the 1990s: +373 (+18.0%).
Place of birth for U.S.-born residents:
This state: 992
Northeast: 984
Midwest: 22
South: 149
West: 44
67% of the 16936 zip code residents lived in the same house 5 years ago. Out of people who lived in different houses, 51% lived in this county. Out of people who lived in different counties, 50% lived in Pennsylvania.
93% of the 16936 zip code residents lived in the same house 1 year ago. Out of people who lived in different houses, 67% moved from this county. Out of people who lived in different houses, 7% moved from different county within same state. Out of people who lived in different houses, 26% moved from different state.
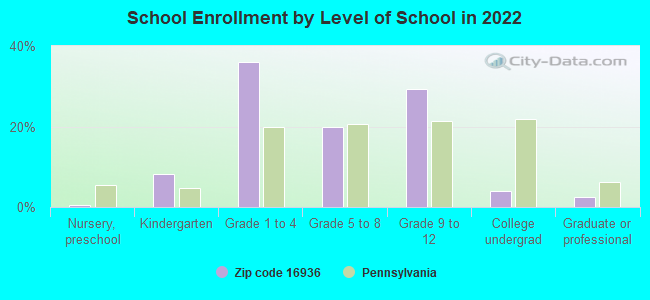
Private vs. public school enrollment:
Students in private schools in grades 1 to 8 (elementary and middle school): 46
Here:
22.8%
Pennsylvania:
15.7%
Students in private schools in grades 9 to 12 (high school):
Here:
0.0%
Pennsylvania:
13.4%
Students in private undergraduate colleges:
Here:
0.0%
Pennsylvania:
39.8%
Occupation by median earnings in the past 12 months ($)
88,904Health diagnosing and treating practitioners and other technical occupations
84,165Architecture and engineering occupations
67,362Education, training, and library occupations
65,230Building and grounds cleaning and maintenance occupations
55,967Health technologists and technicians
54,700Production occupations
Top industries in this zip code by the number of employees in 2005:

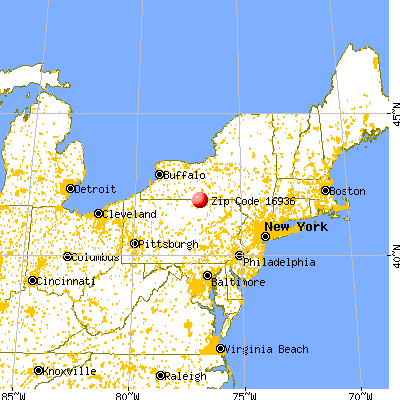


 Nearest zip codes: 14871, 16933, 16929, 16932, 16946, 16925.