Estimated zip code population in 2022: 1,031 Zip code population in 2010: 1,391 Zip code population in 2000: 1,368
Houses and condos: 553 Renter-occupied apartments: 28
% of renters here:
6%
State:
31%
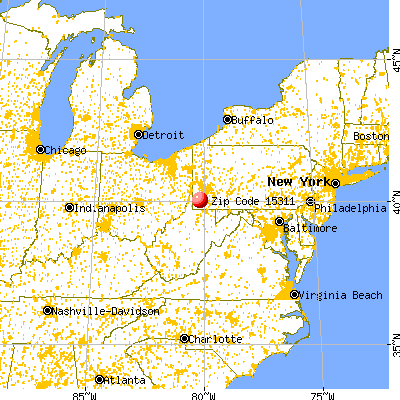
March 2022 cost of living index in zip code 15311: 87.4 (less than average, U.S. average is 100)
Land area: 23.5 sq. mi. Water area: 0.0 sq. mi.
Population density: 44 people per square mile
(very low).
OSM Map
General Map
Google Map
MSN Map
OSM Map
General Map
Google Map
MSN Map
OSM Map
General Map
Google Map
MSN Map
OSM Map
General Map
Google Map
MSN Map
Please wait while loading the map...
Real estate property taxes paid for housing units in 2022:
This zip code:
1.0% ($2,439)
Pennsylvania:
1.3% ($3,094)
Median real estate property taxes paid for housing units with mortgages in 2022: $2,606 (0.9%) Median real estate property taxes paid for housing units with no mortgage in 2022: $2,243 (1.3%)
Business Search- 14 Million verified businesses
Males: 549
(53.2%)
Females: 482
(46.8%)
For population 25 years and over in 15311:
High school or higher: 91.2%
Bachelor's degree or higher: 21.3%
Graduate or professional degree: 7.4%
Unemployed: 0.7%
Mean travel time to work (commute): 27.0 minutes
For population 15 years and over in 15311:
Never married: 15.8%
Now married: 69.8%
Separated: 0.0%
Widowed: 6.3%
Divorced: 8.0%
Zip code 15311 compared to state average:
Unemployed percentage significantly below state average.
Black race population percentage significantly below state average.
Hispanic race population percentage significantly below state average.
Median age significantly above state average.
Foreign-born population percentage significantly below state average.
Renting percentage significantly below state average.
Length of stay since moving in significantly above state average.
Averages for the 2020 tax year for zip code 15311, filed in 2021:
Average Adjusted Gross Income (AGI) in 2020: $71,508 (Individual Income Tax Returns)
Here:
$71,508
State:
$75,707
Salary/wage: $57,020 (reported on 75.4% of returns)
Here:
$57,020
State:
$62,806
(% of AGI for various income ranges: 1070.0% for AGIs below $25k, 3180.8% for AGIs $25k-50k, 6780.0% for AGIs $50k-75k, 8968.0% for AGIs $75k-100k, 14862.5% for AGIs $100k-200k)
Taxable interest for individuals: $564 (reported on 38.5% of returns)
This zip code:
$564
Pennsylvania:
$1,633
(% of AGI for various income ranges: 24.4% for AGIs below $25k, 13.3% for AGIs $25k-50k, 35.0% for AGIs $50k-75k, 34.0% for AGIs $75k-100k, 81.2% for AGIs $100k-200k)
Ordinary dividends: $1,779 (reported on 21.5% of returns)
Here:
$1,779
State:
$7,382
(% of AGI for various income ranges: 11.1% for AGIs below $25k, 17.5% for AGIs $25k-50k, 101.7% for AGIs $50k-75k, 196.2% for AGIs $100k-200k)
Net capital gain/loss in AGI: +$11,492 (reported on 18.5% of returns)
Here:
+$11,492
State:
+$23,522
(% of AGI for various income ranges: 18.9% for AGIs below $25k, 15.8% for AGIs $25k-50k, 53.3% for AGIs $50k-75k, 1638.8% for AGIs $100k-200k)
Profit/loss from business: +$11,488 (reported on 12.3% of returns)
Here:
+$11,488
State:
+$16,274
(% of AGI for various income ranges: 194.4% for AGIs below $25k, 638.3% for AGIs $50k-75k, 451.2% for AGIs $100k-200k)
Taxable individual retirement arrangement distribution: $18,678 (reported on 13.8% of returns)
15311:
$18,678
Pennsylvania:
$18,583
(% of AGI for various income ranges: 232.2% for AGIs below $25k, 835.0% for AGIs $50k-75k, 1213.8% for AGIs $100k-200k)
Total itemized deductions: $32,833 (reported on 4.6% of returns)
Here:
$32,833
State:
$34,850
(% of AGI for various income ranges: 1970.0% for AGIs $75k-100k)
Charity contributions: $8,800 (reported on 3.1% of returns)
Here:
$8,800
State:
$12,392
(% of AGI for various income ranges: 293.3% for AGIs $50k-75k)
Taxes paid: $7,967 (reported on 4.6% of returns)
15311:
$7,967
State:
$8,200
(% of AGI for various income ranges: 478.0% for AGIs $75k-100k)
Earned income credit: $1,780 (reported on 7.7% of returns)
Here:
$1,780
State:
$2,100
(% of AGI for various income ranges: 98.9% for AGIs below $25k)
Percentage of individuals using paid preparers for their 2020 taxes: 93.8%
Here:
94%
State:
92%
(% for various income ranges: 93.8% for AGIs below $25k, 93.3% for AGIs $25k-50k, 100.0% for AGIs $50k-75k, 87.5% for AGIs $75k-100k, 100.0% for AGIs $100k-200k, 66.7% for AGIs over 200k)
Averages for the 2012 tax year for zip code 15311, filed in 2013:
Average Adjusted Gross Income (AGI) in 2012: $58,549 (Individual Income Tax Returns)
Here:
$58,549
State:
$61,346
Salary/wage: $49,656 (reported on 81.4% of returns)
Here:
$49,656
State:
$51,902
(% of AGI for various income ranges: 66.8% for AGIs below $25k, 68.3% for AGIs $25k-50k, 75.0% for AGIs $50k-75k, 79.2% for AGIs $75k-100k, 103.3% for AGIs $100k-200k)
Taxable interest for individuals: $541 (reported on 38.6% of returns)
This zip code:
$541
Pennsylvania:
$1,588
(% of AGI for various income ranges: 1.1% for AGIs below $25k, 0.8% for AGIs $25k-50k, 0.4% for AGIs $50k-75k, 0.3% for AGIs $100k-200k)
Ordinary dividends: $1,150 (reported on 20.0% of returns)
Here:
$1,150
State:
$5,827
(% of AGI for various income ranges: 1.0% for AGIs below $25k, 0.5% for AGIs $25k-50k, 0.7% for AGIs $50k-75k, 0.5% for AGIs $100k-200k)
Net capital gain/loss in AGI: +$4,629 (reported on 10.0% of returns)
Here:
+$4,629
State:
+$14,495
(% of AGI for various income ranges: 1.5% for AGIs $25k-50k, 2.0% for AGIs $100k-200k)
Profit/loss from business: +$9,967 (reported on 12.9% of returns)
Here:
+$9,967
State:
+$16,268
(% of AGI for various income ranges: 7.2% for AGIs $25k-50k, 1.7% for AGIs $50k-75k, 3.1% for AGIs $100k-200k)
Taxable individual retirement arrangement distribution: $8,514 (reported on 10.0% of returns)
15311:
$8,514
Pennsylvania:
$14,550
Total itemized deductions: $19,265 (17% of AGI, reported on 24.3% of returns)
Here:
$19,265
State:
$23,538
Here:
17.4% of AGI
State:
18.4% of AGI
(% of AGI for various income ranges: 8.2% for AGIs $25k-50k, 5.6% for AGIs $50k-75k, 9.1% for AGIs $75k-100k, 15.4% for AGIs $100k-200k)
Charity contributions: $2,385 (reported on 18.6% of returns)
Here:
$2,385
State:
$4,025
(% of AGI for various income ranges: 0.6% for AGIs $25k-50k, 1.3% for AGIs $75k-100k, 1.6% for AGIs $100k-200k)
Taxes paid: $6,894 (reported on 24.3% of returns)
15311:
$6,894
State:
$9,982
(% of AGI for various income ranges: 2.0% for AGIs $25k-50k, 1.8% for AGIs $50k-75k, 2.7% for AGIs $75k-100k, 6.4% for AGIs $100k-200k)
Earned income credit: $1,300 (reported on 10.0% of returns)
Here:
$1,300
State:
$2,106
(% of AGI for various income ranges: 2.5% for AGIs below $25k, 0.5% for AGIs $25k-50k)
Percentage of individuals using paid preparers for their 2012 taxes: 57.1%
Here:
57%
State:
53%
(% for various income ranges: 52.2% for AGIs below $25k, 56.2% for AGIs $25k-50k, 58.3% for AGIs $50k-75k, 62.5% for AGIs $75k-100k, 77.8% for AGIs $100k-200k)
Averages for the 2004 tax year for zip code 15311, filed in 2005:
Average Adjusted Gross Income (AGI) in 2004: $38,864 (Individual Income Tax Returns)
Here:
$38,864
State:
$48,049
Salary/wage: $36,285 (reported on 85.9% of returns)
Here:
$36,285
State:
$42,646
(% of AGI for various income ranges: 84.0% for AGIs below $10k, 73.6% for AGIs $10k-25k, 84.0% for AGIs $25k-50k, 84.5% for AGIs $50k-75k, 82.3% for AGIs $75k-100k, 69.5% for AGIs over 100k)
Taxable interest for individuals: $743 (reported on 50.7% of returns)
This zip code:
$743
Pennsylvania:
$1,657
(% of AGI for various income ranges: 4.1% for AGIs below $10k, 3.7% for AGIs $10k-25k, 0.7% for AGIs $25k-50k, 1.0% for AGIs $50k-75k, 0.3% for AGIs $75k-100k, 0.3% for AGIs over 100k)
Taxable dividends: $1,140 (reported on 25.4% of returns)
Here:
$1,140
State:
$3,566
(% of AGI for various income ranges: 4.2% for AGIs below $10k, 2.1% for AGIs $10k-25k, 0.3% for AGIs $25k-50k, 0.4% for AGIs $50k-75k, 0.7% for AGIs $75k-100k, 0.8% for AGIs over 100k)
Net capital gain/loss: +$1,902 (reported on 14.3% of returns)
Here:
+$1,902
State:
+$9,716
(% of AGI for various income ranges: 3.3% for AGIs below $10k, 0.3% for AGIs $10k-25k, -0.4% for AGIs $25k-50k, 0.2% for AGIs $50k-75k, 3.6% for AGIs over 100k)
Profit/loss from business: +$8,000 (reported on 11.6% of returns)
Here:
+$8,000
State:
+$14,267
(% of AGI for various income ranges: 2.4% for AGIs below $10k, 0.2% for AGIs $10k-25k, 3.4% for AGIs $25k-50k, 0.2% for AGIs $50k-75k, 6.8% for AGIs over 100k)
Total itemized deductions: $15,674 (22% of AGI, reported on 21.4% of returns)
Here:
$15,674
State:
$18,804
Here:
21.7% of AGI
State:
19.5% of AGI
(% of AGI for various income ranges: 7.7% for AGIs $25k-50k, 8.6% for AGIs $50k-75k, 12.7% for AGIs $75k-100k, 12.0% for AGIs over 100k)
Charity contributions deductions: $2,294 (3% of AGI, reported on 18.4% of returns)
Here:
$2,294
State:
$3,337
Here:
3.1% of AGI
State:
3.3% of AGI
(% of AGI for various income ranges: 0.6% for AGIs $25k-50k, 0.9% for AGIs $50k-75k, 1.3% for AGIs $75k-100k, 2.6% for AGIs over 100k)
Total tax: $4,602 (reported on 74.0% of returns)
15311:
$4,602
State:
$8,008
(% of AGI for various income ranges: 2.8% for AGIs below $10k, 4.0% for AGIs $10k-25k, 6.3% for AGIs $25k-50k, 7.9% for AGIs $50k-75k, 9.9% for AGIs $75k-100k, 15.6% for AGIs over 100k)
Earned income credit: $1,462 (reported on 12.1% of returns)
Here:
$1,462
State:
$1,643
Percentage of individuals using paid preparers for their 2004 taxes: 58.3%
Here:
58%
State:
56%
(% for various income ranges: 48.6% for AGIs below $10k, 57.1% for AGIs $10k-25k, 62.4% for AGIs $25k-50k, 65.1% for AGIs $50k-75k, 57.8% for AGIs $75k-100k, 58.8% for AGIs over 100k)
Household received Food Stamps/SNAP in the past 12 months: 42 Household did not receive Food Stamps/SNAP in the past 12 months: 446
Women who had a birth in the past 12 months: 9 (9 now married, 0 unmarried) Women who did not have a birth in the past 12 months: 127 (68 now married, 58 unmarried)
Housing units in zip code 15311 with a mortgage: 233 (82 second mortgage, 19 home equity loan, 57 both second mortgage and home equity loan) Houses without a mortgage: 22
Median monthly owner costs for units with a mortgage: $1,567 Median monthly owner costs for units without a mortgage: $600
Residents with income below the poverty level in 2022:
This zip code:
3.8%
Whole state:
11.8%
Residents with income below 50% of the poverty level in 2022:
This zip code:
3.4%
Whole state:
6.1%
Median number of rooms in houses and condos:
Here:
6.4
State:
6.8
Median number of rooms in apartments:
Here:
6.7
State:
4.3
Notable locations in this zip code not listed on our city pages
Notable locations in zip code 15311: Nolton Station (A), Luellen Station (B), Amwell Township Volunteer Fire Department Station 34 (C). Display/hide their locations on the map
In group quarters: 4 (-1 institutionalized population)
Size of family households: 297 2-persons, 42 3-persons, 33 4-persons, 15 5-persons
Size of nonfamily households: 88 1-person, 15 2-persons
78 married couples with children.
3 single-parent households (3 men).
99.9% of residents of 15311 zip code speak English at home.
Foreign born population: 0 (0.0%)
:
0.0%
Whole state:
7.5%
23%American
19%English
17%German
13%Scotch-Irish
5%Irish
5%Italian
4%European
Facilities with environmental interests located in this zip code:
84 MINING HALLAM PORTAL FAC (HALLAM RD (T-477) in AMITY, PA)
STATE MASTER (Pennsylvania database) - PCS-PA0219487, National Pollutant Discharge Elimination System Permit National Pollutant Discharge Elimination System NON-MAJOR (Tracking pollutant discharge elimination systems) - permit Business SIC classification: SEWERAGE SYSTEMS Organizations: EIGHTY FOUR MINING COMPANY (CONTACT/GENERAL)
Alternative names: EIGHTY FOUR MINING CO, HALLAM PORTAL FACILITY
AMWELL TOWNSHIP MUNICIPAL AUTH (1172 AMITY RIDGE RD in AMITY, PA)
(Integrated Compliance Information System) - ICIS-03-2000-0408, FORMAL ENFORCEMENT ACTION
35.9%Utility gas
24.9%Electricity
24.6%Fuel oil, kerosene, etc.
7.7%Wood
4.4%Bottled, tank, or LP gas
2.9%Other fuel
Population in 1990: 1,458.
Place of birth for U.S.-born residents:
This state: 921
Northeast: 10
Midwest: 32
South: 58
75% of the 15311 zip code residents lived in the same house 5 years ago. Out of people who lived in different houses, 78% lived in this county. Out of people who lived in different counties, 50% lived in Pennsylvania.
97% of the 15311 zip code residents lived in the same house 1 year ago. Out of people who lived in different houses, 96% moved from this county. Out of people who lived in different houses, 8% moved from different county within same state.
Private vs. public school enrollment:
Students in private schools in grades 1 to 8 (elementary and middle school):
Here:
0.0%
Pennsylvania:
15.7%
Students in private schools in grades 9 to 12 (high school):
Here:
0.0%
Pennsylvania:
13.4%
Students in private undergraduate colleges: 19
Here:
59.5%
Pennsylvania:
39.8%
Occupation by median earnings in the past 12 months ($)
118,072Transportation occupations
95,303Management occupations
62,844Education, training, and library occupations
58,097Construction and extraction occupations
51,429Sales and related occupations
46,304Office and administrative support occupations
Top industries in this zip code by the number of employees in 2005:
Construction: All Other Specialty Trade Contractors (10-19 employees: 1 establishment)
Other Services (except Public Administration): Automotive Body, Paint, and Interior Repair and Maintenance (5-9: 1)
Other Services (except Public Administration): Religious Organizations (1-4: 2)
Construction: Residential Remodelers (1-4: 2)
Health Care and Social Assistance: Other Individual and Family Services (1-4: 1)
Professional, Scientific, and Technical Services: Other Accounting Services (1-4: 1)
Professional, Scientific, and Technical Services: Offices of Certified Public Accountants (1-4: 1)
Wholesale Trade: Other Chemical and Allied Products Merchant Wholesalers (1-4: 1)
People in group quarters in 2010:
6 people in residential treatment centers for adults
People in group quarters in 2000:
6 people in homes for the mentally retarded
Fatal accident statistics in 2014:
Fatal accident count: 1
Vehicles involved in fatal accidents: 2
Fatal accidents caused by drunken drivers: 0
Fatalities: 1
Persons involved in fatal accidents: 2
Pedestrians involved in fatal accidents: 0
Fatal accident statistics in 2013:
Fatal accident count: 1
Vehicles involved in fatal accidents: 2
Fatal accidents caused by drunken drivers: 0
Fatalities: 1
Persons involved in fatal accidents: 3
Pedestrians involved in fatal accidents: 0
Home Mortgage Disclosure Act Aggregated Statistics For Year 2009 (Based on 4 partial tracts)
A) FHA, FSA/RHS & VA Home Purchase Loans
B) Conventional Home Purchase Loans
C) Refinancings
D) Home Improvement Loans
F) Non-occupant Loans on < 5 Family Dwellings (A B C & D)
G) Loans On Manufactured Home Dwelling (A B C & D)
Number
Average Value
Number
Average Value
Number
Average Value
Number
Average Value
Number
Average Value
Number
Average Value
LOANS ORIGINATED
6
$124,912
16
$174,753
62
$133,927
15
$31,493
0
$0
2
$48,030
APPLICATIONS APPROVED, NOT ACCEPTED
1
$56,100
0
$0
5
$146,028
2
$10,150
0
$0
0
$0
APPLICATIONS DENIED
2
$76,405
3
$100,317
28
$133,775
7
$15,901
1
$53,630
4
$71,465
APPLICATIONS WITHDRAWN
0
$0
2
$65,780
15
$116,552
1
$84,890
0
$0
2
$84,215
FILES CLOSED FOR INCOMPLETENESS
0
$0
1
$95,700
4
$132,248
0
$0
0
$0
0
$0
Aggregated Statistics For Year 2008 (Based on 4 partial tracts)
A) FHA, FSA/RHS & VA Home Purchase Loans
B) Conventional Home Purchase Loans
C) Refinancings
D) Home Improvement Loans
F) Non-occupant Loans on < 5 Family Dwellings (A B C & D)
G) Loans On Manufactured Home Dwelling (A B C & D)
Number
Average Value
Number
Average Value
Number
Average Value
Number
Average Value
Number
Average Value
Number
Average Value
LOANS ORIGINATED
8
$191,394
27
$159,829
33
$149,211
16
$42,897
1
$38,060
4
$95,485
APPLICATIONS APPROVED, NOT ACCEPTED
0
$0
1
$32,170
5
$117,378
1
$41,250
0
$0
1
$32,170
APPLICATIONS DENIED
0
$0
4
$244,152
32
$107,360
12
$56,325
0
$0
3
$82,160
APPLICATIONS WITHDRAWN
1
$174,460
3
$124,237
13
$129,076
1
$49,500
1
$68,470
0
$0
FILES CLOSED FOR INCOMPLETENESS
0
$0
1
$81,690
1
$126,160
0
$0
0
$0
0
$0
Aggregated Statistics For Year 2007 (Based on 4 partial tracts)
A) FHA, FSA/RHS & VA Home Purchase Loans
B) Conventional Home Purchase Loans
C) Refinancings
D) Home Improvement Loans
F) Non-occupant Loans on < 5 Family Dwellings (A B C & D)
G) Loans On Manufactured Home Dwelling (A B C & D)
Number
Average Value
Number
Average Value
Number
Average Value
Number
Average Value
Number
Average Value
Number
Average Value
LOANS ORIGINATED
3
$117,933
33
$113,016
53
$111,362
15
$57,525
2
$152,955
6
$55,620
APPLICATIONS APPROVED, NOT ACCEPTED
0
$0
3
$139,357
18
$107,189
4
$33,950
0
$0
3
$57,227
APPLICATIONS DENIED
0
$0
19
$113,761
63
$128,002
17
$70,323
5
$121,276
11
$66,637
APPLICATIONS WITHDRAWN
0
$0
2
$117,820
16
$124,775
1
$108,900
0
$0
0
$0
FILES CLOSED FOR INCOMPLETENESS
0
$0
0
$0
7
$182,336
0
$0
0
$0
0
$0
Aggregated Statistics For Year 2006 (Based on 4 partial tracts)
B) Conventional Home Purchase Loans
C) Refinancings
D) Home Improvement Loans
F) Non-occupant Loans on < 5 Family Dwellings (A B C & D)
G) Loans On Manufactured Home Dwelling (A B C & D)
Number
Average Value
Number
Average Value
Number
Average Value
Number
Average Value
Number
Average Value
LOANS ORIGINATED
35
$122,687
67
$99,862
28
$36,102
2
$102,590
7
$49,537
APPLICATIONS APPROVED, NOT ACCEPTED
5
$89,052
17
$77,591
2
$35,655
0
$0
1
$52,390
APPLICATIONS DENIED
13
$68,360
63
$97,691
18
$39,622
0
$0
5
$44,888
APPLICATIONS WITHDRAWN
4
$115,992
37
$127,754
3
$38,967
0
$0
0
$0
FILES CLOSED FOR INCOMPLETENESS
0
$0
6
$103,582
0
$0
0
$0
1
$127,050
Aggregated Statistics For Year 2005 (Based on 4 partial tracts)
A) FHA, FSA/RHS & VA Home Purchase Loans
B) Conventional Home Purchase Loans
C) Refinancings
D) Home Improvement Loans
F) Non-occupant Loans on < 5 Family Dwellings (A B C & D)
G) Loans On Manufactured Home Dwelling (A B C & D)
Number
Average Value
Number
Average Value
Number
Average Value
Number
Average Value
Number
Average Value
Number
Average Value
LOANS ORIGINATED
3
$90,427
25
$103,858
72
$95,778
14
$36,961
3
$24,260
4
$54,722
APPLICATIONS APPROVED, NOT ACCEPTED
0
$0
2
$62,595
15
$95,206
5
$43,488
0
$0
1
$28,660
APPLICATIONS DENIED
0
$0
10
$50,856
70
$101,696
16
$41,270
3
$110,457
6
$24,333
APPLICATIONS WITHDRAWN
0
$0
6
$65,940
31
$119,017
3
$104,060
2
$95,410
0
$0
FILES CLOSED FOR INCOMPLETENESS
0
$0
2
$57,595
4
$179,380
0
$0
0
$0
0
$0
Aggregated Statistics For Year 2004 (Based on 4 partial tracts)
A) FHA, FSA/RHS & VA Home Purchase Loans
B) Conventional Home Purchase Loans
C) Refinancings
D) Home Improvement Loans
F) Non-occupant Loans on < 5 Family Dwellings (A B C & D)
G) Loans On Manufactured Home Dwelling (A B C & D)
Number
Average Value
Number
Average Value
Number
Average Value
Number
Average Value
Number
Average Value
Number
Average Value
LOANS ORIGINATED
2
$90,865
42
$125,238
90
$93,075
26
$27,711
5
$81,388
8
$81,544
APPLICATIONS APPROVED, NOT ACCEPTED
0
$0
7
$145,839
16
$95,778
4
$32,548
0
$0
1
$61,050
APPLICATIONS DENIED
2
$81,675
7
$100,421
56
$94,998
11
$30,665
0
$0
5
$94,002
APPLICATIONS WITHDRAWN
0
$0
3
$109,730
26
$92,828
2
$34,465
0
$0
2
$46,660
FILES CLOSED FOR INCOMPLETENESS
0
$0
1
$170,240
9
$103,623
0
$0
0
$0
0
$0
Aggregated Statistics For Year 2003 (Based on 4 partial tracts)
A) FHA, FSA/RHS & VA Home Purchase Loans
B) Conventional Home Purchase Loans
C) Refinancings
D) Home Improvement Loans
F) Non-occupant Loans on < 5 Family Dwellings (A B C & D)
Number
Average Value
Number
Average Value
Number
Average Value
Number
Average Value
Number
Average Value
LOANS ORIGINATED
2
$80,375
40
$95,528
167
$103,060
20
$48,864
4
$40,970
APPLICATIONS APPROVED, NOT ACCEPTED
0
$0
4
$98,498
28
$94,314
6
$32,610
0
$0
APPLICATIONS DENIED
1
$68,470
13
$42,908
76
$117,816
12
$57,865
2
$31,760
APPLICATIONS WITHDRAWN
0
$0
2
$53,365
26
$98,286
4
$24,165
1
$13,200
FILES CLOSED FOR INCOMPLETENESS
0
$0
4
$105,378
6
$117,970
1
$37,130
0
$0
Aggregated Statistics For Year 2002 (Based on 4 partial tracts)
A) FHA, FSA/RHS & VA Home Purchase Loans
B) Conventional Home Purchase Loans
C) Refinancings
D) Home Improvement Loans
F) Non-occupant Loans on < 5 Family Dwellings (A B C & D)
Number
Average Value
Number
Average Value
Number
Average Value
Number
Average Value
Number
Average Value
LOANS ORIGINATED
0
$0
35
$110,581
118
$95,798
10
$19,173
4
$52,690
APPLICATIONS APPROVED, NOT ACCEPTED
0
$0
6
$69,575
37
$77,869
5
$48,766
0
$0
APPLICATIONS DENIED
1
$81,090
10
$50,234
56
$72,135
10
$18,207
2
$41,725
APPLICATIONS WITHDRAWN
1
$41,250
5
$84,778
23
$66,214
2
$22,410
1
$97,450
FILES CLOSED FOR INCOMPLETENESS
0
$0
2
$39,405
9
$108,592
0
$0
0
$0
Aggregated Statistics For Year 2001 (Based on 4 partial tracts)
A) FHA, FSA/RHS & VA Home Purchase Loans
B) Conventional Home Purchase Loans
C) Refinancings
D) Home Improvement Loans
E) Loans on Dwellings For 5+ Families
F) Non-occupant Loans on < 5 Family Dwellings (A B C & D)
Number
Average Value
Number
Average Value
Number
Average Value
Number
Average Value
Number
Average Value
Number
Average Value
LOANS ORIGINATED
2
$70,965
35
$82,853
108
$69,447
21
$19,115
0
$0
1
$27,290
APPLICATIONS APPROVED, NOT ACCEPTED
1
$71,450
13
$34,384
41
$83,295
5
$23,660
1
$239,250
1
$234,830
APPLICATIONS DENIED
0
$0
25
$36,356
70
$81,768
13
$38,785
0
$0
3
$64,193
APPLICATIONS WITHDRAWN
1
$61,050
2
$77,465
31
$93,904
4
$18,055
0
$0
0
$0
FILES CLOSED FOR INCOMPLETENESS
0
$0
0
$0
7
$69,194
0
$0
0
$0
0
$0
Aggregated Statistics For Year 2000 (Based on 4 partial tracts)
A) FHA, FSA/RHS & VA Home Purchase Loans
B) Conventional Home Purchase Loans
C) Refinancings
D) Home Improvement Loans
F) Non-occupant Loans on < 5 Family Dwellings (A B C & D)
Number
Average Value
Number
Average Value
Number
Average Value
Number
Average Value
Number
Average Value
LOANS ORIGINATED
1
$118,680
28
$95,798
56
$55,866
25
$25,931
6
$47,250
APPLICATIONS APPROVED, NOT ACCEPTED
1
$35,480
13
$62,111
24
$79,519
6
$23,157
0
$0
APPLICATIONS DENIED
0
$0
20
$39,405
44
$56,815
12
$19,676
2
$22,635
APPLICATIONS WITHDRAWN
1
$74,250
1
$82,500
18
$74,914
2
$38,065
0
$0
FILES CLOSED FOR INCOMPLETENESS
0
$0
1
$46,200
6
$60,678
1
$19,800
1
$39,600
Aggregated Statistics For Year 1999 (Based on 2 partial tracts)
A) FHA, FSA/RHS & VA Home Purchase Loans
B) Conventional Home Purchase Loans
C) Refinancings
D) Home Improvement Loans
F) Non-occupant Loans on < 5 Family Dwellings (A B C & D)


 Nearest zip codes: 15345, 15329, 15360, 15301, 15324, 15322.


