Estimated zip code population in 2022: 2,058 Zip code population in 2010: 1,886 Zip code population in 2000: 2,086
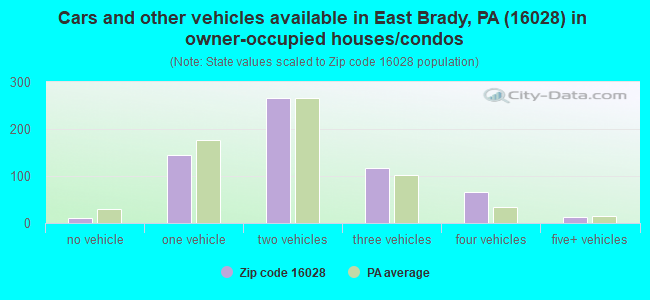
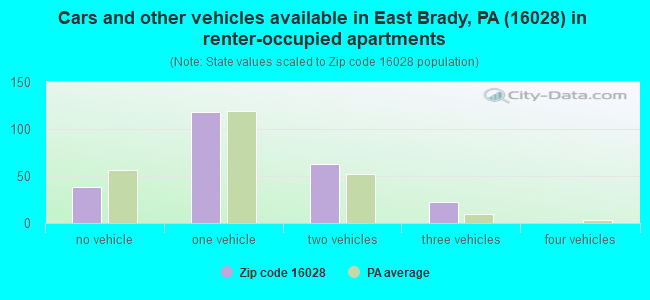
Houses and condos: 1,100 Renter-occupied apartments: 241
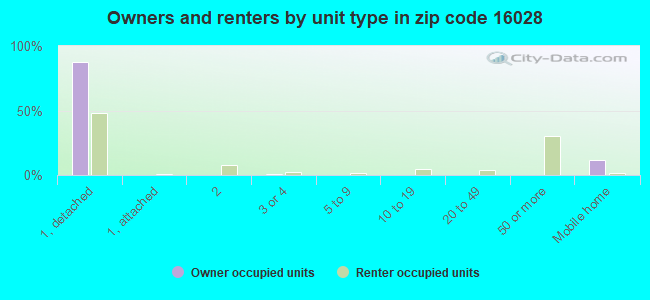
% of renters here:
28%
State:
31%
March 2022 cost of living index in zip code 16028: 90.5 (less than average, U.S. average is 100)
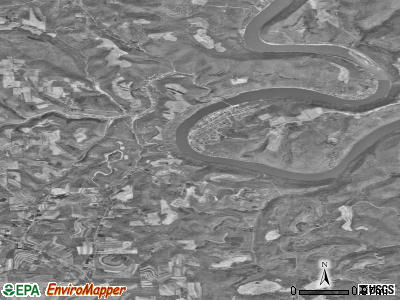
Land area: 15.9 sq. mi. Water area: 0.5 sq. mi.
Population density: 129 people per square mile
(very low).
OSM Map
General Map
Google Map
MSN Map
OSM Map
General Map
Google Map
MSN Map
OSM Map
General Map
Google Map
MSN Map
OSM Map
General Map
Google Map
MSN Map
Please wait while loading the map...
Real estate property taxes paid for housing units in 2022:
This zip code:
0.9% ($1,312)
Pennsylvania:
1.3% ($3,094)
Median real estate property taxes paid for housing units with mortgages in 2022: $1,589 (1.0%) Median real estate property taxes paid for housing units with no mortgage in 2022: $1,064 (0.9%)
Business Search- 14 Million verified businesses
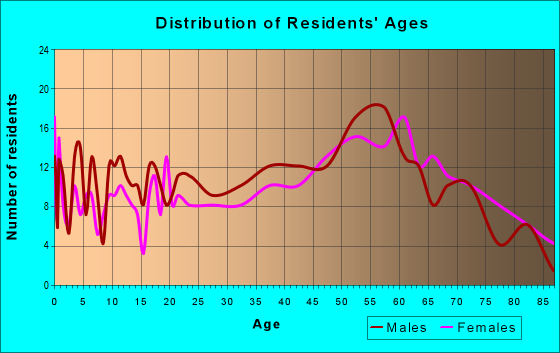
Males: 1,004
(48.8%)
Females: 1,053
(51.2%)
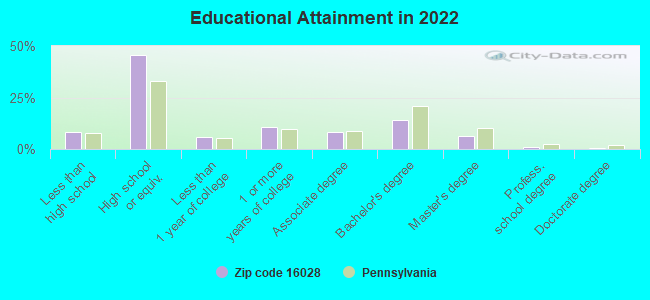
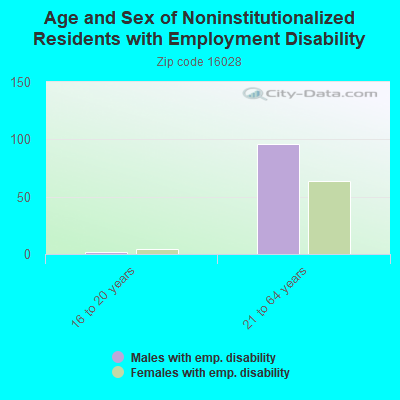
For population 25 years and over in 16028:
High school or higher: 90.9%
Bachelor's degree or higher: 21.8%
Graduate or professional degree: 7.7%
Unemployed: 3.2%
Mean travel time to work (commute): 32.1 minutes
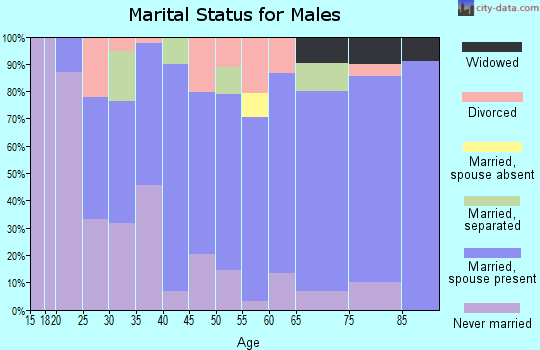
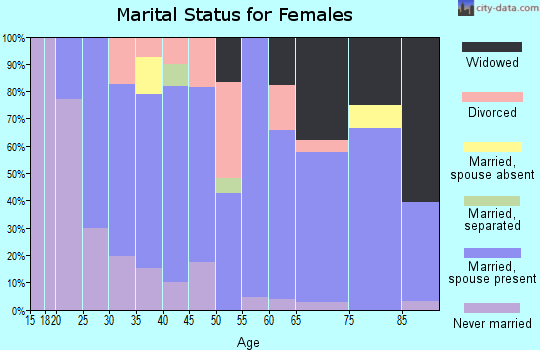
For population 15 years and over in 16028:
Never married: 24.9%
Now married: 52.8%
Separated: 0.9%
Widowed: 10.4%
Divorced: 11.0%
Zip code 16028 compared to state average:
Median house value below state average.
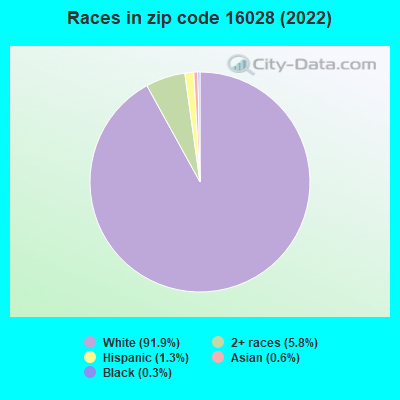
Black race population percentage significantly below state average.
Hispanic race population percentage significantly below state average.
Foreign-born population percentage significantly below state average.
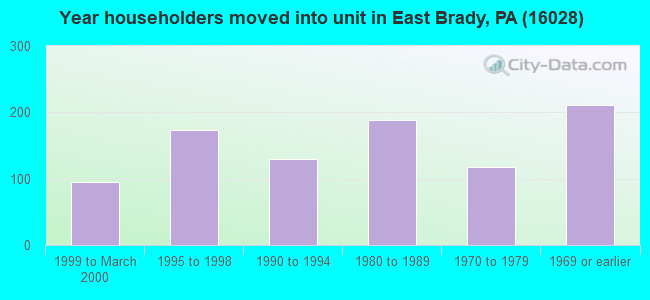
Length of stay since moving in above state average.
Number of college students below state average.
Percentage of population with a bachelor's degree or higher below state average.
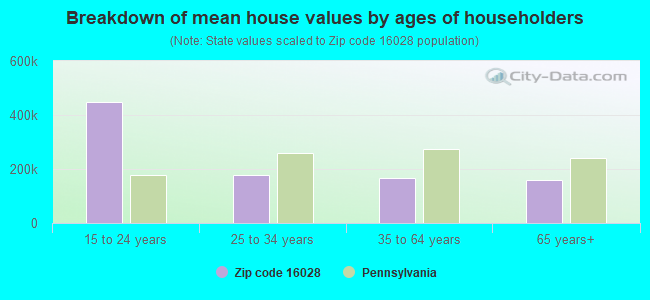
Estimated median house/condo value in 2022: $145,976
16028:
$145,976
Pennsylvania:
$245,500
According to our research of Pennsylvania and other state lists, there were 2 registered sex offenders living in 16028 zip code as of May 20, 2024. The ratio of all residents to sex offenders in zip code 16028 is 973 to 1. The ratio of registered sex offenders to all residents in this zip code is lower than the state average.
Median resident age:
This zip code:
43.3 years
Pennsylvania median age:
40.9 years
Average household size:
This zip code:
2.3 people
Pennsylvania:
2.4 people
Averages for the 2020 tax year for zip code 16028, filed in 2021:
Average Adjusted Gross Income (AGI) in 2020: $53,196 (Individual Income Tax Returns)
Here:
$53,196
State:
$75,707
Salary/wage: $46,584 (reported on 75.3% of returns)
Here:
$46,584
State:
$62,806
(% of AGI for various income ranges: 946.0% for AGIs below $25k, 3032.2% for AGIs $25k-50k, 5558.2% for AGIs $50k-75k, 6900.0% for AGIs $75k-100k, 13566.7% for AGIs $100k-200k)
Taxable interest for individuals: $338 (reported on 34.1% of returns)
This zip code:
$338
Pennsylvania:
$1,633
(% of AGI for various income ranges: 11.0% for AGIs below $25k, 5.0% for AGIs $25k-50k, 9.1% for AGIs $50k-75k, 38.3% for AGIs $75k-100k, 37.8% for AGIs $100k-200k)
Ordinary dividends: $3,927 (reported on 17.6% of returns)
Here:
$3,927
State:
$7,382
(% of AGI for various income ranges: 22.0% for AGIs below $25k, 42.8% for AGIs $25k-50k, 114.5% for AGIs $50k-75k, 380.0% for AGIs $100k-200k)
Net capital gain/loss in AGI: +$5,264 (reported on 12.9% of returns)
Here:
+$5,264
State:
+$23,522
(% of AGI for various income ranges: 35.6% for AGIs $25k-50k, 116.4% for AGIs $50k-75k, 441.1% for AGIs $100k-200k)
Profit/loss from business: +$6,956 (reported on 10.6% of returns)
Here:
+$6,956
State:
+$16,274
(% of AGI for various income ranges: 79.5% for AGIs below $25k, 218.9% for AGIs $25k-50k, 121.7% for AGIs $75k-100k)
Taxable individual retirement arrangement distribution: $15,655 (reported on 12.9% of returns)
16028:
$15,655
Pennsylvania:
$18,583
(% of AGI for various income ranges: 158.5% for AGIs below $25k, 284.5% for AGIs $50k-75k, 1820.0% for AGIs $75k-100k)
Earned income credit: $1,586 (reported on 16.5% of returns)
Here:
$1,586
State:
$2,100
(% of AGI for various income ranges: 63.5% for AGIs below $25k, 52.8% for AGIs $25k-50k)
Percentage of individuals using paid preparers for their 2020 taxes: 91.8%
Here:
92%
State:
92%
(% for various income ranges: 86.2% for AGIs below $25k, 95.2% for AGIs $25k-50k, 93.3% for AGIs $50k-75k, 100.0% for AGIs $75k-100k, 91.7% for AGIs $100k-200k)
Averages for the 2012 tax year for zip code 16028, filed in 2013:
Average Adjusted Gross Income (AGI) in 2012: $42,663 (Individual Income Tax Returns)
Here:
$42,663
State:
$61,346
Salary/wage: $39,690 (reported on 80.7% of returns)
Here:
$39,690
State:
$51,902
(% of AGI for various income ranges: 64.7% for AGIs below $25k, 72.3% for AGIs $25k-50k, 82.5% for AGIs $50k-75k, 78.8% for AGIs $75k-100k, 73.2% for AGIs $100k-200k)
Taxable interest for individuals: $693 (reported on 34.9% of returns)
This zip code:
$693
Pennsylvania:
$1,588
(% of AGI for various income ranges: 1.7% for AGIs below $25k, 0.7% for AGIs $25k-50k, 0.3% for AGIs $50k-75k, 0.3% for AGIs $75k-100k, 0.3% for AGIs $100k-200k)
Ordinary dividends: $1,967 (reported on 21.7% of returns)
Here:
$1,967
State:
$5,827
(% of AGI for various income ranges: 2.3% for AGIs below $25k, 1.8% for AGIs $25k-50k, 0.5% for AGIs $50k-75k, 1.1% for AGIs $75k-100k)
Net capital gain/loss in AGI: +$133 (reported on 10.8% of returns)
Here:
+$133
State:
+$14,495
(% of AGI for various income ranges: 0.2% for AGIs $25k-50k)
Profit/loss from business: +$5,289 (reported on 10.8% of returns)
Here:
+$5,289
State:
+$16,268
(% of AGI for various income ranges: 4.2% for AGIs below $25k, 2.2% for AGIs $25k-50k, 1.9% for AGIs $75k-100k)
Taxable individual retirement arrangement distribution: $8,633 (reported on 14.5% of returns)
16028:
$8,633
Pennsylvania:
$14,550
(% of AGI for various income ranges: 4.2% for AGIs below $25k, 4.1% for AGIs $25k-50k, 8.3% for AGIs $75k-100k)
Total itemized deductions: $16,342 (20% of AGI, reported on 14.5% of returns)
Here:
$16,342
State:
$23,538
Here:
19.6% of AGI
State:
18.4% of AGI
(% of AGI for various income ranges: 5.0% for AGIs $25k-50k, 4.5% for AGIs $50k-75k, 5.9% for AGIs $75k-100k, 9.7% for AGIs $100k-200k)
Charity contributions: $2,838 (reported on 9.6% of returns)
Here:
$2,838
State:
$4,025
Taxes paid: $5,175 (reported on 14.5% of returns)
16028:
$5,175
State:
$9,982
(% of AGI for various income ranges: 0.9% for AGIs $25k-50k, 1.4% for AGIs $50k-75k, 1.9% for AGIs $75k-100k, 3.7% for AGIs $100k-200k)
Earned income credit: $1,946 (reported on 15.7% of returns)
Here:
$1,946
State:
$2,106
(% of AGI for various income ranges: 4.2% for AGIs below $25k, 0.9% for AGIs $25k-50k)
Percentage of individuals using paid preparers for their 2012 taxes: 51.8%
Here:
52%
State:
53%
(% for various income ranges: 42.9% for AGIs below $25k, 54.5% for AGIs $25k-50k, 61.5% for AGIs $50k-75k, 57.1% for AGIs $75k-100k, 66.7% for AGIs $100k-200k)
Averages for the 2004 tax year for zip code 16028, filed in 2005:
Average Adjusted Gross Income (AGI) in 2004: $31,633 (Individual Income Tax Returns)
Here:
$31,633
State:
$48,049
Salary/wage: $31,280 (reported on 78.1% of returns)
Here:
$31,280
State:
$42,646
(% of AGI for various income ranges: 80.0% for AGIs below $10k, 65.2% for AGIs $10k-25k, 75.5% for AGIs $25k-50k, 88.1% for AGIs $50k-75k, 81.8% for AGIs $75k-100k, 58.8% for AGIs over 100k)
Taxable interest for individuals: $1,167 (reported on 44.4% of returns)
This zip code:
$1,167
Pennsylvania:
$1,657
(% of AGI for various income ranges: 3.1% for AGIs below $10k, 4.4% for AGIs $10k-25k, 1.6% for AGIs $25k-50k, 0.4% for AGIs $50k-75k, 1.5% for AGIs $75k-100k, 0.5% for AGIs over 100k)
Taxable dividends: $1,920 (reported on 20.2% of returns)
Here:
$1,920
State:
$3,566
(% of AGI for various income ranges: 2.2% for AGIs below $10k, 2.1% for AGIs $10k-25k, 1.3% for AGIs $25k-50k, 0.2% for AGIs $50k-75k, 1.0% for AGIs $75k-100k, 2.8% for AGIs over 100k)
Net capital gain/loss: +$1,272 (reported on 13.4% of returns)
Here:
+$1,272
State:
+$9,716
(% of AGI for various income ranges: -2.5% for AGIs below $10k, 0.8% for AGIs $10k-25k, 0.7% for AGIs $25k-50k, -0.1% for AGIs $50k-75k, 1.8% for AGIs $75k-100k)
Profit/loss from business: +$3,768 (reported on 12.0% of returns)
Here:
+$3,768
State:
+$14,267
(% of AGI for various income ranges: 5.6% for AGIs below $10k, 4.2% for AGIs $10k-25k, 2.0% for AGIs $25k-50k, 0.3% for AGIs $50k-75k)
IRA payment deduction: $2,238 (reported on 2.3% of returns)
16028:
$2,238
Pennsylvania:
$2,903
Total itemized deductions: $12,821 (21% of AGI, reported on 13.2% of returns)
Here:
$12,821
State:
$18,804
Here:
21.2% of AGI
State:
19.5% of AGI
(% of AGI for various income ranges: 4.5% for AGIs $10k-25k, 4.1% for AGIs $25k-50k, 6.3% for AGIs $50k-75k, 6.0% for AGIs $75k-100k, 8.4% for AGIs over 100k)
Charity contributions deductions: $2,030 (3% of AGI, reported on 10.7% of returns)
Here:
$2,030
State:
$3,337
Here:
3.1% of AGI
State:
3.3% of AGI
(% of AGI for various income ranges: 0.8% for AGIs $10k-25k, 0.2% for AGIs $25k-50k, 0.5% for AGIs $50k-75k, 0.8% for AGIs $75k-100k, 2.5% for AGIs over 100k)
Total tax: $3,589 (reported on 72.0% of returns)
16028:
$3,589
State:
$8,008
(% of AGI for various income ranges: 2.6% for AGIs below $10k, 3.9% for AGIs $10k-25k, 6.5% for AGIs $25k-50k, 8.9% for AGIs $50k-75k, 10.8% for AGIs $75k-100k, 15.3% for AGIs over 100k)
Earned income credit: $1,365 (reported on 17.0% of returns)
Here:
$1,365
State:
$1,643
Percentage of individuals using paid preparers for their 2004 taxes: 56.5%
Here:
56%
State:
56%
(% for various income ranges: 48.9% for AGIs below $10k, 54.3% for AGIs $10k-25k, 62.3% for AGIs $25k-50k, 54.9% for AGIs $50k-75k, 66.7% for AGIs $75k-100k, 81.0% for AGIs over 100k)
Household received Food Stamps/SNAP in the past 12 months: 180 Household did not receive Food Stamps/SNAP in the past 12 months: 688
Women who had a birth in the past 12 months: 19 (4 now married, 13 unmarried) Women who did not have a birth in the past 12 months: 351 (174 now married, 175 unmarried)
Housing units in zip code 16028 with a mortgage: 316 (28 second mortgage, 14 both second mortgage and home equity loan) Houses without a mortgage: 39
Median monthly owner costs for units with a mortgage: $1,190 Median monthly owner costs for units without a mortgage: $396
Residents with income below the poverty level in 2022:
This zip code:
8.1%
Whole state:
11.8%
Residents with income below 50% of the poverty level in 2022:
This zip code:
4.5%
Whole state:
6.1%
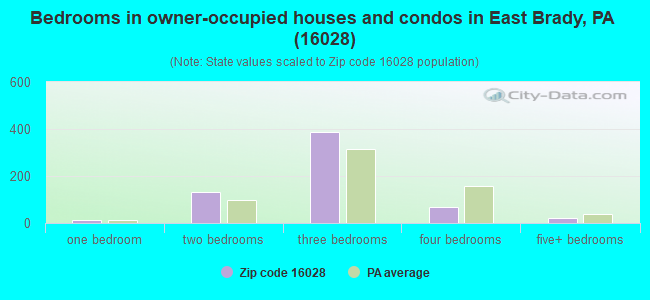
Median number of rooms in houses and condos:
Here:
6.3
State:
6.8
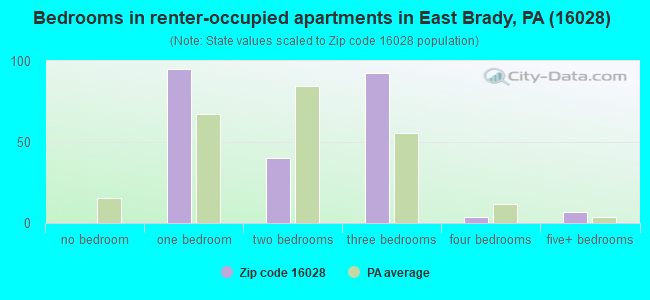
Median number of rooms in apartments:
Here:
4.8
State:
4.3
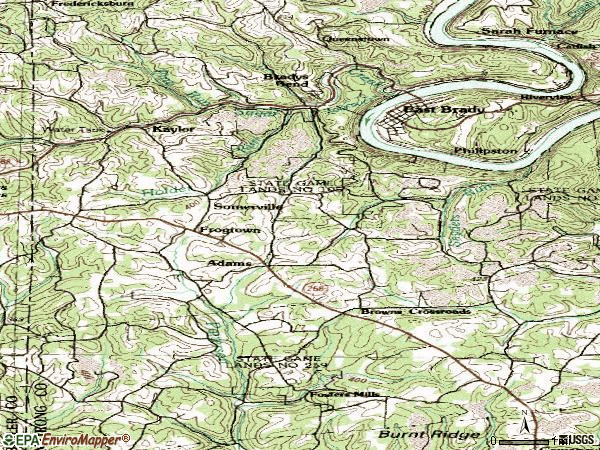
Notable locations in this zip code not listed on our city pages
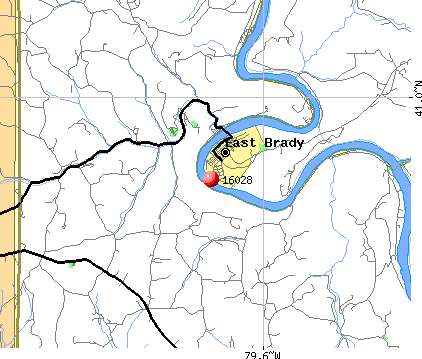
Notable locations in zip code 16028: East Brady Volunteer Fire Department (A), Sugarcreek Township Volunteer Fire Department (B). Display/hide their locations on the map
Streams, rivers, and creeks: Holder Run (A), Sugar Creek (B), Hart Run (C), Snyders Run (D), Cove Run (E), Whiskey Run (F). Display/hide their locations on the map
In group quarters: 34 (-1 institutionalized population)
Size of family households: 259 2-persons, 137 3-persons, 105 4-persons, 35 5-persons, 7 6-persons, 15 7-or-more-persons
Size of nonfamily households: 270 1-person, 28 2-persons, 3 3-persons
284 married couples with children.
106 single-parent households (47 men, 59 women).
98.3% of residents of 16028 zip code speak English at home.
0.6% of residents speak Spanish at home (100% very well).
0.6% of residents speak other Indo-European language at home (100% very well).
0.2% of residents speak Asian or Pacific Island language at home (100% very well).
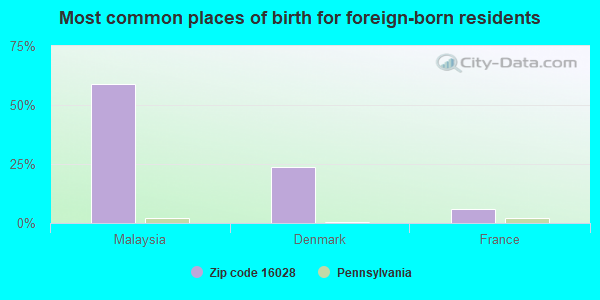
Foreign born population: 17 (0.9%) (100.0% of them are naturalized citizens)
This zip code:
0.9%
Whole state:
7.5%
59%Malaysia
24%Denmark
6%France
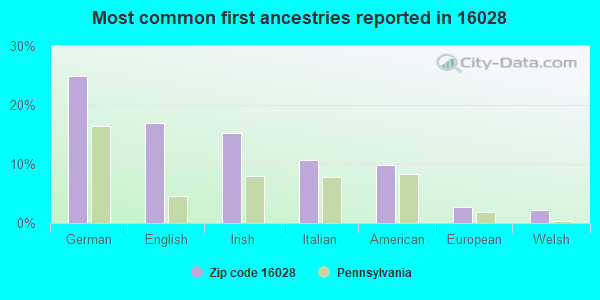
25%German
17%English
15%Irish
11%Italian
10%American
3%European
2%Welsh
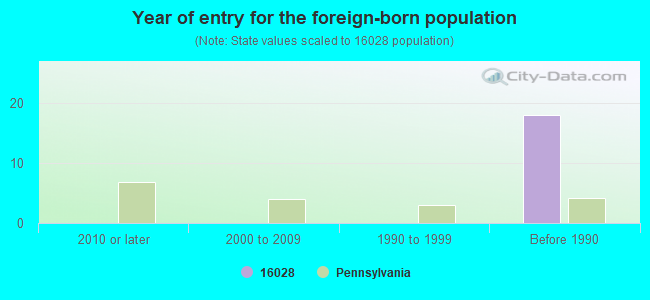
Year of entry for the foreign-born population
02010 or later
02000 to 2009
01990 to 1999
18Before 1990
Facilities with environmental interests located in this zip code:
BEMISHS AUTO BODY (RT268 .5 MI N KITANNING HOLLOW in EAST BRADY, PA)
Conditionally Exempt Small Quantity Generators, less than 100 kg/month of hazardous waste (Resource Conservation and Recovery Act (tracking hazardous waste)) - notification Organizations: BEMISH BRUCE (CONTACT/OWNER)
Housing units lacking complete plumbing facilities: 5.6% Housing units lacking complete kitchen facilities: 5.2%
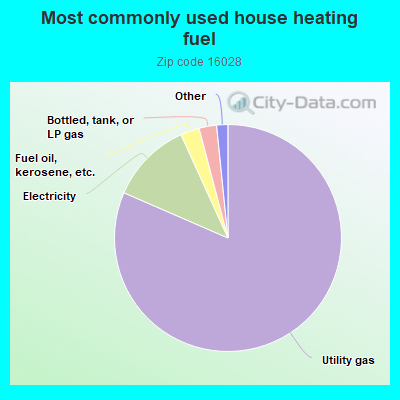
81.7%Utility gas
11.7%Electricity
2.7%Fuel oil, kerosene, etc.
2.5%Bottled, tank, or LP gas
0.6%Coal or coke
0.6%Wood
Population in 1990: 2,069. Population change in the 1990s: +17 (+0.8%).
Place of birth for U.S.-born residents:
This state: 1,837
Northeast: 14
Midwest: 56
South: 85
West: 27
72% of the 16028 zip code residents lived in the same house 5 years ago. Out of people who lived in different houses, 45% lived in this county. Out of people who lived in different counties, 50% lived in Pennsylvania.
94% of the 16028 zip code residents lived in the same house 1 year ago. Out of people who lived in different houses, 34% moved from this county. Out of people who lived in different houses, 65% moved from different county within same state. Out of people who lived in different houses, 1% moved from different state.
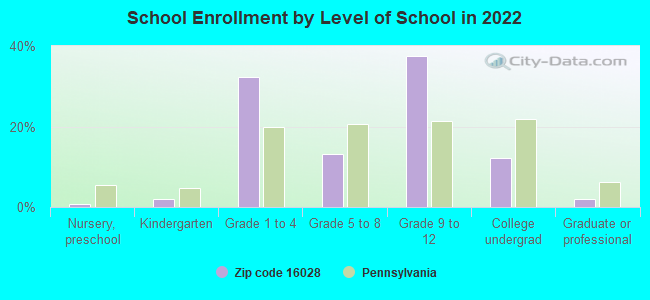
Private vs. public school enrollment:
Students in private schools in grades 1 to 8 (elementary and middle school):
Here:
0.0%
Pennsylvania:
15.7%
Students in private schools in grades 9 to 12 (high school):
Here:
0.0%
Pennsylvania:
13.4%
Students in private undergraduate colleges: 15
Here:
34.2%
Pennsylvania:
39.8%
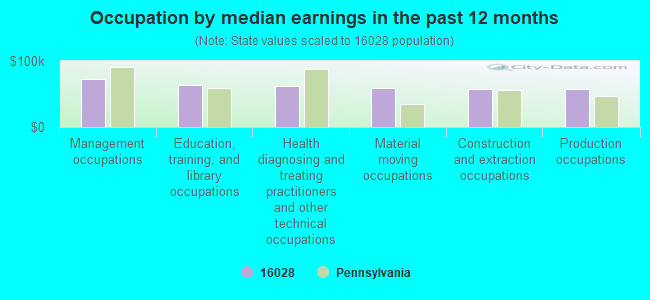
Occupation by median earnings in the past 12 months ($)
73,025Management occupations
63,522Education, training, and library occupations
62,069Health diagnosing and treating practitioners and other technical occupations
59,810Material moving occupations
57,851Construction and extraction occupations
57,421Production occupations
Companies with federal contracts located in this zip code:
HEGINBOTHAM, STEVE R (305 FERRY ST in EAST BRADY, PA; small business)
$8,517 with U.S. Army Corps of Engineers - civil program financing only for Maintenance, Repair or Alteration of Real Property -- Heating and Cooling Plants. Signed on 2003-08-25. Completion date: 2003-09-19.
Top industries in this zip code by the number of employees in 2005:
Health Care and Social Assistance: Ambulance Services (10-19 employees: 3 establishments)
Health Care and Social Assistance: Offices of Physicians (except Mental Health Specialists) (10-19: 1)
Health Care and Social Assistance: Homes for the Elderly (10-19: 1)
Accommodation and Food Services: Full-Service Restaurants (5-9: 2)
Utilities: Natural Gas Distribution (5-9: 1)
Finance and Insurance: Commercial Banking (5-9: 1)
Health Care and Social Assistance: Offices of Dentists (5-9: 1)
People in group quarters in 2000:
13 people in nursing homes
Fatal accident statistics in 2012:
Fatal accident count: 2
Vehicles involved in fatal accidents: 3
Fatal accidents caused by drunken drivers: 0
Fatalities: 2
Persons involved in fatal accidents: 3
Pedestrians involved in fatal accidents: 0
Home Mortgage Disclosure Act Aggregated Statistics For Year 2009 (Based on 2 partial tracts)
A) FHA, FSA/RHS & VA Home Purchase Loans
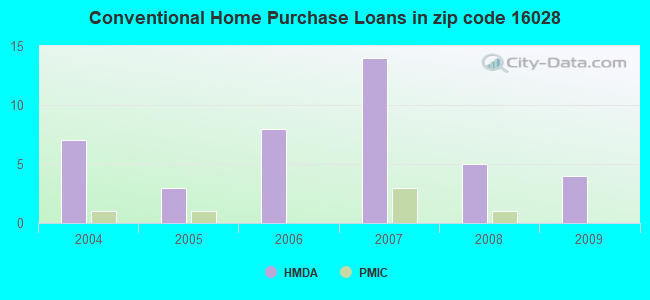
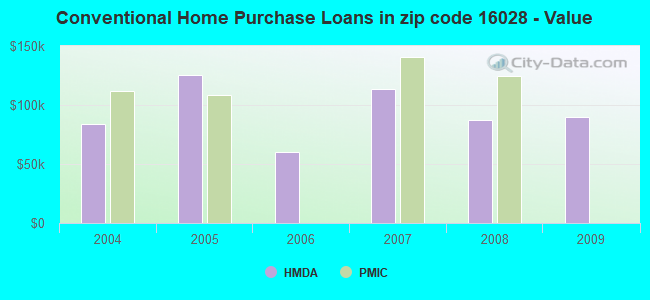
B) Conventional Home Purchase Loans
C) Refinancings
D) Home Improvement Loans
F) Non-occupant Loans on < 5 Family Dwellings (A B C & D)
Number
Average Value
Number
Average Value
Number
Average Value
Number
Average Value
Number
Average Value
LOANS ORIGINATED
4
$102,488
4
$89,522
15
$120,050
2
$87,080
1
$207,420
APPLICATIONS APPROVED, NOT ACCEPTED
0
$0
0
$0
0
$0
0
$0
0
$0
APPLICATIONS DENIED
0
$0
2
$69,465
12
$106,482
2
$26,170
0
$0
APPLICATIONS WITHDRAWN
0
$0
1
$227,970
3
$162,413
0
$0
0
$0
FILES CLOSED FOR INCOMPLETENESS
0
$0
0
$0
0
$0
0
$0
0
$0
Aggregated Statistics For Year 2008 (Based on 2 partial tracts)
A) FHA, FSA/RHS & VA Home Purchase Loans
B) Conventional Home Purchase Loans
C) Refinancings
D) Home Improvement Loans
F) Non-occupant Loans on < 5 Family Dwellings (A B C & D)
G) Loans On Manufactured Home Dwelling (A B C & D)
Number
Average Value
Number
Average Value
Number
Average Value
Number
Average Value
Number
Average Value
Number
Average Value
LOANS ORIGINATED
1
$114,960
5
$87,566
14
$82,081
3
$33,103
1
$51,370
2
$91,725
APPLICATIONS APPROVED, NOT ACCEPTED
0
$0
1
$240,200
2
$106,890
0
$0
1
$63,110
0
$0
APPLICATIONS DENIED
0
$0
2
$42,805
29
$83,097
5
$45,790
0
$0
3
$94,743
APPLICATIONS WITHDRAWN
0
$0
1
$126,210
7
$87,357
0
$0
1
$75,340
1
$71,420
FILES CLOSED FOR INCOMPLETENESS
0
$0
0
$0
1
$44,030
0
$0
0
$0
0
$0
Aggregated Statistics For Year 2007 (Based on 2 partial tracts)
B) Conventional Home Purchase Loans
C) Refinancings
D) Home Improvement Loans
F) Non-occupant Loans on < 5 Family Dwellings (A B C & D)
G) Loans On Manufactured Home Dwelling (A B C & D)
Number
Average Value
Number
Average Value
Number
Average Value
Number
Average Value
Number
Average Value
LOANS ORIGINATED
14
$113,354
16
$76,162
9
$26,906
2
$142,115
4
$76,928
APPLICATIONS APPROVED, NOT ACCEPTED
1
$56,750
4
$89,402
1
$65,550
0
$0
0
$0
APPLICATIONS DENIED
2
$77,785
23
$101,669
10
$48,724
0
$0
3
$67,673
APPLICATIONS WITHDRAWN
1
$64,570
6
$109,337
1
$63,600
0
$0
1
$55,770
FILES CLOSED FOR INCOMPLETENESS
0
$0
0
$0
0
$0
0
$0
0
$0
Aggregated Statistics For Year 2006 (Based on 2 partial tracts)
A) FHA, FSA/RHS & VA Home Purchase Loans
B) Conventional Home Purchase Loans
C) Refinancings
D) Home Improvement Loans
F) Non-occupant Loans on < 5 Family Dwellings (A B C & D)
G) Loans On Manufactured Home Dwelling (A B C & D)
Number
Average Value
Number
Average Value
Number
Average Value
Number
Average Value
Number
Average Value
Number
Average Value
LOANS ORIGINATED
1
$78,760
8
$60,294
19
$86,872
5
$43,440
1
$73,870
2
$68,735
APPLICATIONS APPROVED, NOT ACCEPTED
0
$0
2
$73,380
1
$148,720
0
$0
0
$0
1
$87,080
APPLICATIONS DENIED
0
$0
3
$150,837
27
$80,809
5
$26,222
1
$47,450
4
$83,652
APPLICATIONS WITHDRAWN
0
$0
0
$0
7
$85,890
1
$10,270
0
$0
0
$0
FILES CLOSED FOR INCOMPLETENESS
0
$0
0
$0
0
$0
0
$0
0
$0
0
$0
Aggregated Statistics For Year 2005 (Based on 2 partial tracts)
A) FHA, FSA/RHS & VA Home Purchase Loans
B) Conventional Home Purchase Loans
C) Refinancings
D) Home Improvement Loans
F) Non-occupant Loans on < 5 Family Dwellings (A B C & D)
G) Loans On Manufactured Home Dwelling (A B C & D)
Number
Average Value
Number
Average Value
Number
Average Value
Number
Average Value
Number
Average Value
Number
Average Value
LOANS ORIGINATED
2
$83,900
3
$125,560
16
$90,747
5
$18,198
1
$105,180
1
$78,760
APPLICATIONS APPROVED, NOT ACCEPTED
0
$0
0
$0
1
$107,620
1
$105,670
0
$0
0
$0
APPLICATIONS DENIED
0
$0
2
$39,380
15
$92,491
5
$31,994
1
$35,710
2
$99,065
APPLICATIONS WITHDRAWN
0
$0
1
$55,280
10
$108,602
1
$154,100
0
$0
0
$0
FILES CLOSED FOR INCOMPLETENESS
0
$0
0
$0
1
$86,590
0
$0
0
$0
0
$0
Aggregated Statistics For Year 2004 (Based on 2 partial tracts)
B) Conventional Home Purchase Loans
C) Refinancings
D) Home Improvement Loans
F) Non-occupant Loans on < 5 Family Dwellings (A B C & D)
G) Loans On Manufactured Home Dwelling (A B C & D)
Detailed PMIC statistics for the following Tracts:9803.00
2003 - 2018 National Fire Incident Reporting System (NFIRS) incidents
Based on the data from the years 2003 - 2018 the average number of fires per year is 7. The highest number of fire incidents - 18 took place in 2018, and the least - 1 in 2010. The data has a rising trend.
When looking into fire subcategories, the most incidents belonged to: Structure Fires (58.4%), and Outside Fires (26.5%).
Fire incident types reported to NFIRS in Zip Code 16028
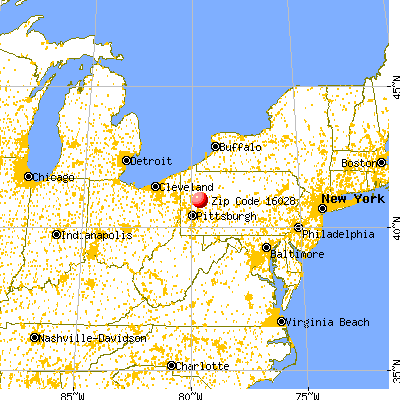


 Nearest zip codes: 16218, 16041, 16262, 16025, 16034, 16210.
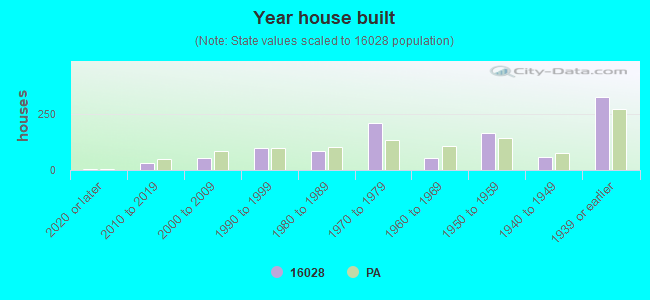


 Based on the data from the years 2003 - 2018 the average number of fires per year is 7. The highest number of fire incidents - 18 took place in 2018, and the least - 1 in 2010. The data has a rising trend.
 When looking into fire subcategories, the most incidents belonged to: Structure Fires (58.4%), and Outside Fires (26.5%).