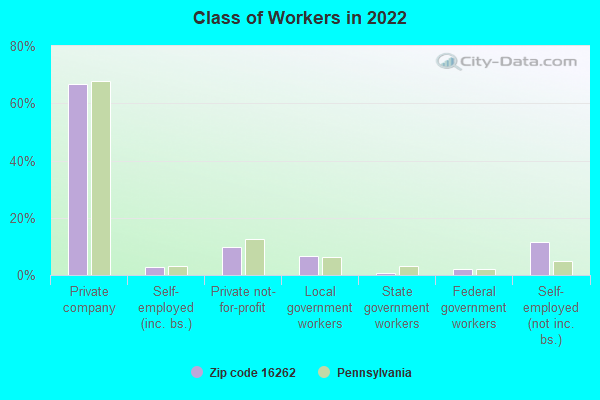
Estimated zip code population in 2022: 2,798 Zip code population in 2010: 3,007 Zip code population in 2000: 3,036
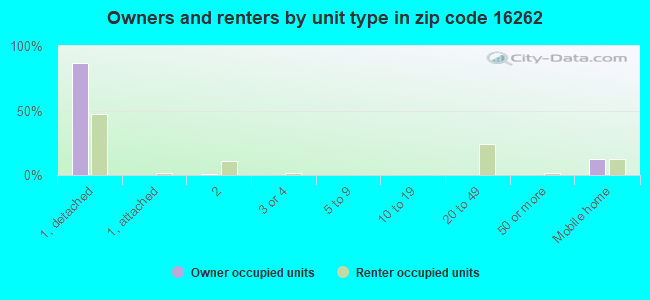
Houses and condos: 1,343 Renter-occupied apartments: 175
% of renters here:
14%
State:
31%
March 2022 cost of living index in zip code 16262: 93.2 (less than average, U.S. average is 100)
Land area: 35.0 sq. mi. Water area: 0.0 sq. mi.
Population density: 80 people per square mile
(very low).
OSM Map
General Map
Google Map
MSN Map
OSM Map
General Map
Google Map
MSN Map
OSM Map
General Map
Google Map
MSN Map
OSM Map
General Map
Google Map
MSN Map
Please wait while loading the map...
Real estate property taxes paid for housing units in 2022:
This zip code:
1.3% ($2,592)
Pennsylvania:
1.3% ($3,094)
Median real estate property taxes paid for housing units with mortgages in 2022: $2,726 (1.2%) Median real estate property taxes paid for housing units with no mortgage in 2022: $2,325 (1.4%)
Business Search- 14 Million verified businesses
Males: 1,394
(49.8%)
Females: 1,403
(50.2%)
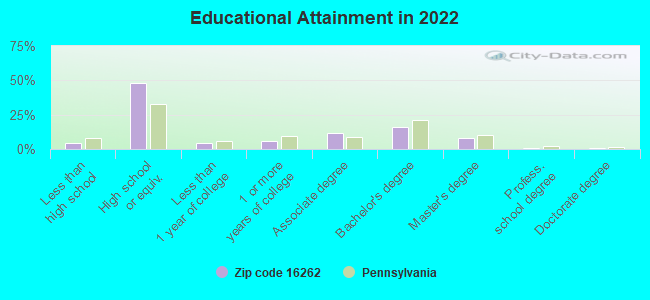
For population 25 years and over in 16262:
High school or higher: 94.9%
Bachelor's degree or higher: 25.3%
Graduate or professional degree: 9.4%
Unemployed: 1.8%
Mean travel time to work (commute): 26.1 minutes
For population 15 years and over in 16262:
Never married: 17.4%
Now married: 61.4%
Separated: 0.6%
Widowed: 10.1%
Divorced: 10.5%
Zip code 16262 compared to state average:
Unemployed percentage below state average.
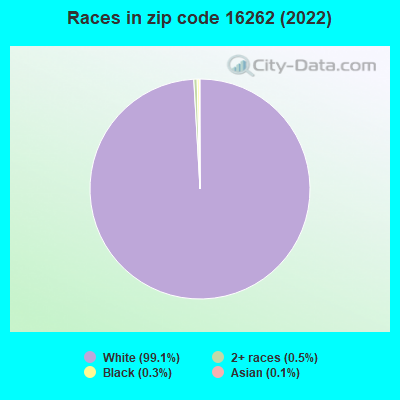
Black race population percentage significantly below state average.
Hispanic race population percentage significantly below state average.
Median age significantly above state average.
Foreign-born population percentage significantly below state average.
Renting percentage below state average.
Length of stay since moving in significantly above state average.
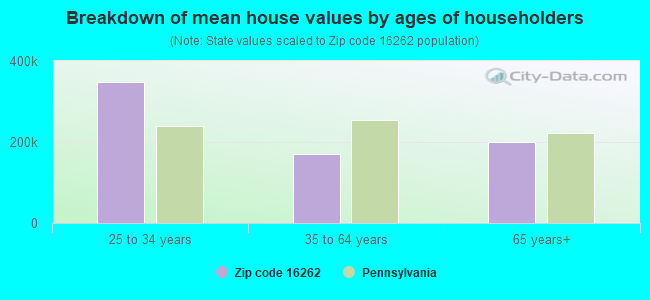
Estimated median house/condo value in 2022: $197,637
16262:
$197,637
Pennsylvania:
$245,500
According to our research of Pennsylvania and other state lists, there were 5 registered sex offenders living in 16262 zip code as of May 20, 2024. The ratio of all residents to sex offenders in zip code 16262 is 581 to 1. The ratio of registered sex offenders to all residents in this zip code is near the state average.
Median resident age:
This zip code:
50.7 years
Pennsylvania median age:
40.9 years
Average household size:
This zip code:
2.1 people
Pennsylvania:
2.4 people
Averages for the 2020 tax year for zip code 16262, filed in 2021:
Average Adjusted Gross Income (AGI) in 2020: $62,485 (Individual Income Tax Returns)
Here:
$62,485
State:
$75,707
Salary/wage: $53,335 (reported on 80.0% of returns)
Here:
$53,335
State:
$62,806
(% of AGI for various income ranges: 1014.8% for AGIs below $25k, 3298.5% for AGIs $25k-50k, 6011.9% for AGIs $50k-75k, 8710.0% for AGIs $75k-100k, 15150.8% for AGIs $100k-200k)
Taxable interest for individuals: $822 (reported on 37.7% of returns)
This zip code:
$822
Pennsylvania:
$1,633
(% of AGI for various income ranges: 37.2% for AGIs below $25k, 19.2% for AGIs $25k-50k, 51.9% for AGIs $50k-75k, 59.2% for AGIs $75k-100k, 43.8% for AGIs $100k-200k)
Ordinary dividends: $5,262 (reported on 20.0% of returns)
Here:
$5,262
State:
$7,382
(% of AGI for various income ranges: 35.2% for AGIs below $25k, 26.5% for AGIs $25k-50k, 34.4% for AGIs $50k-75k, 157.5% for AGIs $75k-100k, 163.8% for AGIs $100k-200k)
Net capital gain/loss in AGI: +$8,560 (reported on 15.4% of returns)
Here:
+$8,560
State:
+$23,522
(% of AGI for various income ranges: 33.6% for AGIs below $25k, 34.6% for AGIs $25k-50k, 96.9% for AGIs $50k-75k, 83.3% for AGIs $75k-100k, 140.0% for AGIs $100k-200k)
Profit/loss from business: +$13,013 (reported on 11.5% of returns)
Here:
+$13,013
State:
+$16,274
(% of AGI for various income ranges: 119.6% for AGIs below $25k, 82.7% for AGIs $25k-50k, 34.4% for AGIs $50k-75k, 299.2% for AGIs $75k-100k, 787.7% for AGIs $100k-200k)
Taxable individual retirement arrangement distribution: $12,520 (reported on 11.5% of returns)
16262:
$12,520
Pennsylvania:
$18,583
(% of AGI for various income ranges: 89.2% for AGIs below $25k, 131.5% for AGIs $25k-50k, 376.9% for AGIs $50k-75k, 546.2% for AGIs $100k-200k)
Total itemized deductions: $38,100 (reported on 1.5% of returns)
Here:
$38,100
State:
$34,850
(% of AGI for various income ranges: 476.2% for AGIs $50k-75k)
Taxes paid: $8,400 (reported on 1.5% of returns)
16262:
$8,400
State:
$8,200
(% of AGI for various income ranges: 105.0% for AGIs $50k-75k)
Earned income credit: $1,982 (reported on 8.5% of returns)
Here:
$1,982
State:
$2,100
(% of AGI for various income ranges: 45.6% for AGIs below $25k, 40.0% for AGIs $25k-50k)
Percentage of individuals using paid preparers for their 2020 taxes: 89.2%
Here:
89%
State:
92%
(% for various income ranges: 86.8% for AGIs below $25k, 90.9% for AGIs $25k-50k, 85.7% for AGIs $50k-75k, 93.8% for AGIs $75k-100k, 89.5% for AGIs $100k-200k, 100.0% for AGIs over 200k)
Averages for the 2012 tax year for zip code 16262, filed in 2013:
Average Adjusted Gross Income (AGI) in 2012: $59,216 (Individual Income Tax Returns)
Here:
$59,216
State:
$61,346
Salary/wage: $43,961 (reported on 81.8% of returns)
Here:
$43,961
State:
$51,902
(% of AGI for various income ranges: 61.7% for AGIs below $25k, 79.0% for AGIs $25k-50k, 77.7% for AGIs $50k-75k, 77.8% for AGIs $75k-100k, 41.0% for AGIs $100k-200k)
Taxable interest for individuals: $1,136 (reported on 42.4% of returns)
This zip code:
$1,136
Pennsylvania:
$1,588
(% of AGI for various income ranges: 1.8% for AGIs below $25k, 0.6% for AGIs $25k-50k, 0.8% for AGIs $50k-75k, 0.7% for AGIs $75k-100k, 0.8% for AGIs $100k-200k)
Ordinary dividends: $3,941 (reported on 20.5% of returns)
Here:
$3,941
State:
$5,827
(% of AGI for various income ranges: 1.7% for AGIs below $25k, 0.5% for AGIs $25k-50k, 0.9% for AGIs $50k-75k, 1.9% for AGIs $75k-100k, 1.6% for AGIs $100k-200k)
Net capital gain/loss in AGI: +$49,831 (reported on 12.1% of returns)
Here:
+$49,831
State:
+$14,495
(% of AGI for various income ranges: 0.2% for AGIs $25k-50k, 1.1% for AGIs $50k-75k, 0.7% for AGIs $75k-100k, 22.5% for AGIs $100k-200k)
Profit/loss from business: +$9,079 (reported on 10.6% of returns)
Here:
+$9,079
State:
+$16,268
(% of AGI for various income ranges: 5.9% for AGIs below $25k, 1.8% for AGIs $25k-50k, 2.1% for AGIs $50k-75k, 2.4% for AGIs $75k-100k, 0.5% for AGIs $100k-200k)
Taxable individual retirement arrangement distribution: $10,727 (reported on 11.4% of returns)
16262:
$10,727
Pennsylvania:
$14,550
(% of AGI for various income ranges: 4.0% for AGIs below $25k, 1.6% for AGIs $25k-50k, 2.2% for AGIs $50k-75k, 3.7% for AGIs $75k-100k, 1.3% for AGIs $100k-200k)
Total itemized deductions: $17,844 (12% of AGI, reported on 20.5% of returns)
Here:
$17,844
State:
$23,538
Here:
12.4% of AGI
State:
18.4% of AGI
(% of AGI for various income ranges: 7.2% for AGIs $25k-50k, 6.6% for AGIs $50k-75k, 6.6% for AGIs $75k-100k, 6.4% for AGIs $100k-200k)
Charity contributions: $3,345 (reported on 15.2% of returns)
Here:
$3,345
State:
$4,025
(% of AGI for various income ranges: 0.8% for AGIs $25k-50k, 0.8% for AGIs $50k-75k, 1.1% for AGIs $75k-100k, 0.9% for AGIs $100k-200k)
Taxes paid: $6,981 (reported on 20.5% of returns)
16262:
$6,981
State:
$9,982
(% of AGI for various income ranges: 1.6% for AGIs $25k-50k, 2.0% for AGIs $50k-75k, 2.6% for AGIs $75k-100k, 3.1% for AGIs $100k-200k)
Earned income credit: $1,717 (reported on 13.6% of returns)
Here:
$1,717
State:
$2,106
(% of AGI for various income ranges: 4.2% for AGIs below $25k, 0.7% for AGIs $25k-50k)
Percentage of individuals using paid preparers for their 2012 taxes: 52.3%
Here:
52%
State:
53%
(% for various income ranges: 43.5% for AGIs below $25k, 51.4% for AGIs $25k-50k, 59.1% for AGIs $50k-75k, 60.0% for AGIs $75k-100k, 64.3% for AGIs $100k-200k)
Averages for the 2004 tax year for zip code 16262, filed in 2005:
Average Adjusted Gross Income (AGI) in 2004: $36,403 (Individual Income Tax Returns)
Here:
$36,403
State:
$48,049
Salary/wage: $34,035 (reported on 84.3% of returns)
Here:
$34,035
State:
$42,646
(% of AGI for various income ranges: 107.2% for AGIs below $10k, 73.6% for AGIs $10k-25k, 83.0% for AGIs $25k-50k, 86.8% for AGIs $50k-75k, 80.7% for AGIs $75k-100k, 58.4% for AGIs over 100k)
Taxable interest for individuals: $1,099 (reported on 53.5% of returns)
This zip code:
$1,099
Pennsylvania:
$1,657
(% of AGI for various income ranges: 10.7% for AGIs below $10k, 3.0% for AGIs $10k-25k, 1.3% for AGIs $25k-50k, 0.7% for AGIs $50k-75k, 0.8% for AGIs $75k-100k, 2.2% for AGIs over 100k)
Taxable dividends: $2,997 (reported on 21.3% of returns)
Here:
$2,997
State:
$3,566
(% of AGI for various income ranges: 2.8% for AGIs below $10k, 1.6% for AGIs $10k-25k, 1.3% for AGIs $25k-50k, 0.8% for AGIs $50k-75k, 2.2% for AGIs $75k-100k, 3.6% for AGIs over 100k)
Net capital gain/loss: +$5,435 (reported on 13.6% of returns)
Here:
+$5,435
State:
+$9,716
(% of AGI for various income ranges: 3.4% for AGIs below $10k, 0.3% for AGIs $10k-25k, 0.1% for AGIs $25k-50k, 1.3% for AGIs $50k-75k, 0.2% for AGIs $75k-100k, 9.4% for AGIs over 100k)
Profit/loss from business: +$5,078 (reported on 12.8% of returns)
Here:
+$5,078
State:
+$14,267
(% of AGI for various income ranges: 10.0% for AGIs below $10k, 1.2% for AGIs $10k-25k, 2.1% for AGIs $25k-50k, 1.6% for AGIs $50k-75k, 0.5% for AGIs $75k-100k, 2.4% for AGIs over 100k)
IRA payment deduction: $2,579 (reported on 2.7% of returns)
16262:
$2,579
Pennsylvania:
$2,903
Total itemized deductions: $14,455 (21% of AGI, reported on 20.4% of returns)
Here:
$14,455
State:
$18,804
Here:
21.2% of AGI
State:
19.5% of AGI
(% of AGI for various income ranges: 7.7% for AGIs $10k-25k, 5.6% for AGIs $25k-50k, 9.3% for AGIs $50k-75k, 11.2% for AGIs $75k-100k, 8.7% for AGIs over 100k)
Charity contributions deductions: $2,686 (4% of AGI, reported on 17.1% of returns)
Here:
$2,686
State:
$3,337
Here:
3.8% of AGI
State:
3.3% of AGI
(% of AGI for various income ranges: 0.8% for AGIs $10k-25k, 0.8% for AGIs $25k-50k, 1.5% for AGIs $50k-75k, 1.7% for AGIs $75k-100k, 1.6% for AGIs over 100k)
Total tax: $4,423 (reported on 74.7% of returns)
16262:
$4,423
State:
$8,008
(% of AGI for various income ranges: 4.2% for AGIs below $10k, 4.2% for AGIs $10k-25k, 6.7% for AGIs $25k-50k, 8.2% for AGIs $50k-75k, 10.3% for AGIs $75k-100k, 17.7% for AGIs over 100k)
Earned income credit: $1,574 (reported on 13.9% of returns)
Here:
$1,574
State:
$1,643
Percentage of individuals using paid preparers for their 2004 taxes: 56.0%
Here:
56%
State:
56%
(% for various income ranges: 50.0% for AGIs below $10k, 52.8% for AGIs $10k-25k, 60.4% for AGIs $25k-50k, 57.1% for AGIs $50k-75k, 53.8% for AGIs $75k-100k, 79.6% for AGIs over 100k)
Household received Food Stamps/SNAP in the past 12 months: 129 Household did not receive Food Stamps/SNAP in the past 12 months: 1,141
Women who had a birth in the past 12 months: 27 (27 now married, 1 unmarried) Women who did not have a birth in the past 12 months: 469 (256 now married, 210 unmarried)
Housing units in zip code 16262 with a mortgage: 507 (53 second mortgage, 52 both second mortgage and home equity loan) Houses without a mortgage: 39
Median monthly owner costs for units with a mortgage: $1,531 Median monthly owner costs for units without a mortgage: $519
Residents with income below the poverty level in 2022:
This zip code:
7.2%
Whole state:
11.8%
Residents with income below 50% of the poverty level in 2022:
This zip code:
2.6%
Whole state:
6.1%
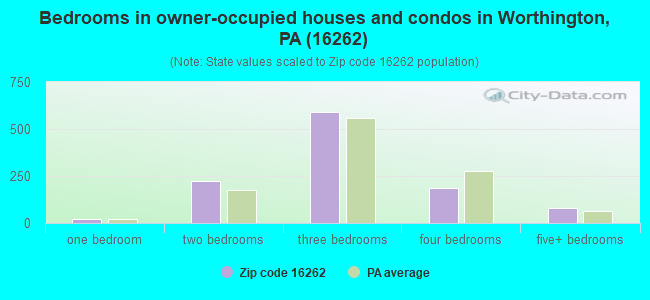
Median number of rooms in houses and condos:
Here:
6.7
State:
6.8
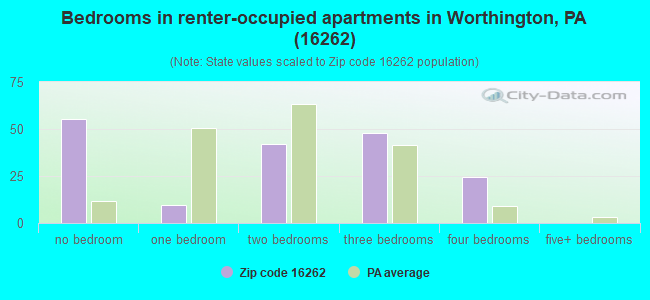
Median number of rooms in apartments:
Here:
4.7
State:
4.3
Notable locations in this zip code not listed on our city pages
Notable locations in zip code 16262: Laird Station (A), Craigville Brach Junction Station (B), Worthington - West Franklin Volunteer Fire Department (C). Display/hide their locations on the map
In group quarters: 101 (-1 institutionalized population)
Size of family households: 567 2-persons, 157 3-persons, 108 4-persons, 32 5-persons, 9 6-persons, 4 7-or-more-persons
Size of nonfamily households: 324 1-person, 74 2-persons
356 married couples with children.
62 single-parent households (55 men, 7 women).
99.3% of residents of 16262 zip code speak English at home.
0.3% of residents speak Spanish at home (43% very well, 57% not well).
0.1% of residents speak other Indo-European language at home (100% very well).
0.1% of residents speak Asian or Pacific Island language at home (100% not well).
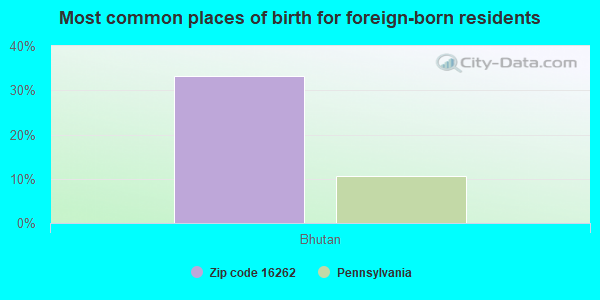
Foreign born population: 6 (0.2%) (67.6% of them are naturalized citizens)
This zip code:
0.2%
Whole state:
7.5%
33%Bhutan
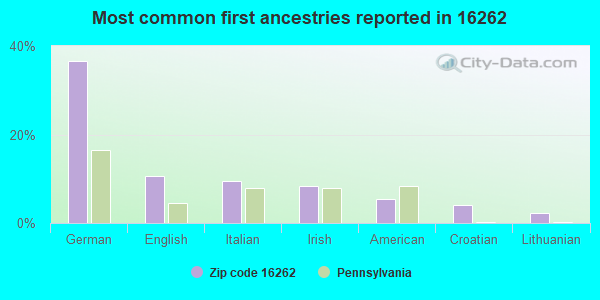
37%German
11%English
9%Italian
8%Irish
5%American
4%Croatian
2%Lithuanian
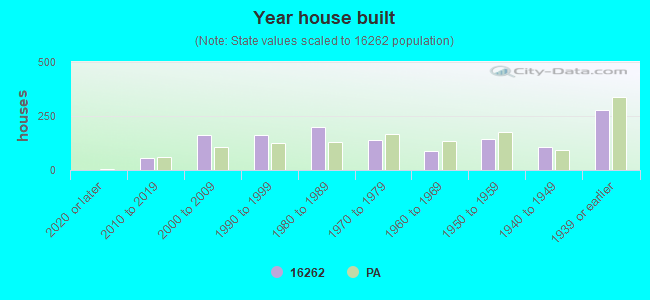
Year of entry for the foreign-born population
42010 or later
02000 to 2009
01990 to 1999
8Before 1990
Facilities with environmental interests located in this zip code:
ALLEGHENY MINERALS C/GRAFF MINE (GRAFF FARM RD T-491 AND US 4 in WORTHINGTON, PA)
AIR MINOR (AIRS/AFS) STATE MASTER (Pennsylvania database) Business SIC classification: CRUSHED AND BROKEN LIMESTONE Alternative names: ALLEGHENY MINERALS GRAFF MINE
ASHLAND PETROLEUM CO (US RT 422 in WORTHINGTON, PA)
AIR MAJOR (AIRS/AFS) Small Quantity Generators, between 100 kg and 1000 kg of hazardous waste/month (Resource Conservation and Recovery Act (tracking hazardous waste)) - notification TRANSPORTER (Resource Conservation and Recovery Act (tracking hazardous waste)) - notification Business SIC classification: PETROLEUM BULK STATIONS AND TERMINALS Organizations: ASHLAND BRANDED MKTG (CONTACT/OWNER)
Alternative names: ASHLAND 990
AIR TAK INC (107 W MAIN ST in WORTHINGTON, PA)
Conditionally Exempt Small Quantity Generators, less than 100 kg/month of hazardous waste (Resource Conservation and Recovery Act (tracking hazardous waste)) - notification Organizations: BURK DON (CONTACT/OWNER)
Housing units lacking complete plumbing facilities: 4.6% Housing units lacking complete kitchen facilities: 5.2%
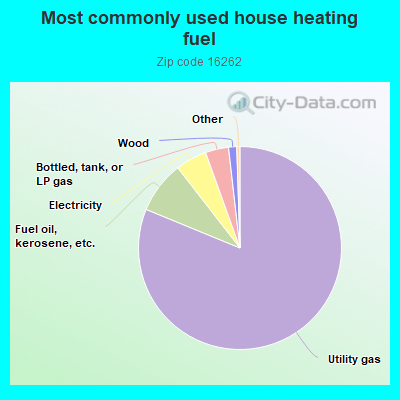
81.3%Utility gas
8.3%Fuel oil, kerosene, etc.
5.0%Electricity
3.7%Bottled, tank, or LP gas
1.3%Wood
Population in 1990: 3,065.
Place of birth for U.S.-born residents:
This state: 2,586
Northeast: 30
Midwest: 56
South: 71
West: 13
72% of the 16262 zip code residents lived in the same house 5 years ago. Out of people who lived in different houses, 63% lived in this county. Out of people who lived in different counties, 50% lived in Pennsylvania.
95% of the 16262 zip code residents lived in the same house 1 year ago. Out of people who lived in different houses, 60% moved from this county. Out of people who lived in different houses, 40% moved from different county within same state. Out of people who lived in different houses, 2% moved from abroad.
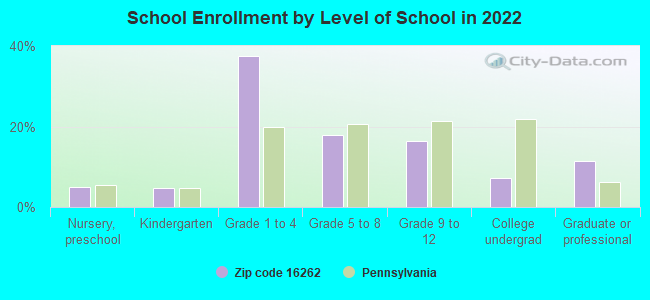
Private vs. public school enrollment:
Students in private schools in grades 1 to 8 (elementary and middle school): 20
Here:
8.4%
Pennsylvania:
15.7%
Students in private schools in grades 9 to 12 (high school): 10
Here:
14.1%
Pennsylvania:
13.4%
Students in private undergraduate colleges: 9
Here:
30.3%
Pennsylvania:
39.8%
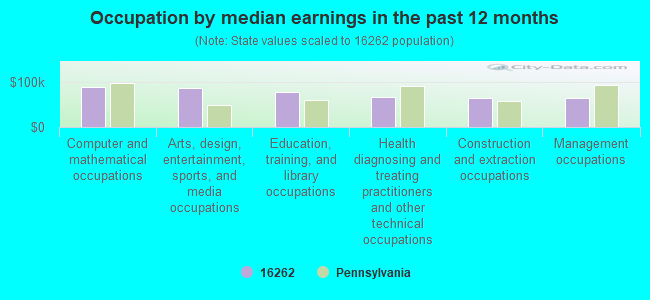
Occupation by median earnings in the past 12 months ($)
90,037Computer and mathematical occupations
86,165Arts, design, entertainment, sports, and media occupations
77,250Education, training, and library occupations
67,712Health diagnosing and treating practitioners and other technical occupations
65,236Construction and extraction occupations
65,061Management occupations
Top industries in this zip code by the number of employees in 2005:
Health Care and Social Assistance: Nursing Care Facilities (100-249 employees: 1 establishment)
Construction: Oil and Gas Pipeline and Related Structures Construction (50-99: 1)
Mining: Crushed and Broken Limestone Mining and Quarrying (10-19: 1, 5-9: 1)
Other Services (except Public Administration): Religious Organizations (5-9: 2, 1-4: 2)
Mining: Crude Petroleum and Natural Gas Extraction (10-19: 1)
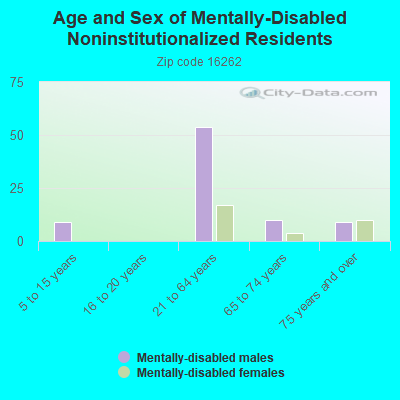
People in group quarters in 2010:
115 people in nursing facilities/skilled-nursing facilities
2 people in group homes intended for adults
People in group quarters in 2000:
143 people in nursing homes
29 people in other noninstitutional group quarters
4 people in homes for the mentally retarded
Fatal accident statistics in 2013:
Fatal accident count: 2
Vehicles involved in fatal accidents: 3
Fatal accidents caused by drunken drivers: 0
Fatalities: 2
Persons involved in fatal accidents: 3
Pedestrians involved in fatal accidents: 0
Fatal accident statistics in 2012:
Fatal accident count: 1
Vehicles involved in fatal accidents: 2
Fatal accidents caused by drunken drivers: 0
Fatalities: 1
Persons involved in fatal accidents: 3
Pedestrians involved in fatal accidents: 0
Home Mortgage Disclosure Act Aggregated Statistics For Year 2009 (Based on 2 full and 2 partial tracts)
A) FHA, FSA/RHS & VA Home Purchase Loans
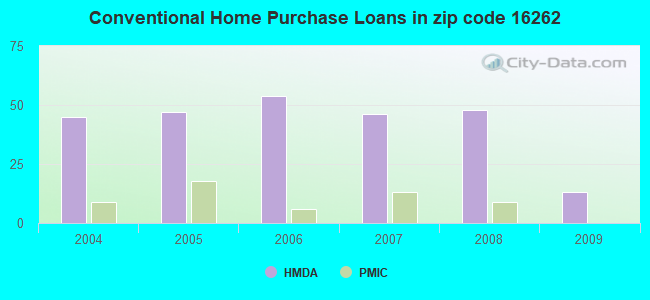
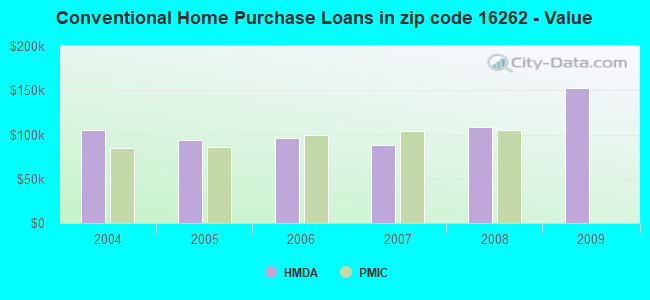
B) Conventional Home Purchase Loans
C) Refinancings
D) Home Improvement Loans
F) Non-occupant Loans on < 5 Family Dwellings (A B C & D)
G) Loans On Manufactured Home Dwelling (A B C & D)
Number
Average Value
Number
Average Value
Number
Average Value
Number
Average Value
Number
Average Value
Number
Average Value
LOANS ORIGINATED
4
$130,985
13
$152,273
73
$112,325
15
$47,763
4
$135,358
2
$135,150
APPLICATIONS APPROVED, NOT ACCEPTED
0
$0
0
$0
6
$99,293
0
$0
0
$0
0
$0
APPLICATIONS DENIED
4
$154,878
8
$58,214
39
$125,923
9
$57,407
0
$0
2
$25,295
APPLICATIONS WITHDRAWN
4
$123,902
4
$164,650
15
$126,737
1
$52,670
0
$0
5
$141,648
FILES CLOSED FOR INCOMPLETENESS
0
$0
0
$0
1
$199,380
0
$0
0
$0
0
$0
Aggregated Statistics For Year 2008 (Based on 2 full and 2 partial tracts)
A) FHA, FSA/RHS & VA Home Purchase Loans
B) Conventional Home Purchase Loans
C) Refinancings
D) Home Improvement Loans
F) Non-occupant Loans on < 5 Family Dwellings (A B C & D)
G) Loans On Manufactured Home Dwelling (A B C & D)
Number
Average Value
Number
Average Value
Number
Average Value
Number
Average Value
Number
Average Value
Number
Average Value
LOANS ORIGINATED
7
$118,243
48
$108,996
81
$98,091
24
$44,427
3
$54,090
12
$88,797
APPLICATIONS APPROVED, NOT ACCEPTED
2
$72,510
1
$38,950
12
$145,650
2
$19,710
2
$219,215
0
$0
APPLICATIONS DENIED
2
$126,310
11
$55,263
59
$117,826
24
$46,172
0
$0
8
$101,964
APPLICATIONS WITHDRAWN
0
$0
5
$80,934
25
$118,370
4
$18,725
0
$0
0
$0
FILES CLOSED FOR INCOMPLETENESS
0
$0
2
$76,250
5
$114,542
0
$0
0
$0
0
$0
Aggregated Statistics For Year 2007 (Based on 2 full and 2 partial tracts)
A) FHA, FSA/RHS & VA Home Purchase Loans
B) Conventional Home Purchase Loans
C) Refinancings
D) Home Improvement Loans
F) Non-occupant Loans on < 5 Family Dwellings (A B C & D)
G) Loans On Manufactured Home Dwelling (A B C & D)
Number
Average Value
Number
Average Value
Number
Average Value
Number
Average Value
Number
Average Value
Number
Average Value
LOANS ORIGINATED
1
$67,200
46
$87,896
76
$71,455
58
$24,798
3
$50,017
7
$87,164
APPLICATIONS APPROVED, NOT ACCEPTED
0
$0
4
$64,698
11
$82,767
11
$30,562
0
$0
2
$44,435
APPLICATIONS DENIED
0
$0
8
$62,175
93
$102,000
22
$50,554
0
$0
5
$53,636
APPLICATIONS WITHDRAWN
0
$0
5
$100,708
33
$100,160
2
$60,215
0
$0
2
$106,745
FILES CLOSED FOR INCOMPLETENESS
0
$0
0
$0
6
$78,598
0
$0
0
$0
0
$0
Aggregated Statistics For Year 2006 (Based on 2 full and 2 partial tracts)
A) FHA, FSA/RHS & VA Home Purchase Loans
B) Conventional Home Purchase Loans
C) Refinancings
D) Home Improvement Loans
F) Non-occupant Loans on < 5 Family Dwellings (A B C & D)
G) Loans On Manufactured Home Dwelling (A B C & D)
Number
Average Value
Number
Average Value
Number
Average Value
Number
Average Value
Number
Average Value
Number
Average Value
LOANS ORIGINATED
4
$185,685
54
$96,342
83
$85,728
44
$43,550
3
$42,123
5
$38,686
APPLICATIONS APPROVED, NOT ACCEPTED
0
$0
4
$68,140
16
$81,499
2
$25,935
0
$0
2
$65,945
APPLICATIONS DENIED
0
$0
3
$39,250
70
$76,520
36
$48,318
0
$0
1
$82,330
APPLICATIONS WITHDRAWN
2
$54,605
1
$34,310
40
$88,967
6
$40,628
0
$0
0
$0
FILES CLOSED FOR INCOMPLETENESS
0
$0
0
$0
5
$110,042
0
$0
0
$0
0
$0
Aggregated Statistics For Year 2005 (Based on 2 full and 2 partial tracts)
A) FHA, FSA/RHS & VA Home Purchase Loans
B) Conventional Home Purchase Loans
C) Refinancings
D) Home Improvement Loans
F) Non-occupant Loans on < 5 Family Dwellings (A B C & D)
G) Loans On Manufactured Home Dwelling (A B C & D)
Number
Average Value
Number
Average Value
Number
Average Value
Number
Average Value
Number
Average Value
Number
Average Value
LOANS ORIGINATED
4
$75,950
47
$94,276
106
$82,181
43
$30,226
7
$63,646
24
$62,541
APPLICATIONS APPROVED, NOT ACCEPTED
0
$0
4
$59,500
22
$99,194
9
$26,651
0
$0
2
$47,035
APPLICATIONS DENIED
0
$0
16
$59,538
66
$89,252
19
$50,415
6
$118,760
5
$37,436
APPLICATIONS WITHDRAWN
0
$0
2
$77,190
54
$102,814
5
$77,772
4
$109,040
0
$0
FILES CLOSED FOR INCOMPLETENESS
0
$0
0
$0
20
$85,632
0
$0
0
$0
0
$0
Aggregated Statistics For Year 2004 (Based on 2 full and 2 partial tracts)
A) FHA, FSA/RHS & VA Home Purchase Loans
B) Conventional Home Purchase Loans
C) Refinancings
D) Home Improvement Loans
F) Non-occupant Loans on < 5 Family Dwellings (A B C & D)
G) Loans On Manufactured Home Dwelling (A B C & D)

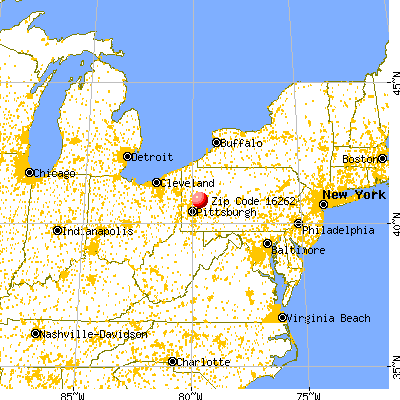


 Nearest zip codes: 16034, 16212, 16023, 16218, 16028, 16229.