Estimated zip code population in 2022: 689 Zip code population in 2010: 666 Zip code population in 2000: 698
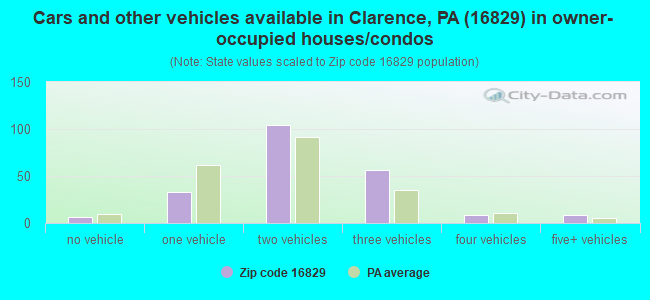
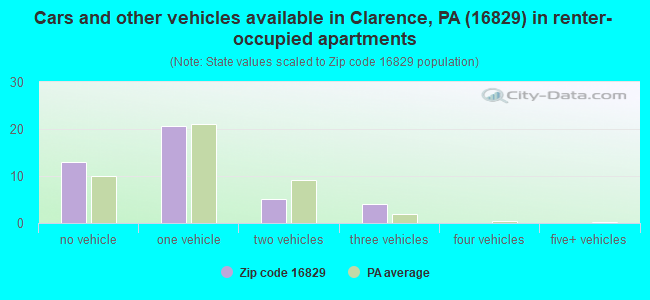
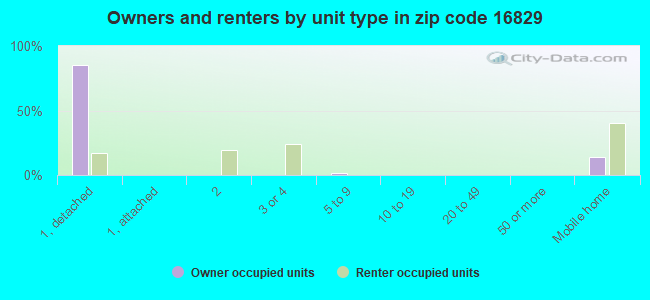
Houses and condos: 367 Renter-occupied apartments: 42
% of renters here:
17%
State:
31%
March 2022 cost of living index in zip code 16829: 91.3 (less than average, U.S. average is 100)
Land area: 32.2 sq. mi. Water area: 0.0 sq. mi.
Population density: 21 people per square mile
(very low).
OSM Map
General Map
Google Map
MSN Map
OSM Map
General Map
Google Map
MSN Map
OSM Map
General Map
Google Map
MSN Map
OSM Map
General Map
Google Map
MSN Map
Please wait while loading the map...
Real estate property taxes paid for housing units in 2022:
This zip code:
0.7% ($1,280)
Pennsylvania:
1.3% ($3,094)
Median real estate property taxes paid for housing units with mortgages in 2022: $1,416 (0.7%) Median real estate property taxes paid for housing units with no mortgage in 2022: $1,011 (0.6%)
Business Search- 14 Million verified businesses
Males: 321
(46.6%)
Females: 367
(53.4%)
For population 25 years and over in 16829:
High school or higher: 89.9%
Bachelor's degree or higher: 13.0%
Graduate or professional degree: 2.8%
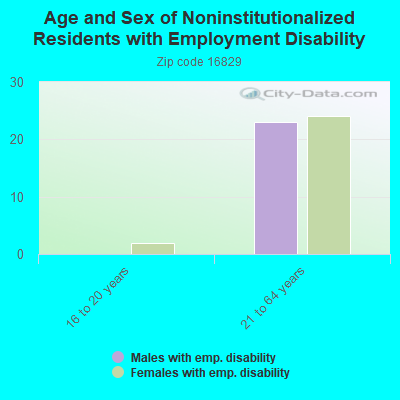
Unemployed: 4.9%
Mean travel time to work (commute): 31.1 minutes
For population 15 years and over in 16829:
Never married: 26.5%
Now married: 52.8%
Separated: 3.4%
Widowed: 8.0%
Divorced: 9.2%
Zip code 16829 compared to state average:
Black race population percentage significantly below state average.
Hispanic race population percentage significantly below state average.
Foreign-born population percentage significantly below state average.
Renting percentage below state average.
Length of stay since moving in significantly above state average.
Percentage of population with a bachelor's degree or higher significantly below state average.
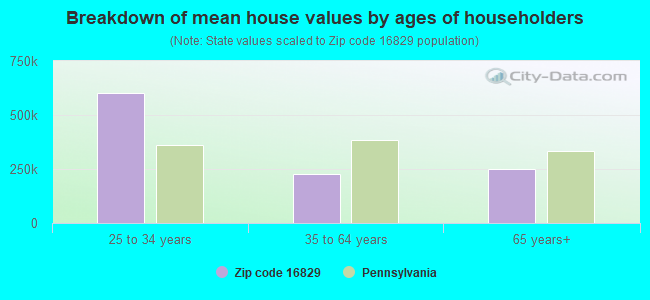
Estimated median house/condo value in 2022: $183,637
16829:
$183,637
Pennsylvania:
$245,500
According to our research of Pennsylvania and other state lists, there was 1 registered sex offender living in 16829 zip code as of May 20, 2024. The ratio of all residents to sex offenders in zip code 16829 is 596 to 1. The ratio of registered sex offenders to all residents in this zip code is near the state average.
Median resident age:
This zip code:
44.4 years
Pennsylvania median age:
40.9 years
Average household size:
This zip code:
2.7 people
Pennsylvania:
2.4 people
Averages for the 2020 tax year for zip code 16829, filed in 2021:
Average Adjusted Gross Income (AGI) in 2020: $55,321 (Individual Income Tax Returns)
Here:
$55,321
State:
$75,707
Salary/wage: $49,153 (reported on 78.9% of returns)
Here:
$49,153
State:
$62,806
(% of AGI for various income ranges: 1012.9% for AGIs below $25k, 3493.8% for AGIs $25k-50k, 5527.5% for AGIs $50k-75k, 8233.3% for AGIs $75k-100k, 16402.5% for AGIs $100k-200k)
Taxable interest for individuals: $562 (reported on 21.1% of returns)
This zip code:
$562
Pennsylvania:
$1,633
(% of AGI for various income ranges: 11.4% for AGIs below $25k, 35.0% for AGIs $25k-50k, 30.0% for AGIs $75k-100k)
Ordinary dividends: $360 (reported on 13.2% of returns)
Here:
$360
State:
$7,382
(% of AGI for various income ranges: 45.0% for AGIs $50k-75k)
Net capital gain/loss in AGI: +$1,550 (reported on 5.3% of returns)
Here:
+$1,550
State:
+$23,522
(% of AGI for various income ranges: 38.8% for AGIs $25k-50k)
Profit/loss from business: +$3,825 (reported on 10.5% of returns)
Here:
+$3,825
State:
+$16,274
(% of AGI for various income ranges: 191.2% for AGIs $25k-50k)
Taxable individual retirement arrangement distribution: $7,950 (reported on 10.5% of returns)
16829:
$7,950
Pennsylvania:
$18,583
(% of AGI for various income ranges: 397.5% for AGIs $25k-50k)
Earned income credit: $2,100 (reported on 10.5% of returns)
Here:
$2,100
State:
$2,100
(% of AGI for various income ranges: 57.1% for AGIs below $25k, 55.0% for AGIs $25k-50k)
Percentage of individuals using paid preparers for their 2020 taxes: 89.5%
Here:
89%
State:
92%
(% for various income ranges: 90.9% for AGIs below $25k, 90.9% for AGIs $25k-50k, 83.3% for AGIs $50k-75k, 75.0% for AGIs $75k-100k, 100.0% for AGIs $100k-200k)
Averages for the 2012 tax year for zip code 16829, filed in 2013:
Average Adjusted Gross Income (AGI) in 2012: $43,832 (Individual Income Tax Returns)
Here:
$43,832
State:
$61,346
Salary/wage: $43,221 (reported on 82.4% of returns)
Here:
$43,221
State:
$51,902
(% of AGI for various income ranges: 76.7% for AGIs below $25k, 80.8% for AGIs $25k-50k, 85.1% for AGIs $50k-75k, 76.5% for AGIs $75k-100k, 81.4% for AGIs $100k-200k)
Taxable interest for individuals: $230 (reported on 29.4% of returns)
This zip code:
$230
Pennsylvania:
$1,588
(% of AGI for various income ranges: 0.5% for AGIs below $25k, 0.4% for AGIs $25k-50k)
Ordinary dividends: $220 (reported on 14.7% of returns)
Here:
$220
State:
$5,827
Net capital gain/loss in AGI: +$1,700 (reported on 5.9% of returns)
Here:
+$1,700
State:
+$14,495
Profit/loss from business: +$1,200 (reported on 8.8% of returns)
Here:
+$1,200
State:
+$16,268
Taxable individual retirement arrangement distribution: $3,000 (reported on 5.9% of returns)
16829:
$3,000
Pennsylvania:
$14,550
Total itemized deductions: $19,883 (20% of AGI, reported on 17.6% of returns)
Here:
$19,883
State:
$23,538
Here:
20.4% of AGI
State:
18.4% of AGI
Charity contributions: $850 (reported on 11.8% of returns)
Here:
$850
State:
$4,025
Taxes paid: $7,450 (reported on 17.6% of returns)
16829:
$7,450
State:
$9,982
Earned income credit: $1,580 (reported on 14.7% of returns)
Here:
$1,580
State:
$2,106
(% of AGI for various income ranges: 5.1% for AGIs below $25k)
Percentage of individuals using paid preparers for their 2012 taxes: 50.0%
Here:
50%
State:
53%
(% for various income ranges: 38.5% for AGIs below $25k, 50.0% for AGIs $25k-50k, 71.4% for AGIs $50k-75k, 100.0% for AGIs $100k-200k)
Averages for the 2004 tax year for zip code 16829, filed in 2005:
Average Adjusted Gross Income (AGI) in 2004: $32,309 (Individual Income Tax Returns)
Here:
$32,309
State:
$48,049
Salary/wage: $29,913 (reported on 86.0% of returns)
Here:
$29,913
State:
$42,646
(% of AGI for various income ranges: 82.2% for AGIs below $10k, 66.4% for AGIs $10k-25k, 82.0% for AGIs $25k-50k, 90.1% for AGIs $50k-75k, 68.8% for AGIs $75k-100k)
Taxable interest for individuals: $564 (reported on 44.7% of returns)
This zip code:
$564
Pennsylvania:
$1,657
(% of AGI for various income ranges: 6.9% for AGIs below $10k, 0.9% for AGIs $10k-25k, 1.2% for AGIs $25k-50k, 0.1% for AGIs $50k-75k, 0.1% for AGIs $75k-100k)
Taxable dividends: $295 (reported on 17.5% of returns)
Here:
$295
State:
$3,566
Net capital gain/loss: +$414 (reported on 8.3% of returns)
Here:
+$414
State:
+$9,716
Profit/loss from business: +$6,222 (reported on 10.3% of returns)
Here:
+$6,222
State:
+$14,267
IRA payment deduction: $1,600 (reported on 2.9% of returns)
16829:
$1,600
Pennsylvania:
$2,903
Total itemized deductions: $12,048 (19% of AGI, reported on 17.8% of returns)
Here:
$12,048
State:
$18,804
Here:
19.5% of AGI
State:
19.5% of AGI
Charity contributions deductions: $762 (1% of AGI, reported on 12.0% of returns)
Here:
$762
State:
$3,337
Here:
1.2% of AGI
State:
3.3% of AGI
Total tax: $3,376 (reported on 76.2% of returns)
16829:
$3,376
State:
$8,008
(% of AGI for various income ranges: 2.2% for AGIs below $10k, 4.7% for AGIs $10k-25k, 6.8% for AGIs $25k-50k, 7.4% for AGIs $50k-75k, 15.2% for AGIs $75k-100k)
Earned income credit: $1,556 (reported on 10.3% of returns)
Here:
$1,556
State:
$1,643
Percentage of individuals using paid preparers for their 2004 taxes: 57.3%
Here:
57%
State:
56%
(% for various income ranges: 53.1% for AGIs below $10k, 56.6% for AGIs $10k-25k, 61.7% for AGIs $25k-50k, 43.4% for AGIs $50k-75k, 89.5% for AGIs $75k-100k)
Household received Food Stamps/SNAP in the past 12 months: 20 Household did not receive Food Stamps/SNAP in the past 12 months: 238
Women who had a birth in the past 12 months: 18 (9 now married, 7 unmarried) Women who did not have a birth in the past 12 months: 142 (76 now married, 65 unmarried)
Housing units in zip code 16829 with a mortgage: 138 (22 second mortgage, 22 both second mortgage and home equity loan) Median monthly owner costs for units with a mortgage: $1,213 Median monthly owner costs for units without a mortgage: $424
Residents with income below the poverty level in 2022:
This zip code:
8.6%
Whole state:
11.8%
Residents with income below 50% of the poverty level in 2022:
This zip code:
4.1%
Whole state:
6.1%
Median number of rooms in houses and condos:
Here:
6.4
State:
6.8
Median number of rooms in apartments:
Here:
4.9
State:
4.3
Notable locations in this zip code not listed on our city pages
Streams, rivers, and creeks: North Fork Beech Creek (A), Logway Run (B), Wolf Run (C), Contrary Run (D), Sandy Run (E), Beauty Run (F), Panther Run (G). Display/hide their locations on the map
Size of family households: 91 2-persons, 10 3-persons, 43 4-persons, 22 5-persons, 2 6-persons
Size of nonfamily households: 54 1-person, 35 2-persons
134 married couples with children.
42 single-parent households (37 men, 5 women).
99.5% of residents of 16829 zip code speak English at home.
Foreign born population: 1 (0.2%) (100.0% of them are naturalized citizens)
This zip code:
0.2%
Whole state:
7.5%
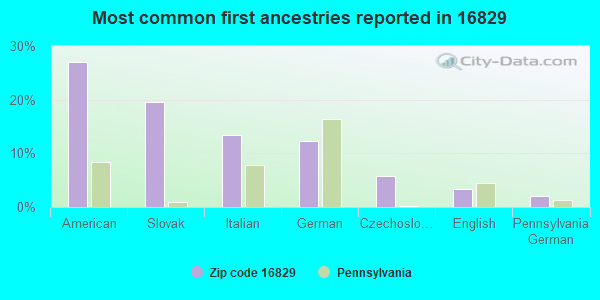
27%American
20%Slovak
13%Italian
12%German
6%Czechoslovakian
3%English
2%Pennsylvania German
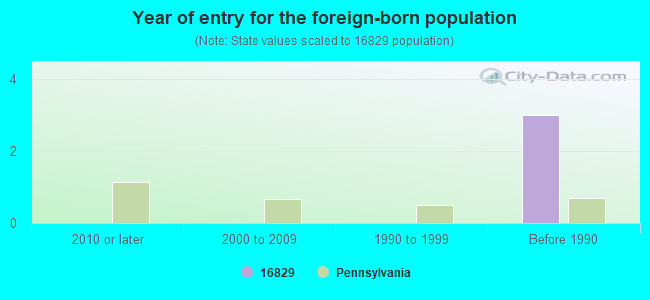
Year of entry for the foreign-born population
02010 or later
02000 to 2009
01990 to 1999
3Before 1990
Housing units lacking complete plumbing facilities: 17.8% Housing units lacking complete kitchen facilities: 8.0%
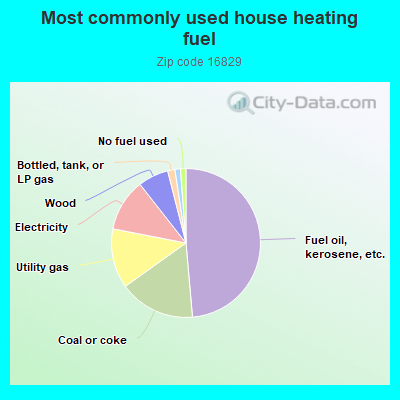
49.2%Fuel oil, kerosene, etc.
16.7%Coal or coke
13.1%Utility gas
11.5%Electricity
6.7%Wood
1.6%Bottled, tank, or LP gas
1.2%Other fuel
1.2%No fuel used
Population in 1990: 123. Population change in the 1990s: +575 (+467.5%).
Place of birth for U.S.-born residents:
This state: 663
Northeast: 11
South: 2
76% of the 16829 zip code residents lived in the same house 5 years ago. Out of people who lived in different houses, 80% lived in this county. Out of people who lived in different counties, 50% lived in Pennsylvania.
98% of the 16829 zip code residents lived in the same house 1 year ago. Out of people who lived in different houses, 112% moved from this county.
Private vs. public school enrollment:
Students in private schools in grades 1 to 8 (elementary and middle school): 2
Here:
4.4%
Pennsylvania:
15.7%
Students in private schools in grades 9 to 12 (high school):
Here:
0.0%
Pennsylvania:
13.4%
Students in private undergraduate colleges:
Here:
0.0%
Pennsylvania:
39.8%
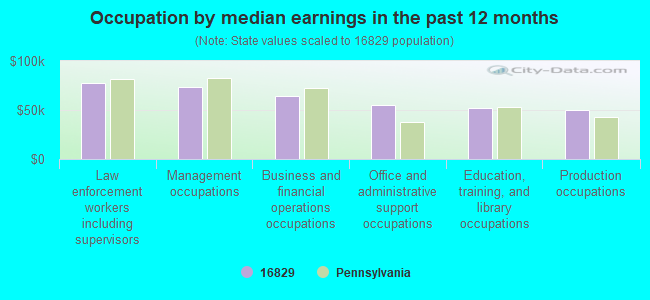
Occupation by median earnings in the past 12 months ($)
77,121Law enforcement workers including supervisors
73,354Management occupations
64,276Business and financial operations occupations
55,295Office and administrative support occupations
52,223Education, training, and library occupations
49,686Production occupations
Top industries in this zip code by the number of employees in 2005:
Other Services (except Public Administration): Civic and Social Organizations (5-9 employees: 1 establishment, 1-4 employees: 1 establishment)
Other Services (except Public Administration): Commercial and Industrial Machinery and Equipment (except Automotive and Electronic) Repair and Maintenance (5-9: 1)
Mining: Support Activities for Oil and Gas Operations (5-9: 1)
Other Services (except Public Administration): General Automotive Repair (1-4: 1)
Information: Cable and Other Program Distribution (1-4: 1)
Construction: Flooring Contractors (1-4: 1)
Construction: Masonry Contractors (1-4: 1)
Home Mortgage Disclosure Act Aggregated Statistics For Year 2009 (Based on 2 partial tracts)
A) FHA, FSA/RHS & VA Home Purchase Loans
B) Conventional Home Purchase Loans
C) Refinancings
D) Home Improvement Loans
F) Non-occupant Loans on < 5 Family Dwellings (A B C & D)
G) Loans On Manufactured Home Dwelling (A B C & D)
Number
Average Value
Number
Average Value
Number
Average Value
Number
Average Value
Number
Average Value
Number
Average Value
LOANS ORIGINATED
1
$160,470
1
$151,840
5
$92,870
1
$34,640
1
$90,880
1
$23,640
APPLICATIONS APPROVED, NOT ACCEPTED
0
$0
0
$0
0
$0
0
$0
0
$0
0
$0
APPLICATIONS DENIED
0
$0
0
$0
3
$104,513
0
$0
0
$0
1
$35,160
APPLICATIONS WITHDRAWN
0
$0
0
$0
1
$60,140
0
$0
0
$0
0
$0
FILES CLOSED FOR INCOMPLETENESS
0
$0
0
$0
0
$0
0
$0
0
$0
0
$0
Aggregated Statistics For Year 2008 (Based on 2 partial tracts)
A) FHA, FSA/RHS & VA Home Purchase Loans
B) Conventional Home Purchase Loans
C) Refinancings
D) Home Improvement Loans
G) Loans On Manufactured Home Dwelling (A B C & D)
Number
Average Value
Number
Average Value
Number
Average Value
Number
Average Value
Number
Average Value
LOANS ORIGINATED
1
$101,670
1
$103,110
3
$99,783
2
$16,240
0
$0
APPLICATIONS APPROVED, NOT ACCEPTED
0
$0
0
$0
0
$0
0
$0
0
$0
APPLICATIONS DENIED
0
$0
0
$0
6
$92,297
1
$45,440
1
$54,280
APPLICATIONS WITHDRAWN
0
$0
0
$0
1
$180,310
0
$0
0
$0
FILES CLOSED FOR INCOMPLETENESS
0
$0
0
$0
1
$50,990
0
$0
0
$0
Aggregated Statistics For Year 2007 (Based on 2 partial tracts)
A) FHA, FSA/RHS & VA Home Purchase Loans
B) Conventional Home Purchase Loans
C) Refinancings
D) Home Improvement Loans
F) Non-occupant Loans on < 5 Family Dwellings (A B C & D)
G) Loans On Manufactured Home Dwelling (A B C & D)
Number
Average Value
Number
Average Value
Number
Average Value
Number
Average Value
Number
Average Value
Number
Average Value
LOANS ORIGINATED
1
$72,780
2
$101,360
3
$66,510
3
$43,143
1
$29,300
1
$24,770
APPLICATIONS APPROVED, NOT ACCEPTED
0
$0
0
$0
1
$95,090
0
$0
0
$0
0
$0
APPLICATIONS DENIED
0
$0
0
$0
7
$78,641
2
$41,530
0
$0
0
$0
APPLICATIONS WITHDRAWN
0
$0
0
$0
1
$86,760
0
$0
0
$0
0
$0
FILES CLOSED FOR INCOMPLETENESS
0
$0
0
$0
0
$0
0
$0
0
$0
0
$0
Aggregated Statistics For Year 2006 (Based on 2 partial tracts)
B) Conventional Home Purchase Loans
C) Refinancings
D) Home Improvement Loans
F) Non-occupant Loans on < 5 Family Dwellings (A B C & D)
G) Loans On Manufactured Home Dwelling (A B C & D)
Number
Average Value
Number
Average Value
Number
Average Value
Number
Average Value
Number
Average Value
LOANS ORIGINATED
3
$95,947
4
$70,188
2
$31,610
1
$66,820
0
$0
APPLICATIONS APPROVED, NOT ACCEPTED
1
$28,060
1
$68,050
0
$0
0
$0
0
$0
APPLICATIONS DENIED
1
$76,480
9
$84,501
2
$29,090
0
$0
1
$73,910
APPLICATIONS WITHDRAWN
1
$38,650
3
$77,787
0
$0
0
$0
0
$0
FILES CLOSED FOR INCOMPLETENESS
0
$0
0
$0
0
$0
0
$0
0
$0
Aggregated Statistics For Year 2005 (Based on 2 partial tracts)
B) Conventional Home Purchase Loans
C) Refinancings
D) Home Improvement Loans
F) Non-occupant Loans on < 5 Family Dwellings (A B C & D)
G) Loans On Manufactured Home Dwelling (A B C & D)
Number
Average Value
Number
Average Value
Number
Average Value
Number
Average Value
Number
Average Value
LOANS ORIGINATED
3
$86,147
6
$80,750
3
$27,790
1
$44,820
0
$0
APPLICATIONS APPROVED, NOT ACCEPTED
0
$0
1
$67,030
0
$0
0
$0
0
$0
APPLICATIONS DENIED
1
$67,850
10
$75,013
1
$63,940
0
$0
2
$48,575
APPLICATIONS WITHDRAWN
1
$70,010
4
$88,330
1
$79,570
0
$0
0
$0
FILES CLOSED FOR INCOMPLETENESS
0
$0
0
$0
0
$0
0
$0
0
$0
Aggregated Statistics For Year 2004 (Based on 2 partial tracts)
B) Conventional Home Purchase Loans
C) Refinancings
D) Home Improvement Loans
F) Non-occupant Loans on < 5 Family Dwellings (A B C & D)
G) Loans On Manufactured Home Dwelling (A B C & D)
Number
Average Value
Number
Average Value
Number
Average Value
Number
Average Value
Number
Average Value
LOANS ORIGINATED
4
$70,728
6
$73,913
2
$50,935
1
$63,430
1
$41,020
APPLICATIONS APPROVED, NOT ACCEPTED
0
$0
2
$66,770
0
$0
0
$0
0
$0
APPLICATIONS DENIED
1
$77,200
7
$82,827
2
$16,705
0
$0
0
$0
APPLICATIONS WITHDRAWN
0
$0
5
$91,390
0
$0
0
$0
0
$0
FILES CLOSED FOR INCOMPLETENESS
0
$0
1
$129,120
0
$0
0
$0
0
$0
Aggregated Statistics For Year 2003 (Based on 2 partial tracts)
B) Conventional Home Purchase Loans
C) Refinancings
D) Home Improvement Loans
F) Non-occupant Loans on < 5 Family Dwellings (A B C & D)
Number
Average Value
Number
Average Value
Number
Average Value
Number
Average Value
LOANS ORIGINATED
3
$72,167
10
$78,210
1
$35,880
1
$51,910
APPLICATIONS APPROVED, NOT ACCEPTED
0
$0
3
$74,017
1
$17,580
0
$0
APPLICATIONS DENIED
1
$62,300
6
$83,062
1
$12,850
0
$0
APPLICATIONS WITHDRAWN
0
$0
4
$89,615
0
$0
0
$0
FILES CLOSED FOR INCOMPLETENESS
0
$0
1
$34,440
0
$0
0
$0
Aggregated Statistics For Year 2002 (Based on 2 partial tracts)
A) FHA, FSA/RHS & VA Home Purchase Loans
B) Conventional Home Purchase Loans
C) Refinancings
D) Home Improvement Loans
F) Non-occupant Loans on < 5 Family Dwellings (A B C & D)
Number
Average Value
Number
Average Value
Number
Average Value
Number
Average Value
Number
Average Value
LOANS ORIGINATED
1
$52,020
2
$81,160
9
$67,746
1
$21,380
1
$32,480
APPLICATIONS APPROVED, NOT ACCEPTED
0
$0
1
$56,030
3
$72,167
0
$0
0
$0
APPLICATIONS DENIED
0
$0
1
$43,180
6
$65,928
0
$0
0
$0
APPLICATIONS WITHDRAWN
0
$0
0
$0
4
$68,722
0
$0
0
$0
FILES CLOSED FOR INCOMPLETENESS
0
$0
0
$0
0
$0
0
$0
0
$0
Aggregated Statistics For Year 2001 (Based on 2 partial tracts)
A) FHA, FSA/RHS & VA Home Purchase Loans
B) Conventional Home Purchase Loans
C) Refinancings
D) Home Improvement Loans
Number
Average Value
Number
Average Value
Number
Average Value
Number
Average Value
LOANS ORIGINATED
1
$53,970
3
$61,610
8
$63,916
1
$38,760
APPLICATIONS APPROVED, NOT ACCEPTED
0
$0
1
$44,720
3
$47,803
0
$0
APPLICATIONS DENIED
0
$0
3
$51,470
6
$67,472
1
$8,640
APPLICATIONS WITHDRAWN
0
$0
0
$0
3
$78,300
0
$0
FILES CLOSED FOR INCOMPLETENESS
0
$0
0
$0
1
$73,710
0
$0
Aggregated Statistics For Year 2000 (Based on 2 partial tracts)
B) Conventional Home Purchase Loans
C) Refinancings
D) Home Improvement Loans
Number
Average Value
Number
Average Value
Number
Average Value
LOANS ORIGINATED
3
$57,363
2
$51,865
1
$20,050
APPLICATIONS APPROVED, NOT ACCEPTED
0
$0
2
$53,355
0
$0
APPLICATIONS DENIED
2
$45,080
5
$47,534
1
$23,030
APPLICATIONS WITHDRAWN
0
$0
2
$49,190
0
$0
FILES CLOSED FOR INCOMPLETENESS
0
$0
0
$0
0
$0
Aggregated Statistics For Year 1999 (Based on 1 partial tract)


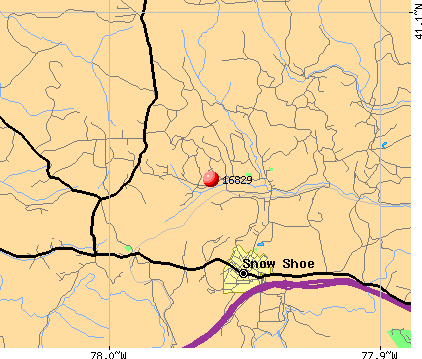 Nearest zip codes: 16845, 16874, 16859, 16871, 16835, 16844.