Estimated zip code population in 2022: 1,193 Zip code population in 2010: 1,371 Zip code population in 2000: 1,367
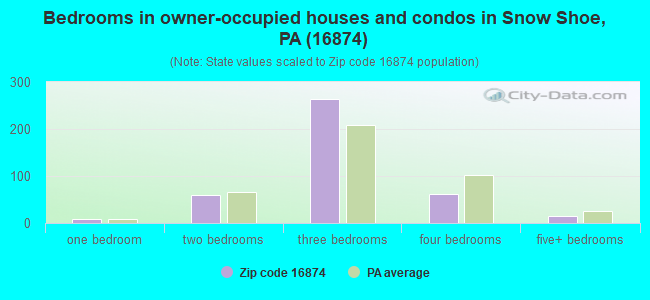
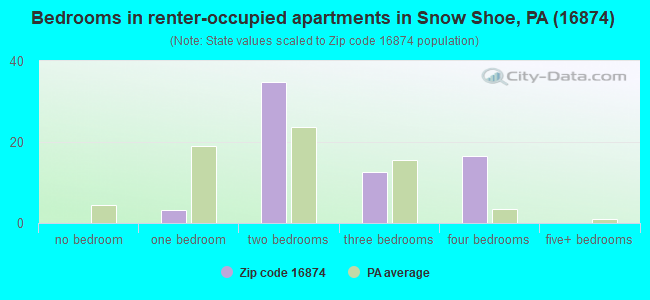
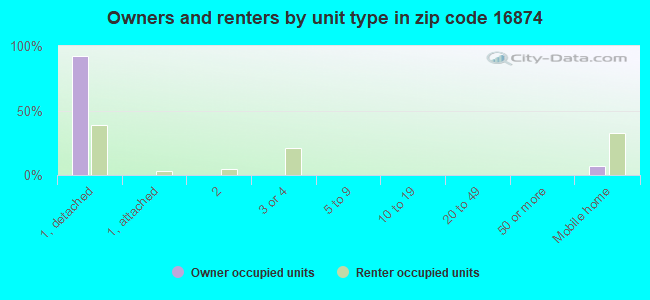
Houses and condos: 595 Renter-occupied apartments: 68
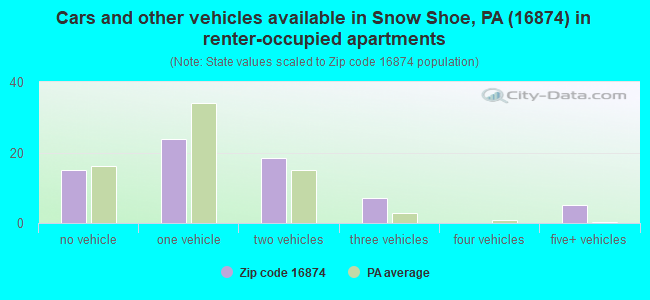
% of renters here:
14%
State:
31%
March 2022 cost of living index in zip code 16874: 91.0 (less than average, U.S. average is 100)
Land area: 34.5 sq. mi. Water area: 0.0 sq. mi.
Population density: 35 people per square mile
(very low).
OSM Map
General Map
Google Map
MSN Map
OSM Map
General Map
Google Map
MSN Map
OSM Map
General Map
Google Map
MSN Map
OSM Map
General Map
Google Map
MSN Map
Please wait while loading the map...
Real estate property taxes paid for housing units in 2022:
This zip code:
1.0% ($1,510)
Pennsylvania:
1.3% ($3,094)
Median real estate property taxes paid for housing units with mortgages in 2022: $1,671 (1.0%) Median real estate property taxes paid for housing units with no mortgage in 2022: $1,309 (0.9%)
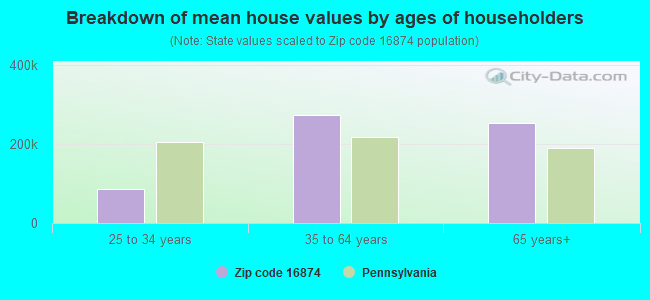
Estimated median house/condo value in 2022: $155,852
16874:
$155,852
Pennsylvania:
$245,500
According to our research of Pennsylvania and other state lists, there was 1 registered sex offender living in 16874 zip code as of May 20, 2024. The ratio of all residents to sex offenders in zip code 16874 is 1,553 to 1. The ratio of registered sex offenders to all residents in this zip code is lower than the state average.
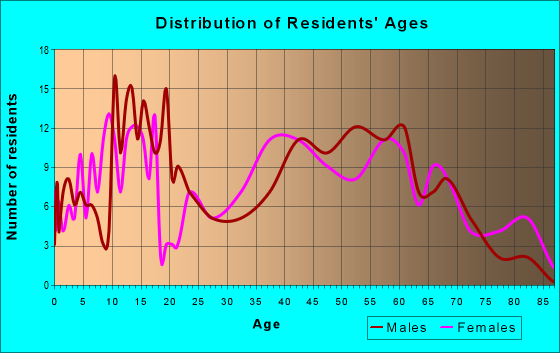
Median resident age:
This zip code:
46.3 years
Pennsylvania median age:
40.9 years
Average household size:
This zip code:
2.5 people
Pennsylvania:
2.4 people
Averages for the 2020 tax year for zip code 16874, filed in 2021:
Average Adjusted Gross Income (AGI) in 2020: $59,972 (Individual Income Tax Returns)
Here:
$59,972
State:
$75,707
Salary/wage: $47,863 (reported on 83.1% of returns)
Here:
$47,863
State:
$62,806
(% of AGI for various income ranges: 975.0% for AGIs below $25k, 3610.0% for AGIs $25k-50k, 5565.6% for AGIs $50k-75k, 8478.6% for AGIs $75k-100k, 14138.3% for AGIs $100k-200k)
Taxable interest for individuals: $418 (reported on 26.2% of returns)
This zip code:
$418
Pennsylvania:
$1,633
(% of AGI for various income ranges: 10.0% for AGIs below $25k, 10.0% for AGIs $25k-50k, 15.6% for AGIs $50k-75k, 15.7% for AGIs $75k-100k, 30.0% for AGIs $100k-200k)
Ordinary dividends: $1,373 (reported on 16.9% of returns)
Here:
$1,373
State:
$7,382
(% of AGI for various income ranges: 20.0% for AGIs below $25k, 32.1% for AGIs $25k-50k, 47.8% for AGIs $50k-75k, 14.3% for AGIs $75k-100k, 41.7% for AGIs $100k-200k)
Net capital gain/loss in AGI: +$3,157 (reported on 10.8% of returns)
Here:
+$3,157
State:
+$23,522
(% of AGI for various income ranges: 15.0% for AGIs $25k-50k, 285.7% for AGIs $75k-100k)
Profit/loss from business: +$5,443 (reported on 10.8% of returns)
Here:
+$5,443
State:
+$16,274
(% of AGI for various income ranges: 222.1% for AGIs $25k-50k, 100.0% for AGIs $75k-100k)
Taxable individual retirement arrangement distribution: $9,071 (reported on 10.8% of returns)
16874:
$9,071
Pennsylvania:
$18,583
(% of AGI for various income ranges: 207.1% for AGIs below $25k, 383.3% for AGIs $50k-75k)
Earned income credit: $1,814 (reported on 10.8% of returns)
Here:
$1,814
State:
$2,100
(% of AGI for various income ranges: 51.4% for AGIs below $25k, 39.3% for AGIs $25k-50k)
Percentage of individuals using paid preparers for their 2020 taxes: 93.8%
Here:
94%
State:
92%
(% for various income ranges: 90.0% for AGIs below $25k, 94.4% for AGIs $25k-50k, 90.9% for AGIs $50k-75k, 100.0% for AGIs $75k-100k, 100.0% for AGIs $100k-200k)
Averages for the 2012 tax year for zip code 16874, filed in 2013:
Average Adjusted Gross Income (AGI) in 2012: $43,634 (Individual Income Tax Returns)
Here:
$43,634
State:
$61,346
Salary/wage: $39,878 (reported on 87.1% of returns)
Here:
$39,878
State:
$51,902
(% of AGI for various income ranges: 69.9% for AGIs below $25k, 86.2% for AGIs $25k-50k, 80.5% for AGIs $50k-75k, 83.8% for AGIs $75k-100k, 70.2% for AGIs $100k-200k)
Taxable interest for individuals: $337 (reported on 30.6% of returns)
This zip code:
$337
Pennsylvania:
$1,588
(% of AGI for various income ranges: 1.1% for AGIs below $25k, 0.2% for AGIs $25k-50k, 0.2% for AGIs $50k-75k, 0.1% for AGIs $75k-100k)
Ordinary dividends: $442 (reported on 19.4% of returns)
Here:
$442
State:
$5,827
(% of AGI for various income ranges: 0.3% for AGIs below $25k, 0.1% for AGIs $25k-50k, 0.3% for AGIs $50k-75k, 0.2% for AGIs $75k-100k)
Net capital gain/loss in AGI: +$500 (reported on 6.5% of returns)
Here:
+$500
State:
+$14,495
Profit/loss from business: +$6,800 (reported on 8.1% of returns)
Here:
+$6,800
State:
+$16,268
Taxable individual retirement arrangement distribution: $5,729 (reported on 11.3% of returns)
16874:
$5,729
Pennsylvania:
$14,550
Total itemized deductions: $13,900 (20% of AGI, reported on 19.4% of returns)
Here:
$13,900
State:
$23,538
Here:
20.1% of AGI
State:
18.4% of AGI
(% of AGI for various income ranges: 5.2% for AGIs $25k-50k, 7.8% for AGIs $50k-75k, 6.7% for AGIs $75k-100k, 7.5% for AGIs $100k-200k)
Charity contributions: $1,414 (reported on 11.3% of returns)
Here:
$1,414
State:
$4,025
Taxes paid: $5,150 (reported on 19.4% of returns)
16874:
$5,150
State:
$9,982
(% of AGI for various income ranges: 1.4% for AGIs $25k-50k, 2.7% for AGIs $50k-75k, 2.6% for AGIs $75k-100k, 3.7% for AGIs $100k-200k)
Earned income credit: $1,638 (reported on 12.9% of returns)
Here:
$1,638
State:
$2,106
(% of AGI for various income ranges: 3.7% for AGIs below $25k, 0.6% for AGIs $25k-50k)
Percentage of individuals using paid preparers for their 2012 taxes: 51.6%
Here:
52%
State:
53%
(% for various income ranges: 43.5% for AGIs below $25k, 50.0% for AGIs $25k-50k, 50.0% for AGIs $50k-75k, 71.4% for AGIs $75k-100k, 75.0% for AGIs $100k-200k)
Averages for the 2004 tax year for zip code 16874, filed in 2005:
Average Adjusted Gross Income (AGI) in 2004: $35,207 (Individual Income Tax Returns)
Here:
$35,207
State:
$48,049
Salary/wage: $34,024 (reported on 87.4% of returns)
Here:
$34,024
State:
$42,646
(% of AGI for various income ranges: 92.6% for AGIs below $10k, 75.3% for AGIs $10k-25k, 83.7% for AGIs $25k-50k, 90.1% for AGIs $50k-75k, 80.6% for AGIs $75k-100k)
Taxable interest for individuals: $494 (reported on 41.2% of returns)
This zip code:
$494
Pennsylvania:
$1,657
(% of AGI for various income ranges: 2.2% for AGIs below $10k, 1.0% for AGIs $10k-25k, 0.6% for AGIs $25k-50k, 0.4% for AGIs $50k-75k, 0.5% for AGIs $75k-100k)
Taxable dividends: $460 (reported on 20.7% of returns)
Here:
$460
State:
$3,566
(% of AGI for various income ranges: 1.2% for AGIs below $10k, 0.8% for AGIs $10k-25k, 0.1% for AGIs $25k-50k, 0.2% for AGIs $50k-75k, 0.2% for AGIs $75k-100k)
Net capital gain/loss: +$1,475 (reported on 9.7% of returns)
Here:
+$1,475
State:
+$9,716
Profit/loss from business: +$6,241 (reported on 13.0% of returns)
Here:
+$6,241
State:
+$14,267
(% of AGI for various income ranges: 15.0% for AGIs below $10k, 6.1% for AGIs $10k-25k, 3.5% for AGIs $25k-50k, 0.4% for AGIs $50k-75k)
IRA payment deduction: $1,824 (reported on 2.8% of returns)
16874:
$1,824
Pennsylvania:
$2,903
Total itemized deductions: $13,068 (22% of AGI, reported on 16.9% of returns)
Here:
$13,068
State:
$18,804
Here:
22.2% of AGI
State:
19.5% of AGI
Charity contributions deductions: $1,351 (2% of AGI, reported on 12.6% of returns)
Here:
$1,351
State:
$3,337
Here:
2.2% of AGI
State:
3.3% of AGI
Total tax: $3,357 (reported on 80.1% of returns)
16874:
$3,357
State:
$8,008
(% of AGI for various income ranges: 3.7% for AGIs below $10k, 4.8% for AGIs $10k-25k, 7.0% for AGIs $25k-50k, 7.7% for AGIs $50k-75k, 10.8% for AGIs $75k-100k)
Earned income credit: $1,691 (reported on 13.3% of returns)
Here:
$1,691
State:
$1,643
Percentage of individuals using paid preparers for their 2004 taxes: 54.2%
Here:
54%
State:
56%
(% for various income ranges: 45.7% for AGIs below $10k, 57.2% for AGIs $10k-25k, 50.0% for AGIs $25k-50k, 63.1% for AGIs $50k-75k, 55.6% for AGIs $75k-100k)
Household received Food Stamps/SNAP in the past 12 months: 51 Household did not receive Food Stamps/SNAP in the past 12 months: 428
Women who had a birth in the past 12 months: 21 (15 now married, 6 unmarried) Women who did not have a birth in the past 12 months: 197 (96 now married, 100 unmarried)
Housing units in zip code 16874 with a mortgage: 211 (27 second mortgage, 26 both second mortgage and home equity loan) Houses without a mortgage: 21
Median monthly owner costs for units with a mortgage: $1,152 Median monthly owner costs for units without a mortgage: $456
Residents with income below the poverty level in 2022:
This zip code:
11.6%
Whole state:
11.8%
Residents with income below 50% of the poverty level in 2022:
This zip code:
3.5%
Whole state:
6.1%
Median number of rooms in houses and condos:
Here:
6.5
State:
6.8
Median number of rooms in apartments:
Here:
5.1
State:
4.3
Notable locations in this zip code not listed on our city pages
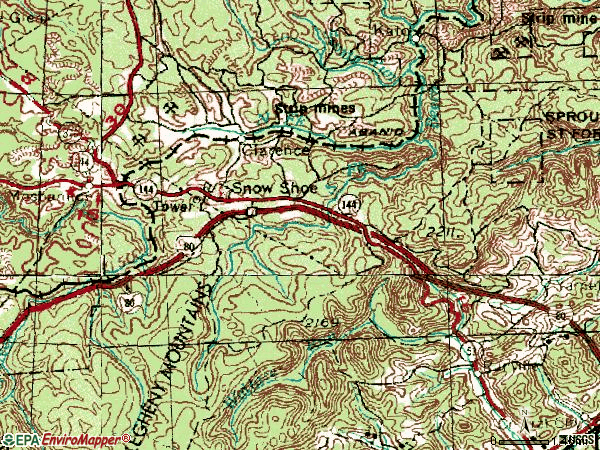
Notable locations in zip code 16874: Beech Creek Lodge (A), Gillintown Mines Station (B), Snow Shop Station (C), Snow Shoe Fire Company (D). Display/hide their locations on the map
Streams, rivers, and creeks: Horsehead Run (A), Middle Branch Rock Run (B), Hicklen Run (C), Stinktown Run (D), Pine Run (E). Display/hide their locations on the map
Size of family households: 153 2-persons, 77 3-persons, 28 4-persons, 28 5-persons, 14 6-persons, 7 7-or-more-persons
Size of nonfamily households: 125 1-person, 39 2-persons, 6 4-persons
138 married couples with children.
56 single-parent households (56 women).
97.5% of residents of 16874 zip code speak English at home.
1.0% of residents speak other Indo-European language at home (91% very well, 9% well).
1.0% of residents speak Asian or Pacific Island language at home (100% very well).
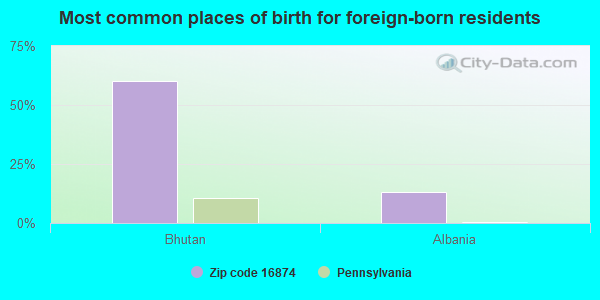
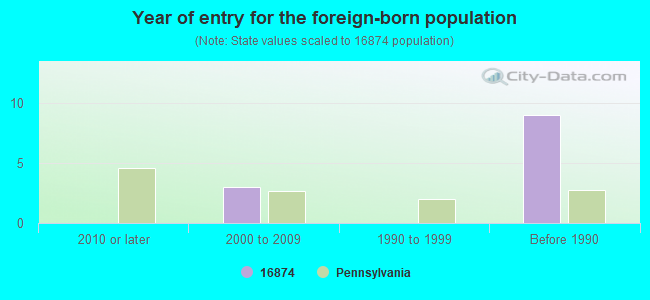
Foreign born population: 15 (1.3%) (93.6% of them are naturalized citizens)
This zip code:
1.3%
Whole state:
7.5%
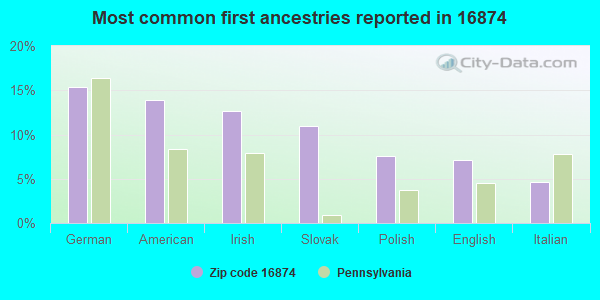
60%Bhutan
13%Albania
15%German
14%American
13%Irish
11%Slovak
8%Polish
7%English
5%Italian
Year of entry for the foreign-born population
02010 or later
32000 to 2009
01990 to 1999
9Before 1990
Housing units lacking complete plumbing facilities: 10.1% Housing units lacking complete kitchen facilities: 5.2%
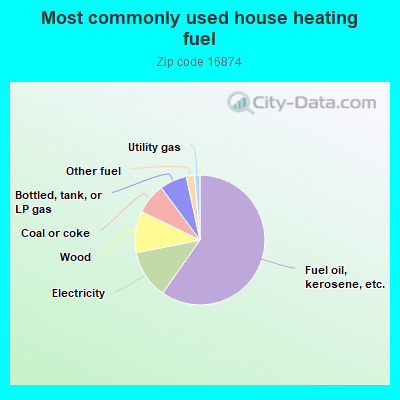
60.1%Fuel oil, kerosene, etc.
12.2%Electricity
10.4%Wood
7.7%Coal or coke
6.8%Bottled, tank, or LP gas
2.1%Other fuel
1.3%Utility gas
Population in 1990: 1,917.
Place of birth for U.S.-born residents:
This state: 1,055
Northeast: 25
Midwest: 16
South: 52
West: 20
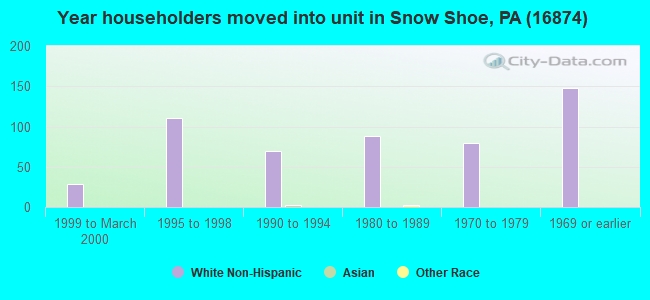
77% of the 16874 zip code residents lived in the same house 5 years ago. Out of people who lived in different houses, 77% lived in this county. Out of people who lived in different counties, 50% lived in Pennsylvania.
97% of the 16874 zip code residents lived in the same house 1 year ago. Out of people who lived in different houses, 81% moved from this county. Out of people who lived in different houses, 23% moved from different county within same state.
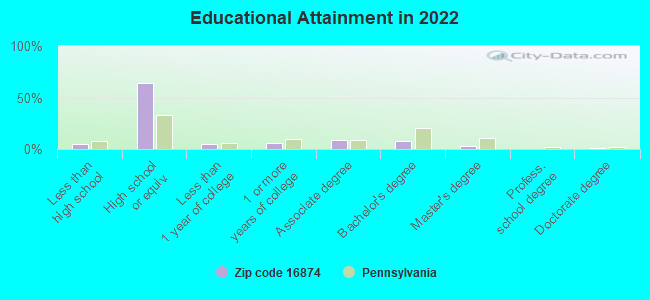
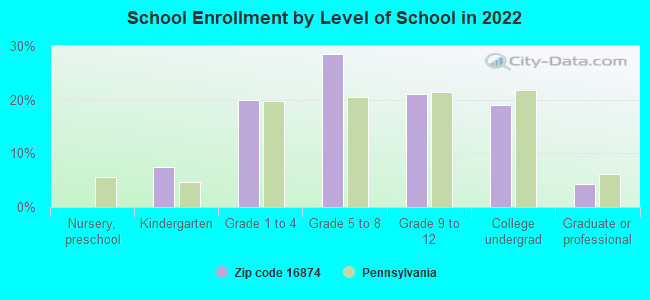
Private vs. public school enrollment:
Students in private schools in grades 1 to 8 (elementary and middle school): 8
Here:
9.3%
Pennsylvania:
15.7%
Students in private schools in grades 9 to 12 (high school):
Here:
0.0%
Pennsylvania:
13.4%
Students in private undergraduate colleges: 8
Here:
24.2%
Pennsylvania:
39.8%
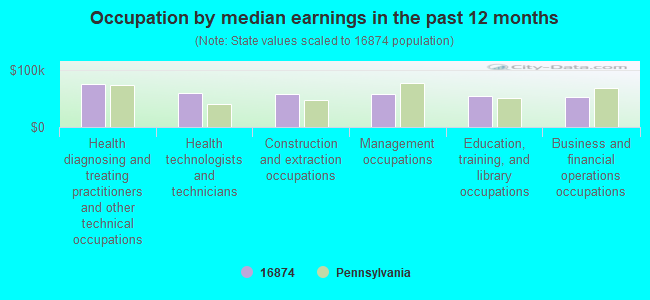
Occupation by median earnings in the past 12 months ($)
75,384Health diagnosing and treating practitioners and other technical occupations
60,586Health technologists and technicians
58,466Construction and extraction occupations
58,034Management occupations
54,157Education, training, and library occupations
52,545Business and financial operations occupations
Companies with federal contracts located in this zip code:
MATSKO, MICHAEL E (203 E PARK AVE in SNOW SHOE, PA; small business) : $12,153 in 2 contractsfrom 2004 to 2005
$7,026 with Army for Maintenance, Repair or Alteration of Real Property -- Highways, Roads, Streets, Bridges, and Railways (includes resurfacing). Signed on 2005-02-15. Completion date: 2005-03-18.
$5,127, same as above.Signed on 2004-02-17. Completion date: 2004-03-09.
Top industries in this zip code by the number of employees in 2005:
Other Services (except Public Administration): General Automotive Repair (10-19 employees: 1 establishment, 1-4 employees: 2 establishments)
Accommodation and Food Services: Full-Service Restaurants (10-19: 1)
Construction: New Single-Family Housing Construction (except Operative Builders) (5-9: 1, 1-4: 1)
Administrative and Support and Waste Management and Remediation Services: All Other Support Services (5-9: 1)
Health Care and Social Assistance: Child Day Care Services (5-9: 1)
Finance and Insurance: Commercial Banking (5-9: 1)
Fatal accident statistics in 2011:
Fatal accident count: 1
Vehicles involved in fatal accidents: 1
Fatal accidents caused by drunken drivers: 1
Fatalities: 1
Persons involved in fatal accidents: 2
Pedestrians involved in fatal accidents: 0
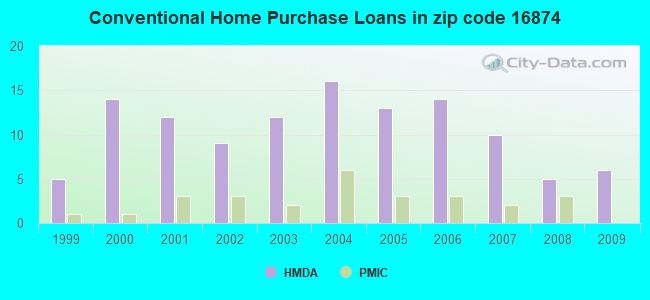
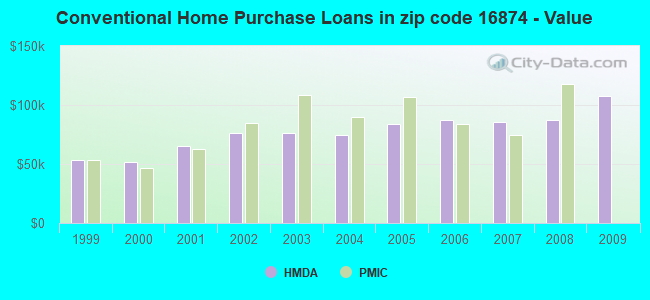
Home Mortgage Disclosure Act Aggregated Statistics For Year 2009 (Based on 2 partial tracts)
A) FHA, FSA/RHS & VA Home Purchase Loans
B) Conventional Home Purchase Loans
C) Refinancings
D) Home Improvement Loans
F) Non-occupant Loans on < 5 Family Dwellings (A B C & D)
G) Loans On Manufactured Home Dwelling (A B C & D)
Number
Average Value
Number
Average Value
Number
Average Value
Number
Average Value
Number
Average Value
Number
Average Value
LOANS ORIGINATED
6
$113,328
6
$107,230
19
$103,558
6
$24,467
3
$128,357
2
$50,095
APPLICATIONS APPROVED, NOT ACCEPTED
0
$0
1
$33,540
0
$0
0
$0
0
$0
0
$0
APPLICATIONS DENIED
1
$135,470
2
$86,465
14
$94,899
2
$35,935
1
$139,390
2
$74,490
APPLICATIONS WITHDRAWN
0
$0
1
$129,370
3
$84,943
0
$0
1
$148,100
0
$0
FILES CLOSED FOR INCOMPLETENESS
0
$0
0
$0
0
$0
0
$0
0
$0
0
$0
Aggregated Statistics For Year 2008 (Based on 2 partial tracts)
A) FHA, FSA/RHS & VA Home Purchase Loans
B) Conventional Home Purchase Loans
C) Refinancings
D) Home Improvement Loans
F) Non-occupant Loans on < 5 Family Dwellings (A B C & D)
G) Loans On Manufactured Home Dwelling (A B C & D)
Number
Average Value
Number
Average Value
Number
Average Value
Number
Average Value
Number
Average Value
Number
Average Value
LOANS ORIGINATED
3
$143,603
5
$87,382
13
$97,575
8
$17,206
2
$59,460
1
$41,820
APPLICATIONS APPROVED, NOT ACCEPTED
0
$0
0
$0
0
$0
0
$0
0
$0
0
$0
APPLICATIONS DENIED
2
$65,775
0
$0
24
$97,774
5
$38,508
0
$0
2
$115,000
APPLICATIONS WITHDRAWN
0
$0
0
$0
6
$127,340
1
$50,970
0
$0
0
$0
FILES CLOSED FOR INCOMPLETENESS
0
$0
0
$0
2
$108,030
0
$0
0
$0
0
$0
Aggregated Statistics For Year 2007 (Based on 2 partial tracts)
A) FHA, FSA/RHS & VA Home Purchase Loans
B) Conventional Home Purchase Loans
C) Refinancings
D) Home Improvement Loans
F) Non-occupant Loans on < 5 Family Dwellings (A B C & D)
G) Loans On Manufactured Home Dwelling (A B C & D)
Number
Average Value
Number
Average Value
Number
Average Value
Number
Average Value
Number
Average Value
Number
Average Value
LOANS ORIGINATED
3
$102,800
10
$85,900
12
$70,458
14
$39,173
3
$41,383
2
$52,490
APPLICATIONS APPROVED, NOT ACCEPTED
0
$0
1
$98,450
3
$134,310
2
$21,560
0
$0
1
$77,970
APPLICATIONS DENIED
0
$0
0
$0
28
$83,309
7
$50,280
0
$0
1
$109,340
APPLICATIONS WITHDRAWN
0
$0
1
$45,300
4
$91,912
0
$0
0
$0
0
$0
FILES CLOSED FOR INCOMPLETENESS
0
$0
0
$0
1
$134,160
0
$0
0
$0
0
$0
Aggregated Statistics For Year 2006 (Based on 2 partial tracts)
A) FHA, FSA/RHS & VA Home Purchase Loans
B) Conventional Home Purchase Loans
C) Refinancings
D) Home Improvement Loans
F) Non-occupant Loans on < 5 Family Dwellings (A B C & D)
G) Loans On Manufactured Home Dwelling (A B C & D)
Number
Average Value
Number
Average Value
Number
Average Value
Number
Average Value
Number
Average Value
Number
Average Value
LOANS ORIGINATED
1
$133,290
14
$87,120
17
$69,978
10
$26,789
4
$70,785
2
$42,255
APPLICATIONS APPROVED, NOT ACCEPTED
0
$0
2
$59,460
4
$72,092
1
$135,040
1
$66,650
0
$0
APPLICATIONS DENIED
0
$0
5
$64,818
37
$87,096
7
$35,221
0
$0
5
$62,640
APPLICATIONS WITHDRAWN
0
$0
2
$81,895
11
$89,892
0
$0
0
$0
0
$0
FILES CLOSED FOR INCOMPLETENESS
0
$0
0
$0
2
$112,605
1
$24,390
0
$0
0
$0
Aggregated Statistics For Year 2005 (Based on 2 partial tracts)
A) FHA, FSA/RHS & VA Home Purchase Loans
B) Conventional Home Purchase Loans
C) Refinancings
D) Home Improvement Loans
F) Non-occupant Loans on < 5 Family Dwellings (A B C & D)
G) Loans On Manufactured Home Dwelling (A B C & D)
Number
Average Value
Number
Average Value
Number
Average Value
Number
Average Value
Number
Average Value
Number
Average Value
LOANS ORIGINATED
1
$92,350
13
$84,238
27
$76,036
11
$32,115
3
$63,307
2
$71,220
APPLICATIONS APPROVED, NOT ACCEPTED
0
$0
1
$63,160
5
$56,802
1
$39,200
1
$47,040
1
$61,860
APPLICATIONS DENIED
0
$0
5
$57,500
41
$77,526
6
$45,157
1
$55,760
7
$58,806
APPLICATIONS WITHDRAWN
0
$0
3
$98,880
17
$88,068
3
$112,383
0
$0
1
$140,700
FILES CLOSED FOR INCOMPLETENESS
0
$0
1
$73,180
2
$120,445
0
$0
0
$0
0
$0
Aggregated Statistics For Year 2004 (Based on 2 partial tracts)
A) FHA, FSA/RHS & VA Home Purchase Loans
B) Conventional Home Purchase Loans
C) Refinancings
D) Home Improvement Loans
F) Non-occupant Loans on < 5 Family Dwellings (A B C & D)
G) Loans On Manufactured Home Dwelling (A B C & D)
Number
Average Value
Number
Average Value
Number
Average Value
Number
Average Value
Number
Average Value
Number
Average Value
LOANS ORIGINATED
1
$60,110
16
$74,923
27
$69,599
10
$43,168
4
$67,192
3
$57,933
APPLICATIONS APPROVED, NOT ACCEPTED
0
$0
1
$120,660
7
$80,834
0
$0
1
$58,370
0
$0
APPLICATIONS DENIED
0
$0
6
$54,523
30
$81,893
7
$20,224
0
$0
2
$25,700
APPLICATIONS WITHDRAWN
0
$0
2
$69,915
22
$88,011
0
$0
0
$0
1
$149,410
FILES CLOSED FOR INCOMPLETENESS
0
$0
0
$0
5
$109,422
0
$0
0
$0
0
$0
Aggregated Statistics For Year 2003 (Based on 2 partial tracts)
A) FHA, FSA/RHS & VA Home Purchase Loans
B) Conventional Home Purchase Loans
C) Refinancings
D) Home Improvement Loans
F) Non-occupant Loans on < 5 Family Dwellings (A B C & D)
Number
Average Value
Number
Average Value
Number
Average Value
Number
Average Value
Number
Average Value
LOANS ORIGINATED
1
$71,000
12
$76,448
41
$80,830
6
$25,337
4
$54,995
APPLICATIONS APPROVED, NOT ACCEPTED
0
$0
1
$51,840
12
$78,408
2
$37,245
1
$67,520
APPLICATIONS DENIED
0
$0
3
$87,990
27
$78,214
2
$27,225
0
$0
APPLICATIONS WITHDRAWN
1
$75,360
0
$0
17
$89,349
0
$0
0
$0
FILES CLOSED FOR INCOMPLETENESS
0
$0
0
$0
2
$72,965
0
$0
0
$0
Aggregated Statistics For Year 2002 (Based on 2 partial tracts)
A) FHA, FSA/RHS & VA Home Purchase Loans
B) Conventional Home Purchase Loans
C) Refinancings
D) Home Improvement Loans
F) Non-occupant Loans on < 5 Family Dwellings (A B C & D)
Number
Average Value
Number
Average Value
Number
Average Value
Number
Average Value
Number
Average Value
LOANS ORIGINATED
3
$73,470
9
$76,423
36
$71,765
3
$30,200
3
$45,883
APPLICATIONS APPROVED, NOT ACCEPTED
0
$0
4
$59,350
11
$83,397
0
$0
0
$0
APPLICATIONS DENIED
0
$0
3
$60,983
25
$67,048
2
$15,245
0
$0
APPLICATIONS WITHDRAWN
0
$0
1
$56,190
16
$72,799
0
$0
0
$0
FILES CLOSED FOR INCOMPLETENESS
0
$0
0
$0
1
$93,650
0
$0
0
$0
Aggregated Statistics For Year 2001 (Based on 2 partial tracts)
A) FHA, FSA/RHS & VA Home Purchase Loans
B) Conventional Home Purchase Loans
C) Refinancings
D) Home Improvement Loans
F) Non-occupant Loans on < 5 Family Dwellings (A B C & D)
Number
Average Value
Number
Average Value
Number
Average Value
Number
Average Value
Number
Average Value
LOANS ORIGINATED
3
$76,230
12
$65,268
34
$63,726
5
$32,844
1
$68,820
APPLICATIONS APPROVED, NOT ACCEPTED
0
$0
3
$63,163
11
$55,242
1
$36,150
0
$0
APPLICATIONS DENIED
1
$57,060
11
$59,479
26
$65,977
3
$12,197
1
$37,030
APPLICATIONS WITHDRAWN
0
$0
2
$71,440
15
$66,357
0
$0
0
$0
FILES CLOSED FOR INCOMPLETENESS
0
$0
0
$0
4
$78,082
0
$0
0
$0
Aggregated Statistics For Year 2000 (Based on 2 partial tracts)
B) Conventional Home Purchase Loans
C) Refinancings
D) Home Improvement Loans
F) Non-occupant Loans on < 5 Family Dwellings (A B C & D)
Number
Average Value
Number
Average Value
Number
Average Value
Number
Average Value
LOANS ORIGINATED
14
$52,085
10
$43,952
5
$16,988
2
$27,005
APPLICATIONS APPROVED, NOT ACCEPTED
2
$42,035
8
$56,519
1
$6,530
0
$0
APPLICATIONS DENIED
9
$42,447
19
$53,006
3
$32,523
1
$39,640
APPLICATIONS WITHDRAWN
1
$74,490
9
$46,319
0
$0
0
$0
FILES CLOSED FOR INCOMPLETENESS
0
$0
1
$85,380
0
$0
0
$0
Aggregated Statistics For Year 1999 (Based on 1 partial tract)
Detailed PMIC statistics for the following Tracts:0102.00
2003 - 2018 National Fire Incident Reporting System (NFIRS) incidents
According to the data from the years 2003 - 2018 the average number of fire incidents per year is 7. The highest number of reported fires - 15 took place in 2005, and the least - 2 in 2009. The data has a growing trend.
When looking into fire subcategories, the most reports belonged to: Outside Fires (44.5%), and Structure Fires (29.1%).
Fire incident types reported to NFIRS in Zip Code 16874


 Nearest zip codes: 16859, 16844, 16835, 16829, 16834, 16839.
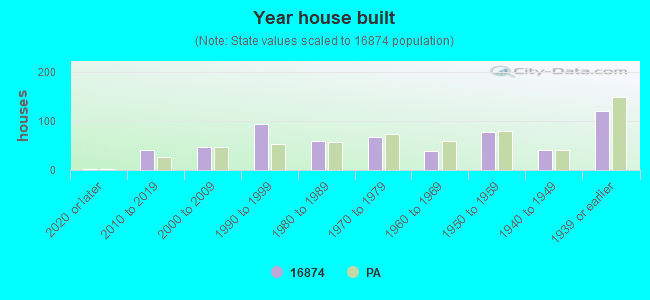


 : $12,153 in 2 contracts from 2004 to 2005
 According to the data from the years 2003 - 2018 the average number of fire incidents per year is 7. The highest number of reported fires - 15 took place in 2005, and the least - 2 in 2009. The data has a growing trend.
 When looking into fire subcategories, the most reports belonged to: Outside Fires (44.5%), and Structure Fires (29.1%).