Estimated zip code population in 2022: 299 Zip code population in 2010: 510 Zip code population in 2000: 422
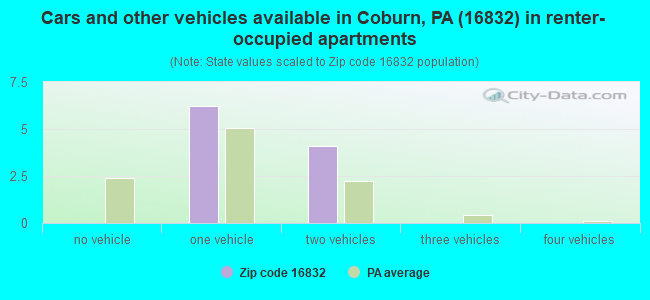
Houses and condos: 292 Renter-occupied apartments: 10
% of renters here:
8%
State:
31%
March 2022 cost of living index in zip code 16832: 93.1 (less than average, U.S. average is 100)
Land area: 17.3 sq. mi. Water area: 0.0 sq. mi.
Population density: 17 people per square mile
(very low).
OSM Map
General Map
Google Map
MSN Map
OSM Map
General Map
Google Map
MSN Map
OSM Map
General Map
Google Map
MSN Map
OSM Map
General Map
Google Map
MSN Map
Please wait while loading the map...
Real estate property taxes paid for housing units in 2022:
This zip code:
1.1% ($1,941)
Pennsylvania:
1.3% ($3,094)
Median real estate property taxes paid for housing units with mortgages in 2022: $1,771 (1.0%) Median real estate property taxes paid for housing units with no mortgage in 2022: $2,253 (1.3%)
Business Search- 14 Million verified businesses
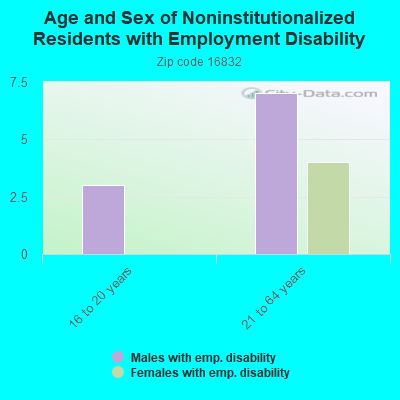
Males: 146
(49.0%)
Females: 152
(51.0%)
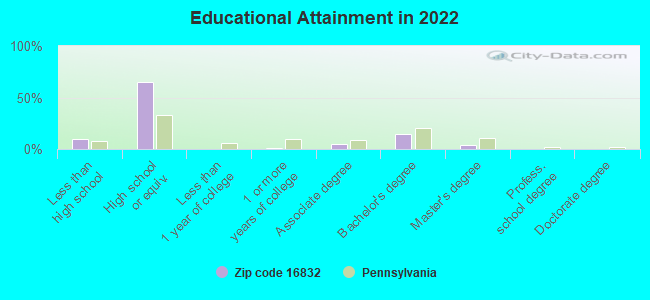
For population 25 years and over in 16832:
High school or higher: 86.9%
Bachelor's degree or higher: 18.7%
Graduate or professional degree: 4.2%
Unemployed: 5.3%
Mean travel time to work (commute): 32.3 minutes
For population 15 years and over in 16832:
Never married: 23.2%
Now married: 56.4%
Separated: 0.0%
Widowed: 6.3%
Divorced: 14.2%
Zip code 16832 compared to state average:
Black race population percentage significantly below state average.
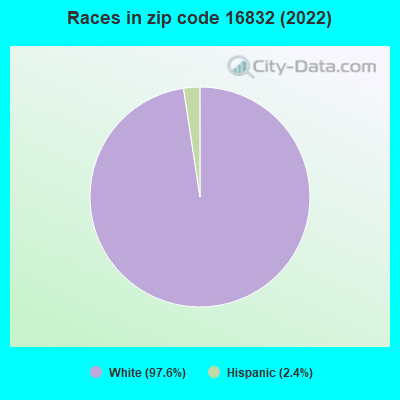
Hispanic race population percentage significantly below state average.
Median age significantly above state average.
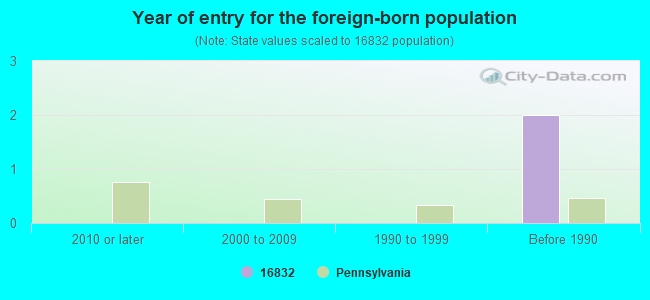
Foreign-born population percentage significantly below state average.
Renting percentage significantly below state average.
Length of stay since moving in significantly above state average.
Number of rooms per house below state average.
Number of college students below state average.
Percentage of population with a bachelor's degree or higher below state average.
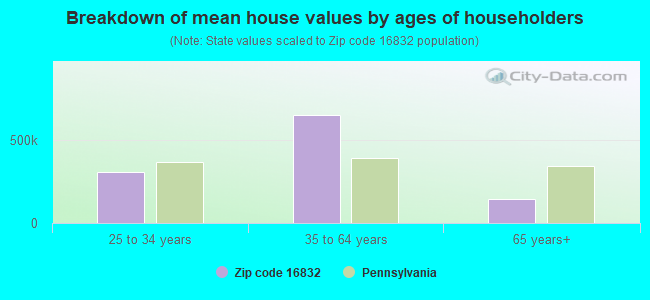
Estimated median house/condo value in 2022: $169,310
16832:
$169,310
Pennsylvania:
$245,500
According to our research of Pennsylvania and other state lists, there was 1 registered sex offender living in 16832 zip code as of May 20, 2024. The ratio of all residents to sex offenders in zip code 16832 is 701 to 1. The ratio of registered sex offenders to all residents in this zip code is near the state average.
Median resident age:
This zip code:
52.2 years
Pennsylvania median age:
40.9 years
Average household size:
This zip code:
2.4 people
Pennsylvania:
2.4 people
Averages for the 2020 tax year for zip code 16832, filed in 2021:
Average Adjusted Gross Income (AGI) in 2020: $46,128 (Individual Income Tax Returns)
Here:
$46,128
State:
$75,707
Salary/wage: $41,478 (reported on 72.0% of returns)
Here:
$41,478
State:
$62,806
(% of AGI for various income ranges: 966.0% for AGIs below $25k, 3190.0% for AGIs $25k-50k, 5296.7% for AGIs $50k-75k, 5946.7% for AGIs $75k-100k)
Taxable interest for individuals: $283 (reported on 24.0% of returns)
This zip code:
$283
Pennsylvania:
$1,633
(% of AGI for various income ranges: 26.0% for AGIs $25k-50k, 13.3% for AGIs $75k-100k)
Ordinary dividends: $1,100 (reported on 16.0% of returns)
Here:
$1,100
State:
$7,382
(% of AGI for various income ranges: 88.0% for AGIs $25k-50k)
Net capital gain/loss in AGI: +$10,000 (reported on 12.0% of returns)
Here:
+$10,000
State:
+$23,522
(% of AGI for various income ranges: 600.0% for AGIs $25k-50k)
Profit/loss from business: +$9,000 (reported on 16.0% of returns)
Here:
+$9,000
State:
+$16,274
(% of AGI for various income ranges: 720.0% for AGIs $25k-50k)
Taxable individual retirement arrangement distribution: $6,267 (reported on 12.0% of returns)
16832:
$6,267
Pennsylvania:
$18,583
(% of AGI for various income ranges: 376.0% for AGIs below $25k)
Earned income credit: $2,275 (reported on 16.0% of returns)
Here:
$2,275
State:
$2,100
(% of AGI for various income ranges: 182.0% for AGIs below $25k)
Percentage of individuals using paid preparers for their 2020 taxes: 96.0%
Here:
96%
State:
92%
(% for various income ranges: 88.9% for AGIs below $25k, 100.0% for AGIs $25k-50k, 100.0% for AGIs $50k-75k, 100.0% for AGIs $75k-100k, 100.0% for AGIs $100k-200k)
Averages for the 2012 tax year for zip code 16832, filed in 2013:
Average Adjusted Gross Income (AGI) in 2012: $37,986 (Individual Income Tax Returns)
Here:
$37,986
State:
$61,346
Salary/wage: $33,981 (reported on 76.2% of returns)
Here:
$33,981
State:
$51,902
(% of AGI for various income ranges: 68.0% for AGIs below $25k, 70.5% for AGIs $25k-50k, 79.7% for AGIs $50k-75k, 58.9% for AGIs $75k-100k)
Taxable interest for individuals: $333 (reported on 28.6% of returns)
This zip code:
$333
Pennsylvania:
$1,588
Ordinary dividends: $850 (reported on 19.0% of returns)
Here:
$850
State:
$5,827
Net capital gain/loss in AGI: +$1,200 (reported on 14.3% of returns)
Here:
+$1,200
State:
+$14,495
Profit/loss from business: +$9,733 (reported on 14.3% of returns)
Here:
+$9,733
State:
+$16,268
Taxable individual retirement arrangement distribution: $4,900 (reported on 9.5% of returns)
16832:
$4,900
Pennsylvania:
$14,550
Total itemized deductions: $15,975 (25% of AGI, reported on 19.0% of returns)
Here:
$15,975
State:
$23,538
Here:
25.1% of AGI
State:
18.4% of AGI
Charity contributions: $1,433 (reported on 14.3% of returns)
Here:
$1,433
State:
$4,025
Taxes paid: $5,100 (reported on 19.0% of returns)
16832:
$5,100
State:
$9,982
Earned income credit: $1,625 (reported on 19.0% of returns)
Here:
$1,625
State:
$2,106
(% of AGI for various income ranges: 6.6% for AGIs below $25k)
Percentage of individuals using paid preparers for their 2012 taxes: 57.1%
Here:
57%
State:
53%
(% for various income ranges: 44.4% for AGIs below $25k, 66.7% for AGIs $25k-50k, 66.7% for AGIs $50k-75k, 66.7% for AGIs $75k-100k)
Averages for the 2004 tax year for zip code 16832, filed in 2005:
Average Adjusted Gross Income (AGI) in 2004: $33,902 (Individual Income Tax Returns)
Here:
$33,902
State:
$48,049
Salary/wage: $29,952 (reported on 81.9% of returns)
Here:
$29,952
State:
$42,646
(% of AGI for various income ranges: 87.1% for AGIs below $10k, 74.7% for AGIs $10k-25k, 80.2% for AGIs $25k-50k, 76.2% for AGIs $50k-75k, 53.1% for AGIs $75k-100k)
Taxable interest for individuals: $495 (reported on 44.6% of returns)
This zip code:
$495
Pennsylvania:
$1,657
(% of AGI for various income ranges: 5.4% for AGIs below $10k, 0.6% for AGIs $10k-25k, 0.8% for AGIs $25k-50k, 0.4% for AGIs $50k-75k, 0.1% for AGIs $75k-100k)
Taxable dividends: $674 (reported on 22.5% of returns)
Here:
$674
State:
$3,566
Net capital gain/loss: +$179 (reported on 13.7% of returns)
Here:
+$179
State:
+$9,716
Profit/loss from business: +$6,188 (reported on 15.7% of returns)
Here:
+$6,188
State:
+$14,267
Total itemized deductions: $12,884 (22% of AGI, reported on 21.1% of returns)
Here:
$12,884
State:
$18,804
Here:
21.7% of AGI
State:
19.5% of AGI
Charity contributions deductions: $1,250 (2% of AGI, reported on 15.7% of returns)
Here:
$1,250
State:
$3,337
Here:
2.3% of AGI
State:
3.3% of AGI
Total tax: $3,869 (reported on 71.1% of returns)
16832:
$3,869
State:
$8,008
(% of AGI for various income ranges: 5.2% for AGIs $10k-25k, 6.6% for AGIs $25k-50k, 7.9% for AGIs $50k-75k, 13.4% for AGIs $75k-100k)
Earned income credit: $1,179 (reported on 13.7% of returns)
Here:
$1,179
State:
$1,643
Percentage of individuals using paid preparers for their 2004 taxes: 56.9%
Here:
57%
State:
56%
(% for various income ranges: 56.8% for AGIs below $10k, 46.3% for AGIs $10k-25k, 60.3% for AGIs $25k-50k, 93.3% for AGIs $50k-75k)
Household received Food Stamps/SNAP in the past 12 months: 21 Household did not receive Food Stamps/SNAP in the past 12 months: 103
Women who had a birth in the past 12 months: 2 (0 now married, 1 unmarried) Women who did not have a birth in the past 12 months: 41 (26 now married, 15 unmarried)
Housing units in zip code 16832 with a mortgage: 55 (6 second mortgage, 6 both second mortgage and home equity loan) Median monthly owner costs for units with a mortgage: $1,163 Median monthly owner costs for units without a mortgage: $400
Residents with income below the poverty level in 2022:
This zip code:
14.5%
Whole state:
11.8%
Residents with income below 50% of the poverty level in 2022:
This zip code:
12.4%
Whole state:
6.1%
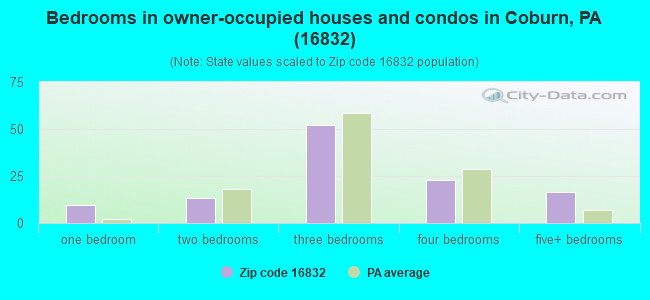
Median number of rooms in houses and condos:
Here:
7.2
State:
6.8
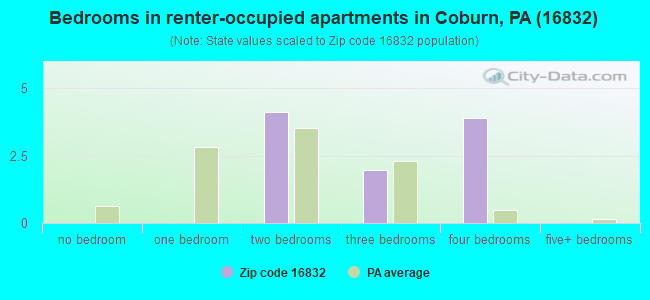
Median number of rooms in apartments:
Here:
6.0
State:
4.3
Notable locations in this zip code not listed on our city pages
Streams, rivers, and creeks: Pine Creek (A), Little Poe Creek (B), Elk Creek (C), Big Poe Creek (D), Pine Swamp Run (E). Display/hide their locations on the map
Size of family households: 43 2-persons, 3 3-persons, 22 4-persons, 6 5-persons, 4 7-or-more-persons
Size of nonfamily households: 31 1-person, 13 2-persons
49 married couples with children.
4 single-parent households (3 men, 1 women).
94.8% of residents of 16832 zip code speak English at home.
1.4% of residents speak Spanish at home (100% very well).
3.5% of residents speak other Indo-European language at home (100% well).
Foreign born population: 0 (0.0%)
:
0.0%
Whole state:
7.5%
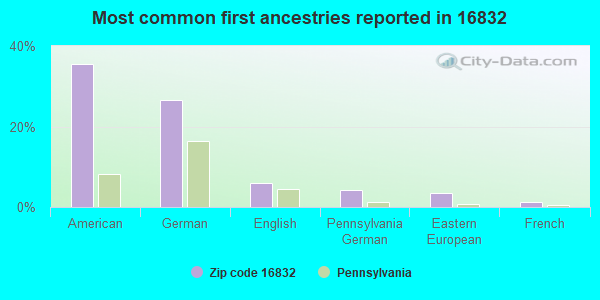
36%American
27%German
6%English
4%Pennsylvania German
4%Eastern European
1%French
Year of entry for the foreign-born population
02010 or later
02000 to 2009
01990 to 1999
2Before 1990
Housing units lacking complete plumbing facilities: 10.2% Housing units lacking complete kitchen facilities: 6.3%
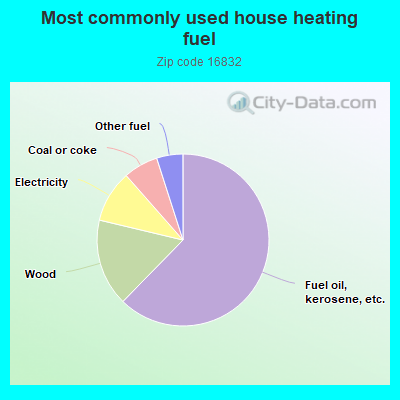
63.0%Fuel oil, kerosene, etc.
16.6%Wood
9.9%Electricity
6.6%Coal or coke
5.0%Other fuel
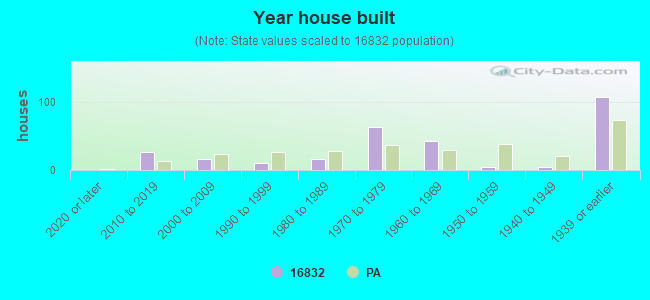
Population in 1990: 836.
Place of birth for U.S.-born residents:
This state: 245
Northeast: 3
Midwest: 16
South: 17
West: 12
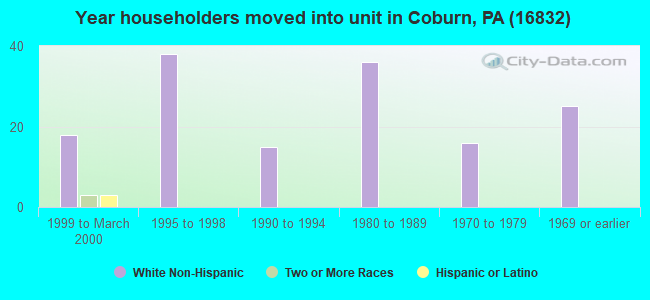
66% of the 16832 zip code residents lived in the same house 5 years ago. Out of people who lived in different houses, 61% lived in this county. Out of people who lived in different counties, 50% lived in Pennsylvania.
99% of the 16832 zip code residents lived in the same house 1 year ago. Out of people who lived in different houses, 100% moved from this county.
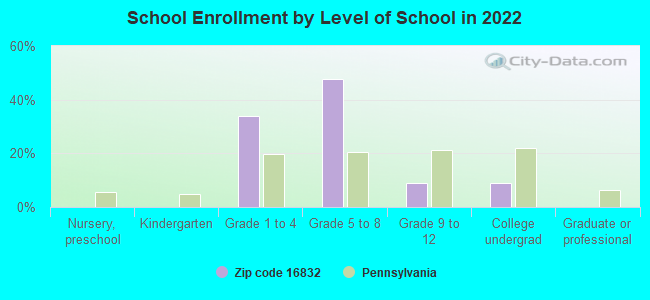
Private vs. public school enrollment:
Students in private schools in grades 1 to 8 (elementary and middle school): 5
Here:
14.6%
Pennsylvania:
15.7%
Students in private schools in grades 9 to 12 (high school):
Here:
0.0%
Pennsylvania:
13.4%
Students in private undergraduate colleges:
Here:
0.0%
Pennsylvania:
39.8%
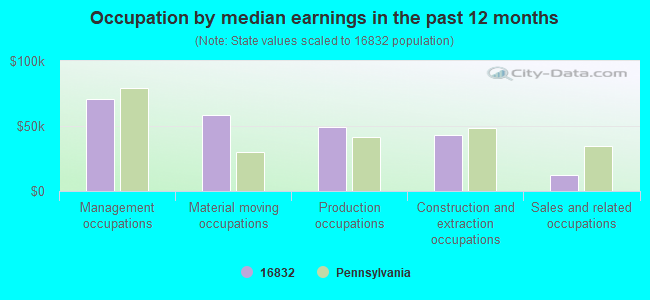
Occupation by median earnings in the past 12 months ($)
70,962Management occupations
58,481Material moving occupations
49,433Production occupations
43,080Construction and extraction occupations
12,302Sales and related occupations
Top industries in this zip code by the number of employees in 2005:
Construction: All Other Specialty Trade Contractors (5-9 employees: 1 establishment)
Construction: Plumbing, Heating, and Air-Conditioning Contractors (1-4: 1)
Other Services (except Public Administration): Religious Organizations (1-4: 1)
Construction: Masonry Contractors (1-4: 1)
Fatal accident statistics in 2011:
Fatal accident count: 1
Vehicles involved in fatal accidents: 1
Fatal accidents caused by drunken drivers: 1
Fatalities: 1
Persons involved in fatal accidents: 4
Pedestrians involved in fatal accidents: 0
Fatal accident statistics in 2010:
Fatal accident count: 1
Vehicles involved in fatal accidents: 1
Fatal accidents caused by drunken drivers: 0
Fatalities: 1
Persons involved in fatal accidents: 1
Pedestrians involved in fatal accidents: 0
Home Mortgage Disclosure Act Aggregated Statistics For Year 2009 (Based on 2 partial tracts)
A) FHA, FSA/RHS & VA Home Purchase Loans
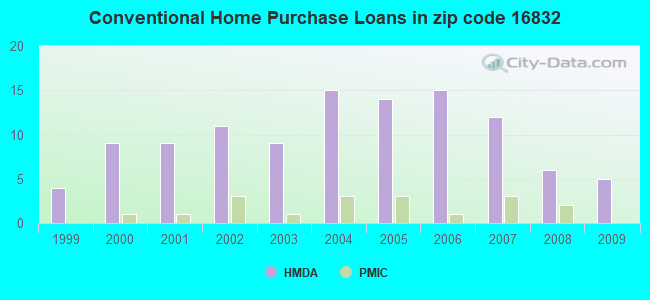
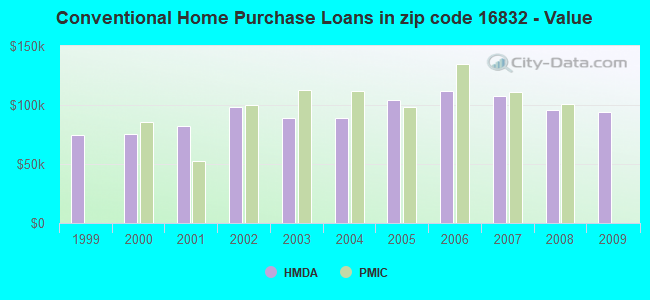
B) Conventional Home Purchase Loans
C) Refinancings
D) Home Improvement Loans
F) Non-occupant Loans on < 5 Family Dwellings (A B C & D)
G) Loans On Manufactured Home Dwelling (A B C & D)
Number
Average Value
Number
Average Value
Number
Average Value
Number
Average Value
Number
Average Value
Number
Average Value
LOANS ORIGINATED
3
$158,680
5
$93,774
24
$123,846
5
$36,484
2
$121,610
1
$90,170
APPLICATIONS APPROVED, NOT ACCEPTED
0
$0
0
$0
2
$78,955
0
$0
0
$0
0
$0
APPLICATIONS DENIED
1
$86,930
1
$75,140
7
$128,019
2
$63,925
1
$110,280
1
$58,720
APPLICATIONS WITHDRAWN
0
$0
0
$0
4
$160,685
0
$0
0
$0
0
$0
FILES CLOSED FOR INCOMPLETENESS
0
$0
0
$0
0
$0
0
$0
0
$0
0
$0
Aggregated Statistics For Year 2008 (Based on 2 partial tracts)
A) FHA, FSA/RHS & VA Home Purchase Loans
B) Conventional Home Purchase Loans
C) Refinancings
D) Home Improvement Loans
F) Non-occupant Loans on < 5 Family Dwellings (A B C & D)
G) Loans On Manufactured Home Dwelling (A B C & D)
Number
Average Value
Number
Average Value
Number
Average Value
Number
Average Value
Number
Average Value
Number
Average Value
LOANS ORIGINATED
2
$75,255
6
$95,872
18
$105,928
8
$40,749
3
$98,953
2
$70,055
APPLICATIONS APPROVED, NOT ACCEPTED
0
$0
0
$0
1
$152,590
0
$0
0
$0
0
$0
APPLICATIONS DENIED
0
$0
1
$105,200
12
$133,884
2
$48,090
0
$0
2
$76,645
APPLICATIONS WITHDRAWN
0
$0
1
$37,220
2
$170,625
0
$0
0
$0
0
$0
FILES CLOSED FOR INCOMPLETENESS
0
$0
0
$0
0
$0
0
$0
0
$0
0
$0
Aggregated Statistics For Year 2007 (Based on 2 partial tracts)
A) FHA, FSA/RHS & VA Home Purchase Loans
B) Conventional Home Purchase Loans
C) Refinancings
D) Home Improvement Loans
F) Non-occupant Loans on < 5 Family Dwellings (A B C & D)
G) Loans On Manufactured Home Dwelling (A B C & D)
Number
Average Value
Number
Average Value
Number
Average Value
Number
Average Value
Number
Average Value
Number
Average Value
LOANS ORIGINATED
1
$104,500
12
$107,932
17
$107,562
9
$36,350
2
$101,845
1
$86,930
APPLICATIONS APPROVED, NOT ACCEPTED
0
$0
1
$66,820
2
$113,290
0
$0
1
$64,270
0
$0
APPLICATIONS DENIED
0
$0
2
$67,625
14
$111,604
2
$68,550
1
$118,610
1
$102,650
APPLICATIONS WITHDRAWN
0
$0
1
$66,590
2
$132,710
1
$50,630
1
$40,920
0
$0
FILES CLOSED FOR INCOMPLETENESS
0
$0
0
$0
2
$227,615
0
$0
0
$0
0
$0
Aggregated Statistics For Year 2006 (Based on 2 partial tracts)
A) FHA, FSA/RHS & VA Home Purchase Loans
B) Conventional Home Purchase Loans
C) Refinancings
D) Home Improvement Loans
F) Non-occupant Loans on < 5 Family Dwellings (A B C & D)
G) Loans On Manufactured Home Dwelling (A B C & D)
Number
Average Value
Number
Average Value
Number
Average Value
Number
Average Value
Number
Average Value
Number
Average Value
LOANS ORIGINATED
2
$134,675
15
$111,793
25
$103,208
10
$41,084
3
$99,880
3
$66,277
APPLICATIONS APPROVED, NOT ACCEPTED
0
$0
1
$198,830
3
$112,903
0
$0
0
$0
0
$0
APPLICATIONS DENIED
0
$0
2
$73,870
13
$92,338
2
$28,900
0
$0
2
$55,835
APPLICATIONS WITHDRAWN
0
$0
0
$0
6
$118,837
0
$0
0
$0
0
$0
FILES CLOSED FOR INCOMPLETENESS
0
$0
1
$90,630
2
$154,675
0
$0
0
$0
0
$0
Aggregated Statistics For Year 2005 (Based on 2 partial tracts)
B) Conventional Home Purchase Loans
C) Refinancings
D) Home Improvement Loans
F) Non-occupant Loans on < 5 Family Dwellings (A B C & D)
G) Loans On Manufactured Home Dwelling (A B C & D)
Number
Average Value
Number
Average Value
Number
Average Value
Number
Average Value
Number
Average Value
LOANS ORIGINATED
14
$104,519
22
$97,262
8
$46,095
2
$83,350
1
$71,670
APPLICATIONS APPROVED, NOT ACCEPTED
0
$0
3
$79,380
0
$0
0
$0
0
$0
APPLICATIONS DENIED
3
$71,440
15
$127,669
2
$69,130
1
$95,950
2
$80,575
APPLICATIONS WITHDRAWN
1
$107,050
8
$112,796
0
$0
0
$0
0
$0
FILES CLOSED FOR INCOMPLETENESS
0
$0
2
$89,475
0
$0
0
$0
0
$0
Aggregated Statistics For Year 2004 (Based on 2 partial tracts)
B) Conventional Home Purchase Loans
C) Refinancings
D) Home Improvement Loans
F) Non-occupant Loans on < 5 Family Dwellings (A B C & D)
G) Loans On Manufactured Home Dwelling (A B C & D)
Number
Average Value
Number
Average Value
Number
Average Value
Number
Average Value
Number
Average Value
LOANS ORIGINATED
15
$88,719
29
$98,084
8
$41,298
3
$130,090
1
$72,830
APPLICATIONS APPROVED, NOT ACCEPTED
1
$76,300
5
$96,688
1
$64,500
0
$0
0
$0
APPLICATIONS DENIED
3
$70,130
10
$89,729
1
$35,840
0
$0
2
$56,415
APPLICATIONS WITHDRAWN
2
$99,880
7
$119,266
0
$0
0
$0
0
$0
FILES CLOSED FOR INCOMPLETENESS
0
$0
2
$97,105
0
$0
0
$0
0
$0
Aggregated Statistics For Year 2003 (Based on 2 partial tracts)
B) Conventional Home Purchase Loans
C) Refinancings
D) Home Improvement Loans
F) Non-occupant Loans on < 5 Family Dwellings (A B C & D)
Number
Average Value
Number
Average Value
Number
Average Value
Number
Average Value
LOANS ORIGINATED
9
$89,114
41
$83,660
5
$29,362
2
$76,525
APPLICATIONS APPROVED, NOT ACCEPTED
0
$0
5
$92,434
1
$23,350
1
$106,810
APPLICATIONS DENIED
1
$71,210
11
$88,403
1
$91,090
0
$0
APPLICATIONS WITHDRAWN
1
$95,950
12
$108,818
0
$0
0
$0
FILES CLOSED FOR INCOMPLETENESS
0
$0
2
$102,190
0
$0
0
$0
Aggregated Statistics For Year 2002 (Based on 2 partial tracts)
A) FHA, FSA/RHS & VA Home Purchase Loans
B) Conventional Home Purchase Loans
C) Refinancings
D) Home Improvement Loans
F) Non-occupant Loans on < 5 Family Dwellings (A B C & D)
Number
Average Value
Number
Average Value
Number
Average Value
Number
Average Value
Number
Average Value
LOANS ORIGINATED
2
$101,380
11
$98,323
32
$83,796
3
$41,000
1
$152,820
APPLICATIONS APPROVED, NOT ACCEPTED
0
$0
1
$50,630
5
$70,054
1
$37,450
0
$0
APPLICATIONS DENIED
0
$0
2
$69,130
14
$88,434
1
$14,330
1
$49,480
APPLICATIONS WITHDRAWN
0
$0
1
$143,340
8
$91,902
0
$0
0
$0
FILES CLOSED FOR INCOMPLETENESS
0
$0
0
$0
1
$154,440
0
$0
0
$0
Aggregated Statistics For Year 2001 (Based on 2 partial tracts)
A) FHA, FSA/RHS & VA Home Purchase Loans
B) Conventional Home Purchase Loans
C) Refinancings
D) Home Improvement Loans
F) Non-occupant Loans on < 5 Family Dwellings (A B C & D)
Number
Average Value
Number
Average Value
Number
Average Value
Number
Average Value
Number
Average Value
LOANS ORIGINATED
2
$81,265
9
$82,616
22
$78,650
4
$20,172
2
$69,705
APPLICATIONS APPROVED, NOT ACCEPTED
0
$0
2
$92,940
4
$74,272
1
$15,950
0
$0
APPLICATIONS DENIED
0
$0
5
$61,500
12
$87,894
1
$11,100
0
$0
APPLICATIONS WITHDRAWN
0
$0
0
$0
6
$95,332
1
$52,020
0
$0
FILES CLOSED FOR INCOMPLETENESS
0
$0
0
$0
2
$81,500
0
$0
0
$0
Aggregated Statistics For Year 2000 (Based on 2 partial tracts)
A) FHA, FSA/RHS & VA Home Purchase Loans
B) Conventional Home Purchase Loans
C) Refinancings
D) Home Improvement Loans
F) Non-occupant Loans on < 5 Family Dwellings (A B C & D)
Number
Average Value
Number
Average Value
Number
Average Value
Number
Average Value
Number
Average Value
LOANS ORIGINATED
1
$98,030
9
$75,089
7
$59,056
6
$21,193
2
$33,175
APPLICATIONS APPROVED, NOT ACCEPTED
0
$0
2
$41,270
2
$71,325
1
$56,180
0
$0
APPLICATIONS DENIED
0
$0
4
$73,752
7
$65,926
2
$14,910
0
$0
APPLICATIONS WITHDRAWN
0
$0
0
$0
4
$58,435
0
$0
0
$0
FILES CLOSED FOR INCOMPLETENESS
0
$0
0
$0
1
$45,320
0
$0
0
$0
Aggregated Statistics For Year 1999 (Based on 1 partial tract)
A) FHA, FSA/RHS & VA Home Purchase Loans
B) Conventional Home Purchase Loans
C) Refinancings
D) Home Improvement Loans
F) Non-occupant Loans on < 5 Family Dwellings (A B C & D)


 Nearest zip codes: 16854, 17063, 16820, 16852, 16875, 17885.