Estimated zip code population in 2022: 736 Zip code population in 2010: 947 Zip code population in 2000: 831
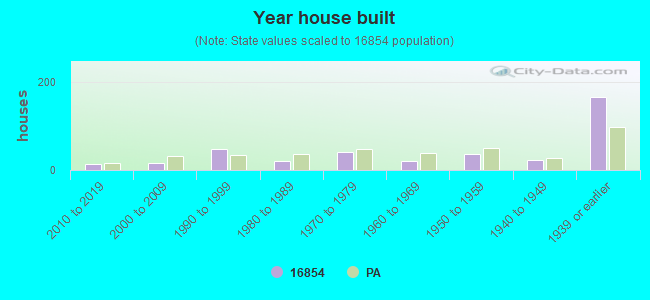
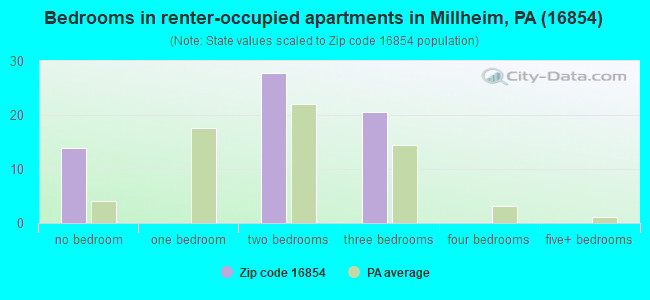
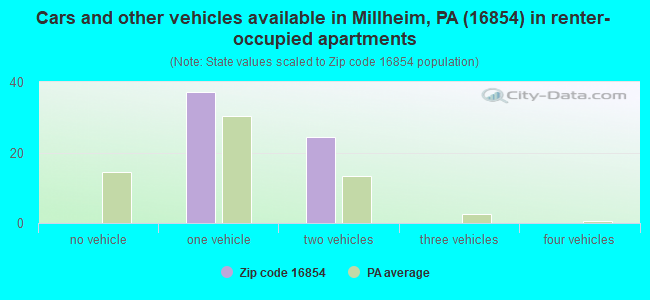
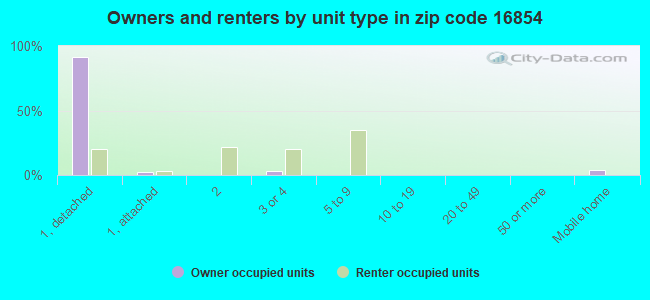
Houses and condos: 392 Renter-occupied apartments: 61
% of renters here:
17%
State:
31%
March 2022 cost of living index in zip code 16854: 92.7 (less than average, U.S. average is 100)
Land area: 2.4 sq. mi. Water area: 0.0 sq. mi.
Population density: 308 people per square mile
(very low).
OSM Map
General Map
Google Map
MSN Map
OSM Map
General Map
Google Map
MSN Map
OSM Map
General Map
Google Map
MSN Map
OSM Map
General Map
Google Map
MSN Map
Please wait while loading the map...
Real estate property taxes paid for housing units in 2022:
This zip code:
1.0% ($2,313)
Pennsylvania:
1.3% ($3,094)
Median real estate property taxes paid for housing units with mortgages in 2022: $2,548 (1.1%) Median real estate property taxes paid for housing units with no mortgage in 2022: $2,229 (1.0%)
Business Search- 14 Million verified businesses
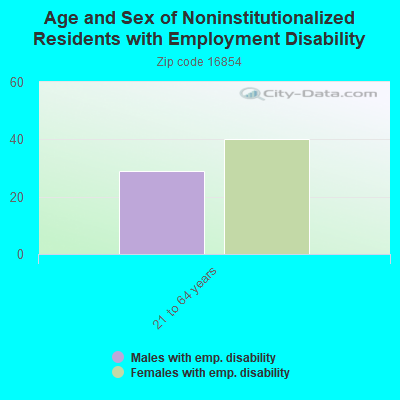
Males: 398
(54.1%)
Females: 337
(45.9%)
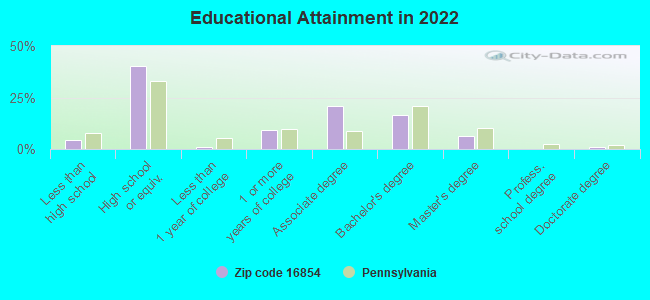
For population 25 years and over in 16854:
High school or higher: 94.6%
Bachelor's degree or higher: 23.9%
Graduate or professional degree: 7.4%
Mean travel time to work (commute): 29.6 minutes
For population 15 years and over in 16854:
Never married: 22.1%
Now married: 50.5%
Separated: 1.2%
Widowed: 10.9%
Divorced: 15.3%
Zip code 16854 compared to state average:
Unemployed percentage significantly below state average.
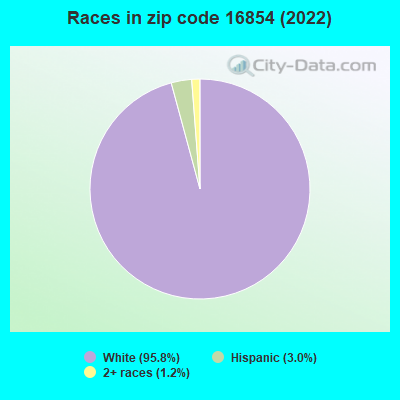
Black race population percentage significantly below state average.
Hispanic race population percentage below state average.
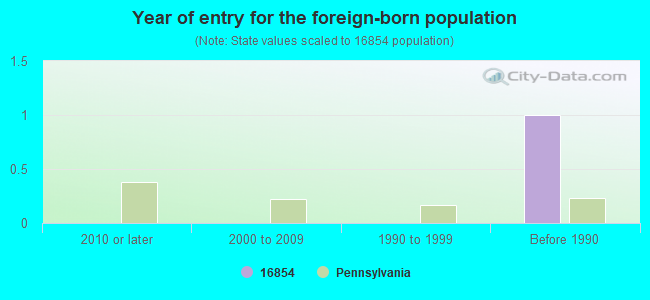
Foreign-born population percentage significantly below state average.
Renting percentage below state average.
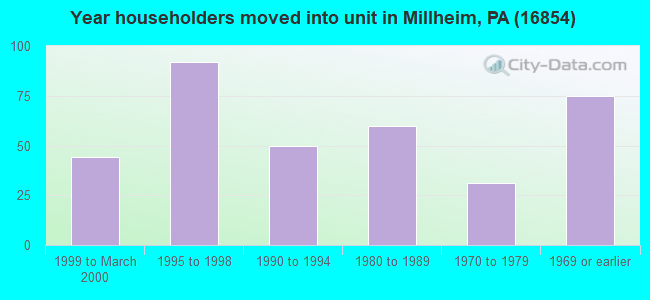
Length of stay since moving in above state average.
Averages for the 2020 tax year for zip code 16854, filed in 2021:
Average Adjusted Gross Income (AGI) in 2020: $47,577 (Individual Income Tax Returns)
Here:
$47,577
State:
$75,707
Salary/wage: $42,428 (reported on 73.6% of returns)
Here:
$42,428
State:
$62,806
(% of AGI for various income ranges: 1206.0% for AGIs below $25k, 3402.1% for AGIs $25k-50k, 5218.6% for AGIs $50k-75k, 8380.0% for AGIs $75k-100k, 14703.3% for AGIs $100k-200k)
Taxable interest for individuals: $518 (reported on 32.1% of returns)
This zip code:
$518
Pennsylvania:
$1,633
(% of AGI for various income ranges: 22.0% for AGIs below $25k, 9.3% for AGIs $25k-50k, 28.6% for AGIs $50k-75k, 110.0% for AGIs $100k-200k)
Ordinary dividends: $2,570 (reported on 18.9% of returns)
Here:
$2,570
State:
$7,382
(% of AGI for various income ranges: 77.0% for AGIs below $25k, 211.4% for AGIs $50k-75k, 106.7% for AGIs $75k-100k)
Net capital gain/loss in AGI: +$986 (reported on 13.2% of returns)
Here:
+$986
State:
+$23,522
(% of AGI for various income ranges: 12.0% for AGIs below $25k, 26.4% for AGIs $25k-50k, 66.7% for AGIs $75k-100k)
Profit/loss from business: +$10,967 (reported on 17.0% of returns)
Here:
+$10,967
State:
+$16,274
(% of AGI for various income ranges: 410.0% for AGIs below $25k, 824.3% for AGIs $50k-75k)
Taxable individual retirement arrangement distribution: $6,143 (reported on 13.2% of returns)
16854:
$6,143
Pennsylvania:
$18,583
(% of AGI for various income ranges: 226.0% for AGIs below $25k, 291.4% for AGIs $50k-75k)
Earned income credit: $1,600 (reported on 13.2% of returns)
Here:
$1,600
State:
$2,100
(% of AGI for various income ranges: 46.0% for AGIs below $25k, 47.1% for AGIs $25k-50k)
Percentage of individuals using paid preparers for their 2020 taxes: 96.2%
Here:
96%
State:
92%
(% for various income ranges: 94.4% for AGIs below $25k, 94.1% for AGIs $25k-50k, 100.0% for AGIs $50k-75k, 100.0% for AGIs $75k-100k, 100.0% for AGIs $100k-200k)
Averages for the 2012 tax year for zip code 16854, filed in 2013:
Average Adjusted Gross Income (AGI) in 2012: $38,896 (Individual Income Tax Returns)
Here:
$38,896
State:
$61,346
Salary/wage: $34,474 (reported on 81.1% of returns)
Here:
$34,474
State:
$51,902
(% of AGI for various income ranges: 65.2% for AGIs below $25k, 79.9% for AGIs $25k-50k, 68.8% for AGIs $50k-75k, 71.4% for AGIs $75k-100k, 67.6% for AGIs $100k-200k)
Taxable interest for individuals: $511 (reported on 34.0% of returns)
This zip code:
$511
Pennsylvania:
$1,588
(% of AGI for various income ranges: 1.7% for AGIs below $25k, 0.4% for AGIs $25k-50k, 0.2% for AGIs $50k-75k, 0.1% for AGIs $75k-100k, 0.4% for AGIs $100k-200k)
Ordinary dividends: $1,227 (reported on 20.8% of returns)
Here:
$1,227
State:
$5,827
(% of AGI for various income ranges: 1.6% for AGIs below $25k, 0.3% for AGIs $25k-50k, 2.0% for AGIs $75k-100k)
Net capital gain/loss in AGI: +$6,833 (reported on 11.3% of returns)
Here:
+$6,833
State:
+$14,495
(% of AGI for various income ranges: 0.2% for AGIs $25k-50k, 11.0% for AGIs $75k-100k)
Profit/loss from business: +$9,480 (reported on 18.9% of returns)
Here:
+$9,480
State:
+$16,268
(% of AGI for various income ranges: 9.3% for AGIs below $25k, 1.5% for AGIs $25k-50k, 13.2% for AGIs $50k-75k)
Taxable individual retirement arrangement distribution: $7,886 (reported on 13.2% of returns)
16854:
$7,886
Pennsylvania:
$14,550
(% of AGI for various income ranges: 2.4% for AGIs below $25k, 3.4% for AGIs $25k-50k, 6.0% for AGIs $50k-75k)
Total itemized deductions: $14,909 (21% of AGI, reported on 20.8% of returns)
Here:
$14,909
State:
$23,538
Here:
21.4% of AGI
State:
18.4% of AGI
(% of AGI for various income ranges: 7.0% for AGIs $25k-50k, 9.1% for AGIs $50k-75k, 10.5% for AGIs $75k-100k, 11.0% for AGIs $100k-200k)
Charity contributions: $1,500 (reported on 11.3% of returns)
Here:
$1,500
State:
$4,025
(% of AGI for various income ranges: 0.7% for AGIs $25k-50k, 1.4% for AGIs $75k-100k)
Taxes paid: $5,764 (reported on 20.8% of returns)
16854:
$5,764
State:
$9,982
(% of AGI for various income ranges: 2.0% for AGIs $25k-50k, 3.6% for AGIs $50k-75k, 4.4% for AGIs $75k-100k, 5.0% for AGIs $100k-200k)
Earned income credit: $1,590 (reported on 18.9% of returns)
Here:
$1,590
State:
$2,106
(% of AGI for various income ranges: 3.6% for AGIs below $25k, 1.2% for AGIs $25k-50k)
Percentage of individuals using paid preparers for their 2012 taxes: 54.7%
Here:
55%
State:
53%
(% for various income ranges: 42.9% for AGIs below $25k, 58.8% for AGIs $25k-50k, 62.5% for AGIs $50k-75k, 125.0% for AGIs $75k-100k)
Averages for the 2004 tax year for zip code 16854, filed in 2005:
Average Adjusted Gross Income (AGI) in 2004: $34,272 (Individual Income Tax Returns)
Here:
$34,272
State:
$48,049
Salary/wage: $31,487 (reported on 80.4% of returns)
Here:
$31,487
State:
$42,646
(% of AGI for various income ranges: 95.6% for AGIs below $10k, 65.8% for AGIs $10k-25k, 75.6% for AGIs $25k-50k, 81.5% for AGIs $50k-75k, 129.0% for AGIs $75k-100k)
Taxable interest for individuals: $1,097 (reported on 52.6% of returns)
This zip code:
$1,097
Pennsylvania:
$1,657
(% of AGI for various income ranges: 6.8% for AGIs below $10k, 3.1% for AGIs $10k-25k, 2.6% for AGIs $25k-50k, 0.7% for AGIs $50k-75k, 0.4% for AGIs $75k-100k, 0.5% for AGIs over 100k)
Taxable dividends: $1,852 (reported on 23.0% of returns)
Here:
$1,852
State:
$3,566
(% of AGI for various income ranges: 1.4% for AGIs below $10k, 2.3% for AGIs $10k-25k, 1.8% for AGIs $25k-50k, 0.7% for AGIs $50k-75k, 1.0% for AGIs $75k-100k)
Net capital gain/loss: +$3,217 (reported on 12.8% of returns)
Here:
+$3,217
State:
+$9,716
Profit/loss from business: +$6,128 (reported on 16.6% of returns)
Here:
+$6,128
State:
+$14,267
(% of AGI for various income ranges: 9.6% for AGIs below $10k, 2.9% for AGIs $10k-25k, 3.9% for AGIs $25k-50k, 3.4% for AGIs $50k-75k)
IRA payment deduction: $1,789 (reported on 4.0% of returns)
16854:
$1,789
Pennsylvania:
$2,903
Total itemized deductions: $13,480 (24% of AGI, reported on 26.2% of returns)
Here:
$13,480
State:
$18,804
Here:
24.1% of AGI
State:
19.5% of AGI
(% of AGI for various income ranges: 14.6% for AGIs $10k-25k, 6.3% for AGIs $25k-50k, 11.9% for AGIs $50k-75k, 26.8% for AGIs $75k-100k)
Charity contributions deductions: $1,396 (2% of AGI, reported on 20.4% of returns)
Here:
$1,396
State:
$3,337
Here:
2.4% of AGI
State:
3.3% of AGI
(% of AGI for various income ranges: 0.9% for AGIs $10k-25k, 0.8% for AGIs $25k-50k, 1.0% for AGIs $50k-75k, 1.5% for AGIs $75k-100k)
Total tax: $3,664 (reported on 77.9% of returns)
16854:
$3,664
State:
$8,008
(% of AGI for various income ranges: 3.1% for AGIs below $10k, 4.2% for AGIs $10k-25k, 7.0% for AGIs $25k-50k, 8.1% for AGIs $50k-75k, 10.3% for AGIs $75k-100k, 17.2% for AGIs over 100k)
Earned income credit: $1,400 (reported on 10.6% of returns)
Here:
$1,400
State:
$1,643
Percentage of individuals using paid preparers for their 2004 taxes: 58.3%
Here:
58%
State:
56%
(% for various income ranges: 54.3% for AGIs below $10k, 54.1% for AGIs $10k-25k, 61.6% for AGIs $25k-50k, 58.9% for AGIs $50k-75k, 117.6% for AGIs $75k-100k)
Size of family households: 88 2-persons, 30 3-persons, 43 4-persons, 2 5-persons, 1 6-persons, 7 7-or-more-persons
Size of nonfamily households: 177 1-person, 7 2-persons
121 married couples with children.
11 single-parent households (11 men).
85.2% of residents of 16854 zip code speak English at home.
0.7% of residents speak Spanish at home (100% very well).
13.4% of residents speak other Indo-European language at home (86% very well, 12% well, 1% not well).
Foreign born population: 0 (0.0%)
:
0.0%
Whole state:
7.5%
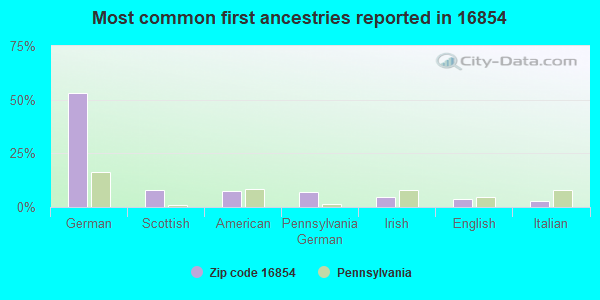
53%German
8%Scottish
8%American
7%Pennsylvania German
5%Irish
4%English
3%Italian
Year of entry for the foreign-born population
02010 or later
02000 to 2009
01990 to 1999
1Before 1990
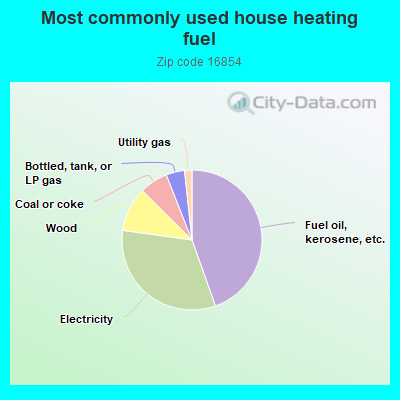
44.8%Fuel oil, kerosene, etc.
32.8%Electricity
10.3%Wood
6.6%Coal or coke
4.3%Bottled, tank, or LP gas
1.7%Utility gas
Population in 1990: 1,978.
Place of birth for U.S.-born residents:
This state: 654
Northeast: 11
Midwest: 19
South: 28
West: 14
62% of the 16854 zip code residents lived in the same house 5 years ago. Out of people who lived in different houses, 79% lived in this county. Out of people who lived in different counties, 50% lived in Pennsylvania.
101% of the 16854 zip code residents lived in the same house 1 year ago.
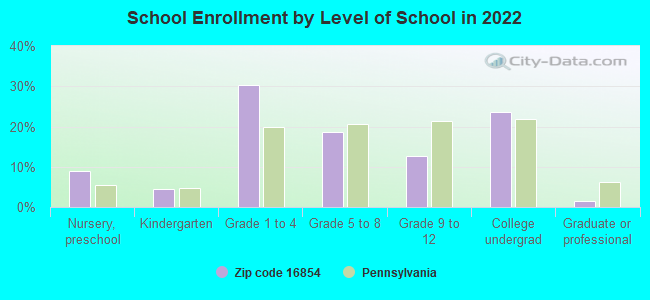
Private vs. public school enrollment:
Students in private schools in grades 1 to 8 (elementary and middle school): 13
Here:
20.2%
Pennsylvania:
15.7%
Students in private schools in grades 9 to 12 (high school): 5
Here:
32.5%
Pennsylvania:
13.4%
Students in private undergraduate colleges:
Here:
0.0%
Pennsylvania:
39.8%
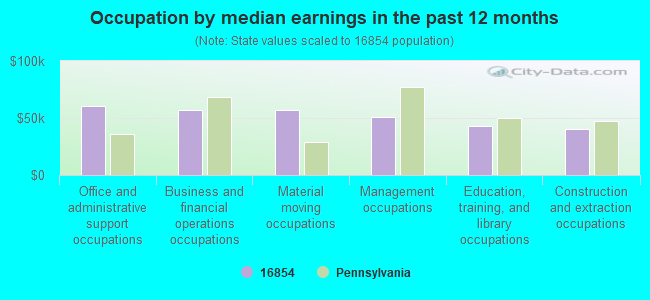
Occupation by median earnings in the past 12 months ($)
60,267Office and administrative support occupations
57,433Business and financial operations occupations
56,662Material moving occupations
50,651Management occupations
42,755Education, training, and library occupations
40,157Construction and extraction occupations
Top industries in this zip code by the number of employees in 2005:
Other Services (except Public Administration): Religious Organizations (10-19 employees: 1 establishment, 1-4 employees: 3 establishments)
Other Services (except Public Administration): Business Associations (10-19: 1)
Professional, Scientific, and Technical Services: Engineering Services (10-19: 1)
Accommodation and Food Services: Limited-Service Restaurants (10-19: 1)
Other Services (except Public Administration): General Automotive Repair (5-9: 1, 1-4: 2)
Finance and Insurance: Commercial Banking (5-9: 1, 1-4: 1)
Construction: Plumbing, Heating, and Air-Conditioning Contractors (5-9: 1)
Home Mortgage Disclosure Act Aggregated Statistics For Year 2009 (Based on 2 partial tracts)
A) FHA, FSA/RHS & VA Home Purchase Loans
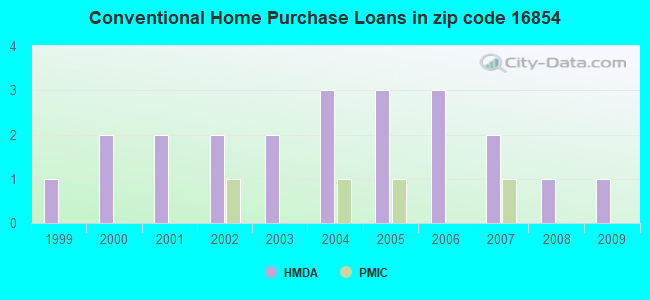
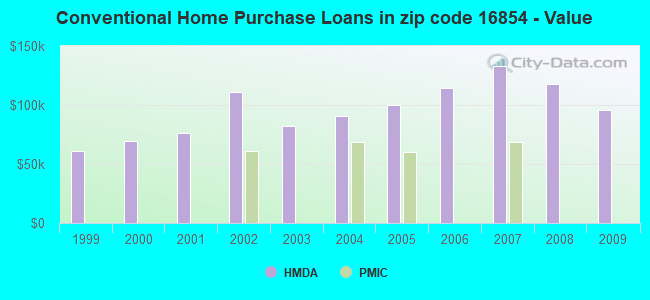
B) Conventional Home Purchase Loans
C) Refinancings
D) Home Improvement Loans
Number
Average Value
Number
Average Value
Number
Average Value
Number
Average Value
LOANS ORIGINATED
1
$97,600
1
$96,130
5
$121,874
1
$37,400
APPLICATIONS APPROVED, NOT ACCEPTED
0
$0
0
$0
0
$0
0
$0
APPLICATIONS DENIED
0
$0
0
$0
1
$183,720
0
$0
APPLICATIONS WITHDRAWN
0
$0
0
$0
1
$131,770
0
$0
FILES CLOSED FOR INCOMPLETENESS
0
$0
0
$0
0
$0
0
$0
Aggregated Statistics For Year 2008 (Based on 2 partial tracts)
B) Conventional Home Purchase Loans
C) Refinancings
D) Home Improvement Loans
F) Non-occupant Loans on < 5 Family Dwellings (A B C & D)
Number
Average Value
Number
Average Value
Number
Average Value
Number
Average Value
LOANS ORIGINATED
1
$117,930
4
$97,728
2
$33,415
1
$60,860
APPLICATIONS APPROVED, NOT ACCEPTED
0
$0
0
$0
0
$0
0
$0
APPLICATIONS DENIED
0
$0
2
$164,690
0
$0
0
$0
APPLICATIONS WITHDRAWN
0
$0
0
$0
0
$0
0
$0
FILES CLOSED FOR INCOMPLETENESS
0
$0
0
$0
0
$0
0
$0
Aggregated Statistics For Year 2007 (Based on 2 partial tracts)
B) Conventional Home Purchase Loans
C) Refinancings
D) Home Improvement Loans
Number
Average Value
Number
Average Value
Number
Average Value
LOANS ORIGINATED
2
$132,765
3
$124,963
2
$33,535
APPLICATIONS APPROVED, NOT ACCEPTED
0
$0
0
$0
0
$0
APPLICATIONS DENIED
0
$0
3
$106,777
0
$0
APPLICATIONS WITHDRAWN
0
$0
0
$0
0
$0
FILES CLOSED FOR INCOMPLETENESS
0
$0
0
$0
0
$0
Aggregated Statistics For Year 2006 (Based on 2 partial tracts)
B) Conventional Home Purchase Loans
C) Refinancings
D) Home Improvement Loans
F) Non-occupant Loans on < 5 Family Dwellings (A B C & D)
G) Loans On Manufactured Home Dwelling (A B C & D)
Number
Average Value
Number
Average Value
Number
Average Value
Number
Average Value
Number
Average Value
LOANS ORIGINATED
3
$114,597
5
$105,796
2
$42,115
1
$61,430
1
$40,760
APPLICATIONS APPROVED, NOT ACCEPTED
0
$0
1
$69,440
0
$0
0
$0
0
$0
APPLICATIONS DENIED
0
$0
3
$82,033
0
$0
0
$0
0
$0
APPLICATIONS WITHDRAWN
0
$0
1
$146,180
0
$0
0
$0
0
$0
FILES CLOSED FOR INCOMPLETENESS
0
$0
0
$0
0
$0
0
$0
0
$0
Aggregated Statistics For Year 2005 (Based on 2 partial tracts)
B) Conventional Home Purchase Loans
C) Refinancings
D) Home Improvement Loans
Number
Average Value
Number
Average Value
Number
Average Value
LOANS ORIGINATED
3
$99,997
5
$87,738
2
$37,800
APPLICATIONS APPROVED, NOT ACCEPTED
0
$0
1
$48,820
0
$0
APPLICATIONS DENIED
1
$43,940
3
$130,870
0
$0
APPLICATIONS WITHDRAWN
0
$0
2
$92,500
0
$0
FILES CLOSED FOR INCOMPLETENESS
0
$0
0
$0
0
$0
Aggregated Statistics For Year 2004 (Based on 2 partial tracts)
B) Conventional Home Purchase Loans
C) Refinancings
D) Home Improvement Loans
F) Non-occupant Loans on < 5 Family Dwellings (A B C & D)
Number
Average Value
Number
Average Value
Number
Average Value
Number
Average Value
LOANS ORIGINATED
3
$90,943
6
$97,193
2
$33,865
1
$80,010
APPLICATIONS APPROVED, NOT ACCEPTED
0
$0
1
$99,110
0
$0
0
$0
APPLICATIONS DENIED
1
$43,130
2
$91,980
0
$0
0
$0
APPLICATIONS WITHDRAWN
0
$0
2
$85,580
0
$0
0
$0
FILES CLOSED FOR INCOMPLETENESS
0
$0
0
$0
0
$0
0
$0
Aggregated Statistics For Year 2003 (Based on 2 partial tracts)
B) Conventional Home Purchase Loans
C) Refinancings
D) Home Improvement Loans
Number
Average Value
Number
Average Value
Number
Average Value
LOANS ORIGINATED
2
$82,215
8
$87,904
1
$30,100
APPLICATIONS APPROVED, NOT ACCEPTED
0
$0
1
$94,750
0
$0
APPLICATIONS DENIED
0
$0
2
$99,680
0
$0
APPLICATIONS WITHDRAWN
0
$0
2
$133,860
0
$0
FILES CLOSED FOR INCOMPLETENESS
0
$0
0
$0
0
$0
Aggregated Statistics For Year 2002 (Based on 2 partial tracts)
B) Conventional Home Purchase Loans
C) Refinancings
D) Home Improvement Loans
Number
Average Value
Number
Average Value
Number
Average Value
LOANS ORIGINATED
2
$110,870
7
$78,536
1
$25,220
APPLICATIONS APPROVED, NOT ACCEPTED
0
$0
1
$71,810
0
$0
APPLICATIONS DENIED
0
$0
3
$84,610
0
$0
APPLICATIONS WITHDRAWN
0
$0
2
$75,365
0
$0
FILES CLOSED FOR INCOMPLETENESS
0
$0
0
$0
0
$0
Aggregated Statistics For Year 2001 (Based on 2 partial tracts)
B) Conventional Home Purchase Loans
C) Refinancings
D) Home Improvement Loans
Number
Average Value
Number
Average Value
Number
Average Value
LOANS ORIGINATED
2
$76,220
5
$70,948
1
$16,540
APPLICATIONS APPROVED, NOT ACCEPTED
0
$0
1
$60,910
0
$0
APPLICATIONS DENIED
1
$63,040
3
$72,080
0
$0
APPLICATIONS WITHDRAWN
0
$0
1
$117,270
0
$0
FILES CLOSED FOR INCOMPLETENESS
0
$0
0
$0
0
$0
Aggregated Statistics For Year 2000 (Based on 2 partial tracts)
B) Conventional Home Purchase Loans
C) Refinancings
D) Home Improvement Loans
Number
Average Value
Number
Average Value
Number
Average Value
LOANS ORIGINATED
2
$69,275
1
$84,750
1
$26,070
APPLICATIONS APPROVED, NOT ACCEPTED
0
$0
0
$0
0
$0
APPLICATIONS DENIED
1
$60,480
1
$94,610
0
$0
APPLICATIONS WITHDRAWN
0
$0
1
$47,920
0
$0
FILES CLOSED FOR INCOMPLETENESS
0
$0
0
$0
0
$0
Aggregated Statistics For Year 1999 (Based on 1 partial tract)

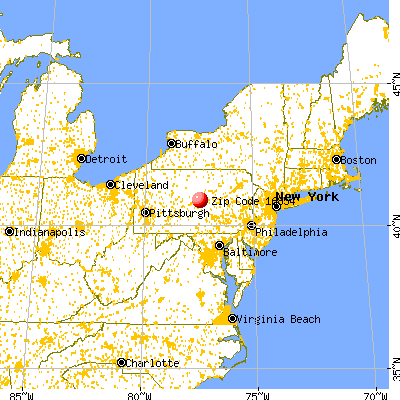


 Nearest zip codes: 16832, 16852, 16820, 16875, 16848, 16872.