Estimated zip code population in 2022: 1,596 Zip code population in 2010: 1,909 Zip code population in 2000: 1,873
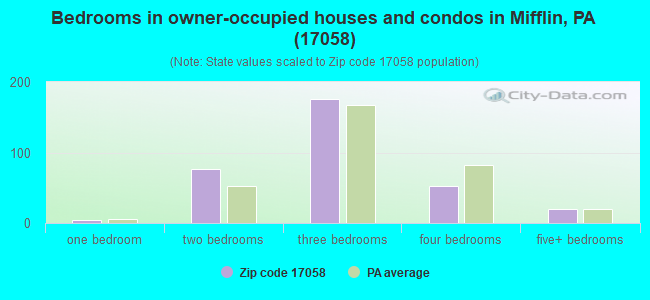
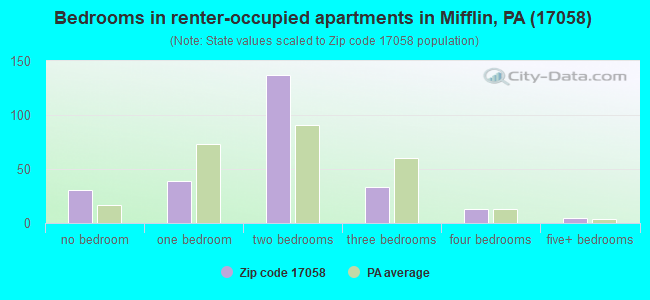
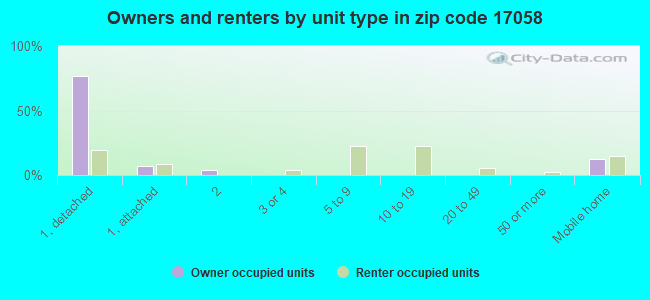
Houses and condos: 782 Renter-occupied apartments: 255
% of renters here:
44%
State:
31%
March 2022 cost of living index in zip code 17058: 85.2 (less than average, U.S. average is 100)
Land area: 39.5 sq. mi. Water area: 0.2 sq. mi.
Population density: 40 people per square mile
(very low).
OSM Map
General Map
Google Map
MSN Map
OSM Map
General Map
Google Map
MSN Map
OSM Map
General Map
Google Map
MSN Map
OSM Map
General Map
Google Map
MSN Map
Please wait while loading the map...
Real estate property taxes paid for housing units in 2022:
This zip code:
1.0% ($1,770)
Pennsylvania:
1.3% ($3,094)
Median real estate property taxes paid for housing units with mortgages in 2022: $2,010 (1.0%) Median real estate property taxes paid for housing units with no mortgage in 2022: $1,386 (0.8%)
Business Search- 14 Million verified businesses
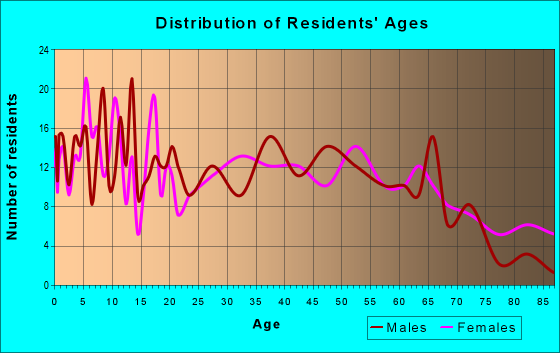
Males: 723
(45.3%)
Females: 873
(54.7%)
For population 25 years and over in 17058:
High school or higher: 82.6%
Bachelor's degree or higher: 10.2%
Graduate or professional degree: 3.2%
Unemployed: 2.6%
Mean travel time to work (commute): 29.3 minutes
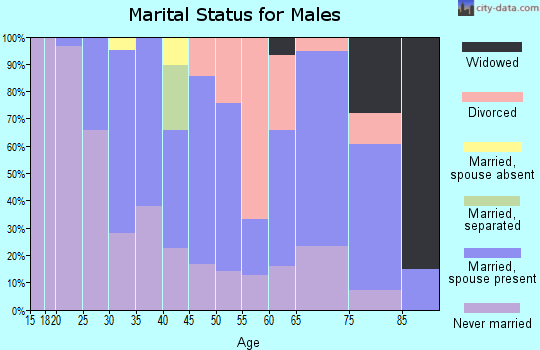
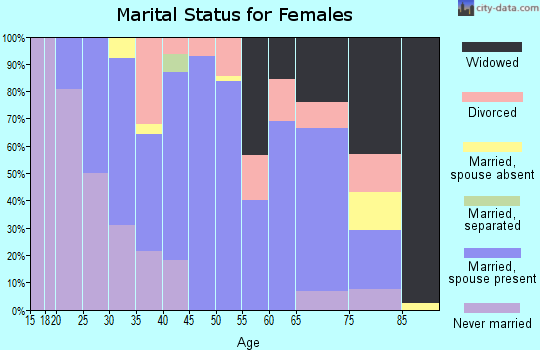
For population 15 years and over in 17058:
Never married: 34.3%
Now married: 44.4%
Separated: 2.0%
Widowed: 10.7%
Divorced: 8.6%
Zip code 17058 compared to state average:
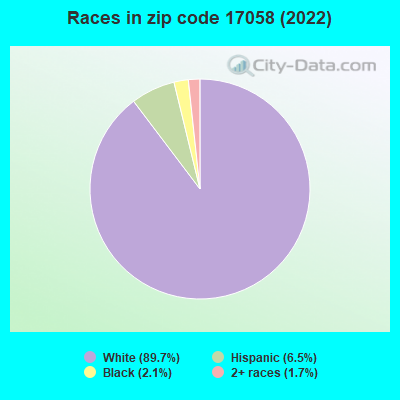
Black race population percentage significantly below state average.
Foreign-born population percentage significantly below state average.
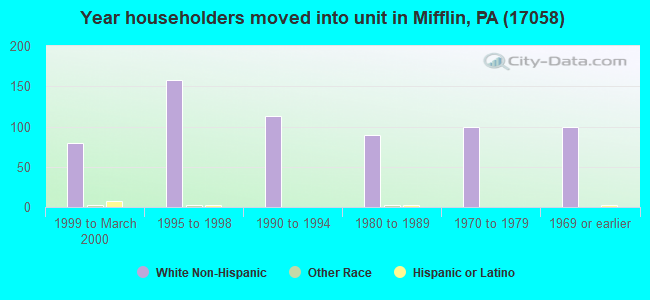
Length of stay since moving in above state average.
Number of college students significantly below state average.
Percentage of population with a bachelor's degree or higher significantly below state average.
Averages for the 2020 tax year for zip code 17058, filed in 2021:
Average Adjusted Gross Income (AGI) in 2020: $43,581 (Individual Income Tax Returns)
Here:
$43,581
State:
$75,707
Salary/wage: $40,899 (reported on 81.2% of returns)
Here:
$40,899
State:
$62,806
(% of AGI for various income ranges: 1170.0% for AGIs below $25k, 3809.0% for AGIs $25k-50k, 6291.2% for AGIs $50k-75k, 10525.0% for AGIs $75k-100k, 18038.0% for AGIs $100k-200k)
Taxable interest for individuals: $736 (reported on 25.9% of returns)
This zip code:
$736
Pennsylvania:
$1,633
(% of AGI for various income ranges: 22.0% for AGIs below $25k, 7.5% for AGIs $25k-50k, 26.2% for AGIs $50k-75k, 62.5% for AGIs $75k-100k, 114.0% for AGIs $100k-200k)
Ordinary dividends: $1,664 (reported on 12.9% of returns)
Here:
$1,664
State:
$7,382
(% of AGI for various income ranges: 28.0% for AGIs below $25k, 32.0% for AGIs $25k-50k, 126.0% for AGIs $100k-200k)
Net capital gain/loss in AGI: +$4,788 (reported on 9.4% of returns)
Here:
+$4,788
State:
+$23,522
(% of AGI for various income ranges: 39.5% for AGIs below $25k, 262.5% for AGIs $50k-75k, 188.0% for AGIs $100k-200k)
Profit/loss from business: +$12,856 (reported on 10.6% of returns)
Here:
+$12,856
State:
+$16,274
(% of AGI for various income ranges: 95.5% for AGIs below $25k, 638.8% for AGIs $50k-75k, 1137.5% for AGIs $75k-100k)
Taxable individual retirement arrangement distribution: $5,550 (reported on 7.1% of returns)
17058:
$5,550
Pennsylvania:
$18,583
(% of AGI for various income ranges: 55.0% for AGIs below $25k, 111.5% for AGIs $25k-50k)
Earned income credit: $2,257 (reported on 16.5% of returns)
Here:
$2,257
State:
$2,100
(% of AGI for various income ranges: 102.5% for AGIs below $25k, 55.5% for AGIs $25k-50k)
Percentage of individuals using paid preparers for their 2020 taxes: 91.8%
Here:
92%
State:
92%
(% for various income ranges: 90.6% for AGIs below $25k, 96.2% for AGIs $25k-50k, 91.7% for AGIs $50k-75k, 85.7% for AGIs $75k-100k, 87.5% for AGIs $100k-200k)
Averages for the 2012 tax year for zip code 17058, filed in 2013:
Average Adjusted Gross Income (AGI) in 2012: $38,506 (Individual Income Tax Returns)
Here:
$38,506
State:
$61,346
Salary/wage: $34,363 (reported on 82.7% of returns)
Here:
$34,363
State:
$51,902
(% of AGI for various income ranges: 71.0% for AGIs below $25k, 83.2% for AGIs $25k-50k, 75.2% for AGIs $50k-75k, 79.9% for AGIs $75k-100k, 59.6% for AGIs $100k-200k)
Taxable interest for individuals: $921 (reported on 34.6% of returns)
This zip code:
$921
Pennsylvania:
$1,588
(% of AGI for various income ranges: 3.3% for AGIs below $25k, 0.3% for AGIs $25k-50k, 0.6% for AGIs $50k-75k, 0.2% for AGIs $75k-100k, 0.6% for AGIs $100k-200k)
Ordinary dividends: $1,000 (reported on 13.6% of returns)
Here:
$1,000
State:
$5,827
(% of AGI for various income ranges: 1.0% for AGIs below $25k, 0.5% for AGIs $25k-50k, 0.5% for AGIs $75k-100k)
Net capital gain/loss in AGI: +$6,667 (reported on 7.4% of returns)
Here:
+$6,667
State:
+$14,495
Profit/loss from business: +$10,467 (reported on 11.1% of returns)
Here:
+$10,467
State:
+$16,268
(% of AGI for various income ranges: 4.6% for AGIs below $25k, 3.8% for AGIs $25k-50k, 9.3% for AGIs $75k-100k)
Taxable individual retirement arrangement distribution: $6,680 (reported on 6.2% of returns)
17058:
$6,680
Pennsylvania:
$14,550
Total itemized deductions: $17,079 (22% of AGI, reported on 17.3% of returns)
Here:
$17,079
State:
$23,538
Here:
22.0% of AGI
State:
18.4% of AGI
(% of AGI for various income ranges: 5.9% for AGIs $25k-50k, 7.8% for AGIs $50k-75k, 12.1% for AGIs $75k-100k, 10.9% for AGIs $100k-200k)
Charity contributions: $3,071 (reported on 8.6% of returns)
Here:
$3,071
State:
$4,025
(% of AGI for various income ranges: 1.1% for AGIs below $25k, 1.0% for AGIs $50k-75k, 1.4% for AGIs $100k-200k)
Taxes paid: $4,721 (reported on 17.3% of returns)
17058:
$4,721
State:
$9,982
(% of AGI for various income ranges: 1.3% for AGIs $25k-50k, 1.8% for AGIs $50k-75k, 2.8% for AGIs $75k-100k, 4.0% for AGIs $100k-200k)
Earned income credit: $2,106 (reported on 21.0% of returns)
Here:
$2,106
State:
$2,106
(% of AGI for various income ranges: 5.9% for AGIs below $25k, 1.4% for AGIs $25k-50k)
Percentage of individuals using paid preparers for their 2012 taxes: 63.0%
Here:
63%
State:
53%
(% for various income ranges: 60.0% for AGIs below $25k, 62.5% for AGIs $25k-50k, 63.6% for AGIs $50k-75k, 66.7% for AGIs $75k-100k, 80.0% for AGIs $100k-200k)
Averages for the 2004 tax year for zip code 17058, filed in 2005:
Average Adjusted Gross Income (AGI) in 2004: $28,588 (Individual Income Tax Returns)
Here:
$28,588
State:
$48,049
Salary/wage: $26,901 (reported on 83.4% of returns)
Here:
$26,901
State:
$42,646
(% of AGI for various income ranges: 76.5% for AGIs below $10k, 79.2% for AGIs $10k-25k, 83.0% for AGIs $25k-50k, 79.1% for AGIs $50k-75k, 83.5% for AGIs $75k-100k, 54.2% for AGIs over 100k)
Taxable interest for individuals: $1,144 (reported on 39.0% of returns)
This zip code:
$1,144
Pennsylvania:
$1,657
(% of AGI for various income ranges: 10.0% for AGIs below $10k, 2.5% for AGIs $10k-25k, 0.7% for AGIs $25k-50k, 1.2% for AGIs $50k-75k, 0.1% for AGIs $75k-100k, 1.5% for AGIs over 100k)
Taxable dividends: $1,078 (reported on 12.9% of returns)
Here:
$1,078
State:
$3,566
(% of AGI for various income ranges: 4.3% for AGIs below $10k, 0.4% for AGIs $10k-25k, 0.4% for AGIs $25k-50k, 0.3% for AGIs $50k-75k, 0.8% for AGIs $75k-100k)
Net capital gain/loss: +$7,539 (reported on 9.5% of returns)
Here:
+$7,539
State:
+$9,716
(% of AGI for various income ranges: 0.0% for AGIs below $10k, 0.2% for AGIs $10k-25k, 1.0% for AGIs $25k-50k, 1.6% for AGIs $50k-75k, 20.2% for AGIs $75k-100k)
Profit/loss from business: +$7,788 (reported on 10.6% of returns)
Here:
+$7,788
State:
+$14,267
(% of AGI for various income ranges: 2.3% for AGIs below $10k, 4.3% for AGIs $10k-25k, 3.2% for AGIs $25k-50k, 3.4% for AGIs $50k-75k)
IRA payment deduction: $1,750 (reported on 1.5% of returns)
17058:
$1,750
Pennsylvania:
$2,903
Total itemized deductions: $14,614 (27% of AGI, reported on 12.6% of returns)
Here:
$14,614
State:
$18,804
Here:
26.5% of AGI
State:
19.5% of AGI
(% of AGI for various income ranges: 3.8% for AGIs $10k-25k, 6.8% for AGIs $25k-50k, 7.6% for AGIs $50k-75k, 18.0% for AGIs $75k-100k)
Charity contributions deductions: $2,132 (4% of AGI, reported on 8.5% of returns)
Here:
$2,132
State:
$3,337
Here:
3.8% of AGI
State:
3.3% of AGI
(% of AGI for various income ranges: 0.7% for AGIs $10k-25k, 0.4% for AGIs $25k-50k, 0.9% for AGIs $50k-75k, 1.6% for AGIs $75k-100k)
Total tax: $3,107 (reported on 66.5% of returns)
17058:
$3,107
State:
$8,008
(% of AGI for various income ranges: 1.5% for AGIs below $10k, 3.7% for AGIs $10k-25k, 6.5% for AGIs $25k-50k, 8.4% for AGIs $50k-75k, 10.1% for AGIs $75k-100k, 14.8% for AGIs over 100k)
Earned income credit: $1,750 (reported on 23.5% of returns)
Here:
$1,750
State:
$1,643
Percentage of individuals using paid preparers for their 2004 taxes: 65.3%
Here:
65%
State:
56%
(% for various income ranges: 62.0% for AGIs below $10k, 65.2% for AGIs $10k-25k, 65.3% for AGIs $25k-50k, 67.7% for AGIs $50k-75k, 73.9% for AGIs $75k-100k, 80.0% for AGIs over 100k)
Household received Food Stamps/SNAP in the past 12 months: 110 Household did not receive Food Stamps/SNAP in the past 12 months: 475
Women who had a birth in the past 12 months: 9 (5 now married, 3 unmarried) Women who did not have a birth in the past 12 months: 375 (151 now married, 223 unmarried)
Housing units in zip code 17058 with a mortgage: 167 (7 second mortgage, 6 both second mortgage and home equity loan) Houses without a mortgage: 3
Median monthly owner costs for units with a mortgage: $1,191 Median monthly owner costs for units without a mortgage: $449
Residents with income below the poverty level in 2022:
This zip code:
12.0%
Whole state:
11.8%
Residents with income below 50% of the poverty level in 2022:
This zip code:
6.8%
Whole state:
6.1%
Median number of rooms in houses and condos:
Here:
6.1
State:
6.8
Median number of rooms in apartments:
Here:
4.2
State:
4.3
Notable locations in this zip code not listed on our city pages
In group quarters: 114 (-1 institutionalized population)
Size of family households: 161 2-persons, 121 3-persons, 26 4-persons, 21 5-persons, 6 6-persons, 31 7-or-more-persons
Size of nonfamily households: 193 1-person, 21 2-persons
270 married couples with children.
65 single-parent households (33 men, 32 women).
87.9% of residents of 17058 zip code speak English at home.
6.6% of residents speak Spanish at home (20% very well, 38% well, 27% not well, 15% not at all).
5.5% of residents speak other Indo-European language at home (100% very well).
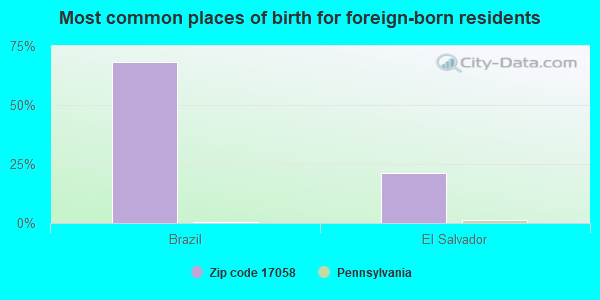
Foreign born population: 19 (1.2%) (0.0% of them are naturalized citizens)
:
1.2%
Whole state:
7.5%
68%Brazil
21%El Salvador
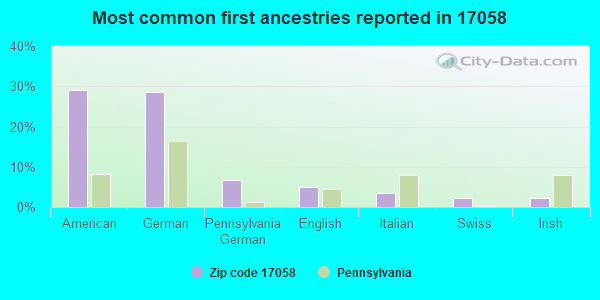
29%American
29%German
7%Pennsylvania German
5%English
3%Italian
2%Swiss
2%Irish
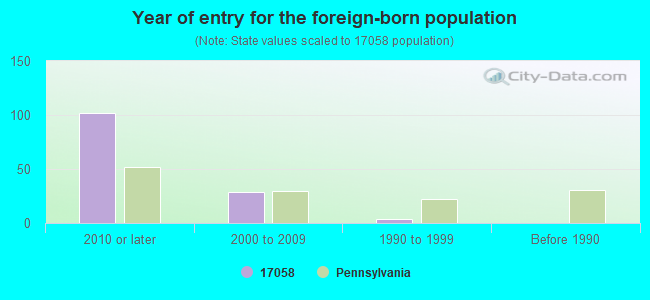
Year of entry for the foreign-born population
1022010 or later
292000 to 2009
41990 to 1999
0Before 1990
Facilities with environmental interests located in this zip code:
AGWAY INC (N. JUNIATA ST. in MIFFLIN, PA)
AIR MINOR (AIRS/AFS)
Housing units lacking complete plumbing facilities: 3.9% Housing units lacking complete kitchen facilities: 5.6%
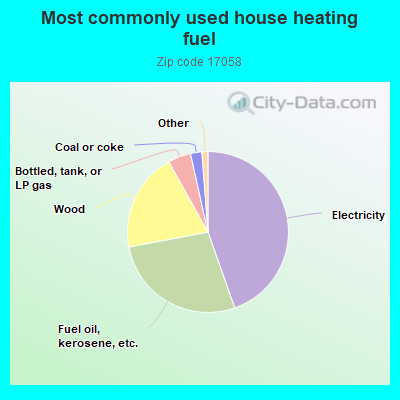
44.8%Electricity
27.5%Fuel oil, kerosene, etc.
20.0%Wood
4.6%Bottled, tank, or LP gas
2.3%Coal or coke
0.5%Utility gas
0.5%No fuel used
Population in 1990: 1,189. Population change in the 1990s: +684 (+57.5%).
Place of birth for U.S.-born residents:
This state: 1,330
Northeast: 27
Midwest: 51
South: 34
West: 20
63% of the 17058 zip code residents lived in the same house 5 years ago. Out of people who lived in different houses, 55% lived in this county. Out of people who lived in different counties, 50% lived in Pennsylvania.
89% of the 17058 zip code residents lived in the same house 1 year ago. Out of people who lived in different houses, 45% moved from this county. Out of people who lived in different houses, 35% moved from different county within same state. Out of people who lived in different houses, 13% moved from different state. Out of people who lived in different houses, 4% moved from abroad.
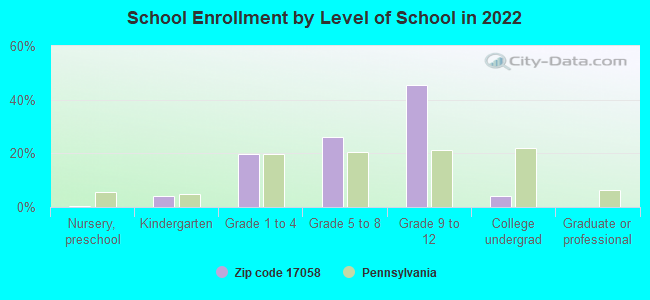
Private vs. public school enrollment:
Students in private schools in grades 1 to 8 (elementary and middle school): 45
Here:
34.8%
Pennsylvania:
15.7%
Students in private schools in grades 9 to 12 (high school): 39
Here:
31.0%
Pennsylvania:
13.4%
Students in private undergraduate colleges: 6
Here:
46.8%
Pennsylvania:
39.8%
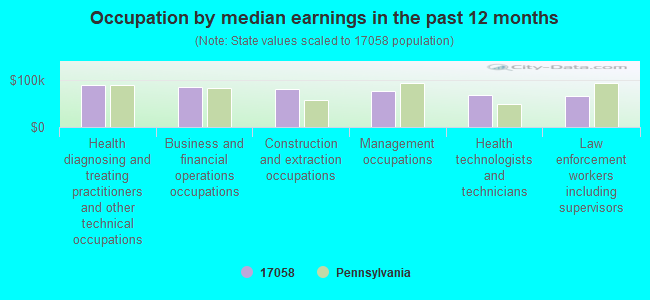
Occupation by median earnings in the past 12 months ($)
90,215Health diagnosing and treating practitioners and other technical occupations
85,539Business and financial operations occupations
80,007Construction and extraction occupations
77,288Management occupations
68,404Health technologists and technicians
66,615Law enforcement workers including supervisors
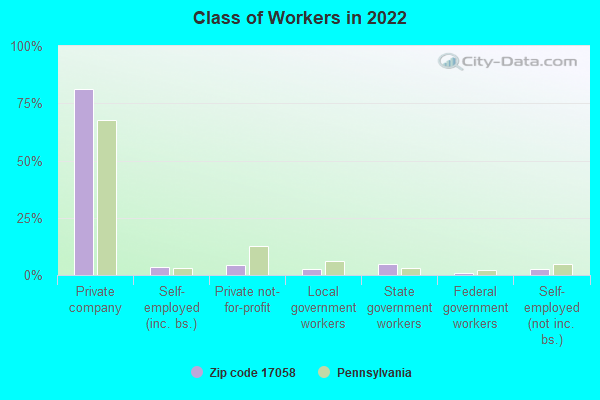
Top industries in this zip code by the number of employees in 2005:
Health Care and Social Assistance: Nursing Care Facilities (50-99 employees: 1 establishment)
Construction: New Single-Family Housing Construction (except Operative Builders) (10-19: 1, 1-4: 2)
Accommodation and Food Services: Limited-Service Restaurants (10-19: 1)
Accommodation and Food Services: Food Service Contractors (10-19: 1)
Health Care and Social Assistance: All Other Outpatient Care Centers (10-19: 1)
Finance and Insurance: Commercial Banking (5-9: 1)
People in group quarters in 2010:
100 people in nursing facilities/skilled-nursing facilities
10 people in group homes intended for adults
People in group quarters in 2000:
74 people in nursing homes
5 people in homes for the mentally retarded
2007 - 2018 National Fire Incident Reporting System (NFIRS) incidents
Based on the data from the years 2007 - 2018 the average number of fire incidents per year is 16. The highest number of fires - 73 took place in 2018, and the least - 1 in 2009. The data has a growing trend.
When looking into fire subcategories, the most reports belonged to: Other (58.7%), and Structure Fires (30.1%).
Fire incident types reported to NFIRS in Zip Code 17058
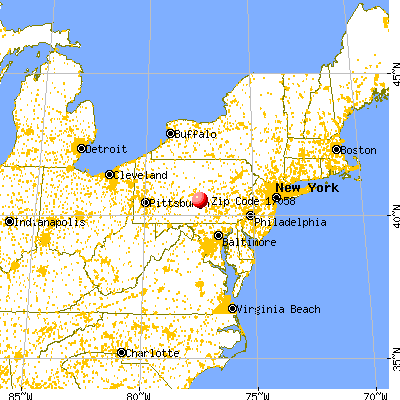


 Nearest zip codes: 17044, 17029, 17035, 17082, 17099, 17009.


 Based on the data from the years 2007 - 2018 the average number of fire incidents per year is 16. The highest number of fires - 73 took place in 2018, and the least - 1 in 2009. The data has a growing trend.
 When looking into fire subcategories, the most reports belonged to: Other (58.7%), and Structure Fires (30.1%).