Estimated zip code population in 2022: 1,732 Zip code population in 2010: 1,834 Zip code population in 2000: 1,647
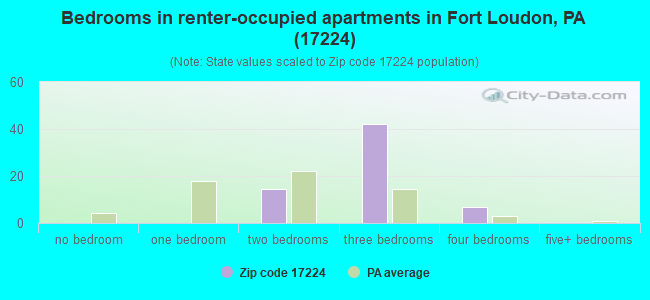
Houses and condos: 1,117 Renter-occupied apartments: 65
% of renters here:
7%
State:
31%
March 2022 cost of living index in zip code 17224: 92.5 (less than average, U.S. average is 100)
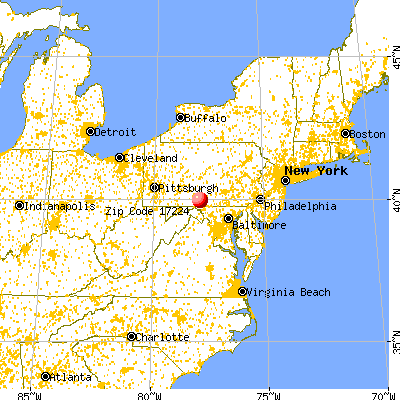
Land area: 36.6 sq. mi. Water area: 0.0 sq. mi.
Population density: 47 people per square mile
(very low).
OSM Map
General Map
Google Map
MSN Map
OSM Map
General Map
Google Map
MSN Map
OSM Map
General Map
Google Map
MSN Map
OSM Map
General Map
Google Map
MSN Map
Please wait while loading the map...
Real estate property taxes paid for housing units in 2022:
This zip code:
1.4% ($3,915)
Pennsylvania:
1.3% ($3,094)
Median real estate property taxes paid for housing units with mortgages in 2022: $4,085 (1.4%) Median real estate property taxes paid for housing units with no mortgage in 2022: $897 (0.5%)
Business Search- 14 Million verified businesses
Males: 937
(54.1%)
Females: 795
(45.9%)
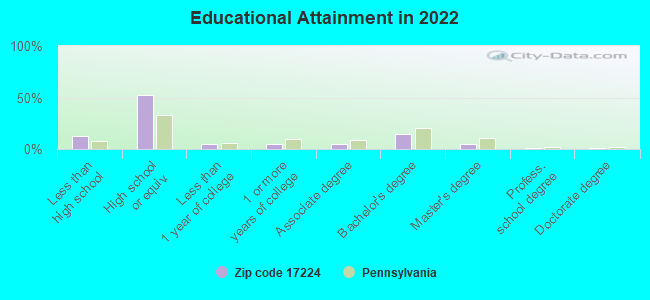
For population 25 years and over in 17224:
High school or higher: 85.9%
Bachelor's degree or higher: 21.1%
Graduate or professional degree: 6.8%
Unemployed: 1.4%
Mean travel time to work (commute): 33.2 minutes
For population 15 years and over in 17224:
Never married: 17.0%
Now married: 71.1%
Separated: 0.1%
Widowed: 3.9%
Divorced: 7.9%
Zip code 17224 compared to state average:
Median household income above state average.
Unemployed percentage significantly below state average.
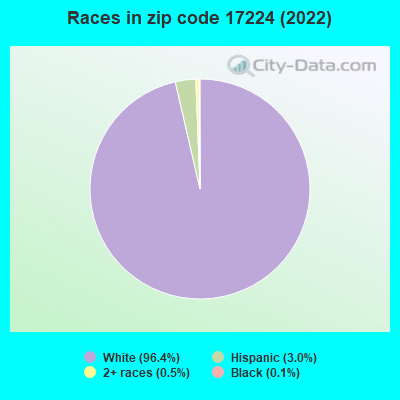
Black race population percentage significantly below state average.
Hispanic race population percentage below state average.
Foreign-born population percentage significantly below state average.
Renting percentage significantly below state average.
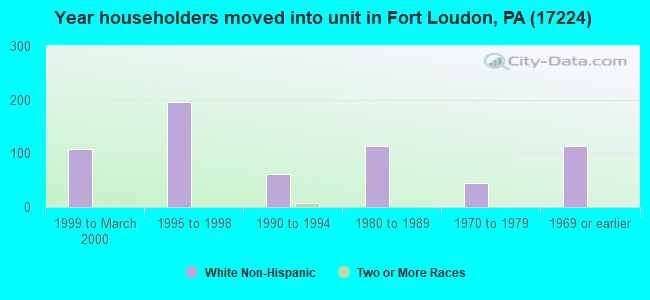
Length of stay since moving in significantly below state average.
House age below state average.
Percentage of population with a bachelor's degree or higher below state average.
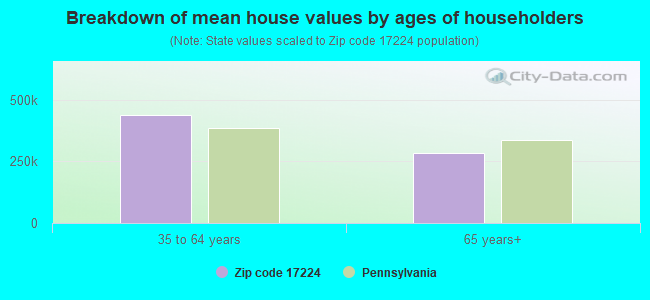
Estimated median house/condo value in 2022: $277,300
17224:
$277,300
Pennsylvania:
$245,500
According to our research of Pennsylvania and other state lists, there were 3 registered sex offenders living in 17224 zip code as of May 20, 2024. The ratio of all residents to sex offenders in zip code 17224 is 678 to 1. The ratio of registered sex offenders to all residents in this zip code is near the state average.
Median resident age:
This zip code:
37.8 years
Pennsylvania median age:
40.9 years
Average household size:
This zip code:
2.0 people
Pennsylvania:
2.4 people
Averages for the 2020 tax year for zip code 17224, filed in 2021:
Average Adjusted Gross Income (AGI) in 2020: $56,201 (Individual Income Tax Returns)
Here:
$56,201
State:
$75,707
Salary/wage: $47,566 (reported on 82.4% of returns)
Here:
$47,566
State:
$62,806
(% of AGI for various income ranges: 1056.5% for AGIs below $25k, 3491.1% for AGIs $25k-50k, 6613.0% for AGIs $50k-75k, 9161.7% for AGIs $75k-100k, 21261.7% for AGIs $100k-200k)
Taxable interest for individuals: $777 (reported on 30.6% of returns)
This zip code:
$777
Pennsylvania:
$1,633
(% of AGI for various income ranges: 15.3% for AGIs below $25k, 15.3% for AGIs $25k-50k, 34.0% for AGIs $50k-75k, 18.3% for AGIs $75k-100k, 170.0% for AGIs $100k-200k)
Ordinary dividends: $1,923 (reported on 15.3% of returns)
Here:
$1,923
State:
$7,382
(% of AGI for various income ranges: 16.5% for AGIs below $25k, 38.4% for AGIs $25k-50k, 66.0% for AGIs $50k-75k, 138.3% for AGIs $100k-200k)
Net capital gain/loss in AGI: +$5,136 (reported on 12.9% of returns)
Here:
+$5,136
State:
+$23,522
(% of AGI for various income ranges: 41.8% for AGIs below $25k, 4.0% for AGIs $50k-75k, 816.7% for AGIs $100k-200k)
Profit/loss from business: +$7,290 (reported on 11.8% of returns)
Here:
+$7,290
State:
+$16,274
(% of AGI for various income ranges: 71.8% for AGIs below $25k, 184.7% for AGIs $25k-50k, 256.0% for AGIs $50k-75k)
Taxable individual retirement arrangement distribution: $14,443 (reported on 8.2% of returns)
17224:
$14,443
Pennsylvania:
$18,583
(% of AGI for various income ranges: 90.6% for AGIs below $25k, 136.8% for AGIs $25k-50k, 995.0% for AGIs $75k-100k)
Total itemized deductions: $26,600 (reported on 3.5% of returns)
Here:
$26,600
State:
$34,850
(% of AGI for various income ranges: 1330.0% for AGIs $75k-100k)
Taxes paid: $7,400 (reported on 3.5% of returns)
17224:
$7,400
State:
$8,200
(% of AGI for various income ranges: 370.0% for AGIs $75k-100k)
Earned income credit: $1,718 (reported on 12.9% of returns)
Here:
$1,718
State:
$2,100
(% of AGI for various income ranges: 62.9% for AGIs below $25k, 43.2% for AGIs $25k-50k)
Percentage of individuals using paid preparers for their 2020 taxes: 92.9%
Here:
93%
State:
92%
(% for various income ranges: 92.3% for AGIs below $25k, 92.0% for AGIs $25k-50k, 93.3% for AGIs $50k-75k, 100.0% for AGIs $75k-100k, 90.9% for AGIs $100k-200k)
Averages for the 2012 tax year for zip code 17224, filed in 2013:
Average Adjusted Gross Income (AGI) in 2012: $43,520 (Individual Income Tax Returns)
Here:
$43,520
State:
$61,346
Salary/wage: $39,216 (reported on 83.9% of returns)
Here:
$39,216
State:
$51,902
(% of AGI for various income ranges: 70.6% for AGIs below $25k, 77.1% for AGIs $25k-50k, 84.7% for AGIs $50k-75k, 70.5% for AGIs $75k-100k, 72.6% for AGIs $100k-200k)
Taxable interest for individuals: $807 (reported on 31.0% of returns)
This zip code:
$807
Pennsylvania:
$1,588
(% of AGI for various income ranges: 1.5% for AGIs below $25k, 0.6% for AGIs $25k-50k, 0.3% for AGIs $50k-75k, 0.3% for AGIs $75k-100k, 0.7% for AGIs $100k-200k)
Ordinary dividends: $883 (reported on 13.8% of returns)
Here:
$883
State:
$5,827
(% of AGI for various income ranges: 0.4% for AGIs below $25k, 0.3% for AGIs $25k-50k, 0.3% for AGIs $50k-75k, 0.4% for AGIs $100k-200k)
Net capital gain/loss in AGI: +$1,571 (reported on 8.0% of returns)
Here:
+$1,571
State:
+$14,495
(% of AGI for various income ranges: 0.3% for AGIs $25k-50k, 1.4% for AGIs $75k-100k)
Profit/loss from business: +$9,691 (reported on 12.6% of returns)
Here:
+$9,691
State:
+$16,268
(% of AGI for various income ranges: 4.0% for AGIs below $25k, 5.0% for AGIs $25k-50k, 6.2% for AGIs $75k-100k)
Taxable individual retirement arrangement distribution: $9,400 (reported on 9.2% of returns)
17224:
$9,400
Pennsylvania:
$14,550
(% of AGI for various income ranges: 2.5% for AGIs below $25k, 3.3% for AGIs $25k-50k, 4.9% for AGIs $75k-100k)
Total itemized deductions: $17,518 (21% of AGI, reported on 19.5% of returns)
Here:
$17,518
State:
$23,538
Here:
20.8% of AGI
State:
18.4% of AGI
(% of AGI for various income ranges: 6.7% for AGIs $25k-50k, 7.8% for AGIs $50k-75k, 8.6% for AGIs $75k-100k, 12.0% for AGIs $100k-200k)
Charity contributions: $3,508 (reported on 13.8% of returns)
Here:
$3,508
State:
$4,025
(% of AGI for various income ranges: 1.2% for AGIs below $25k, 0.8% for AGIs $50k-75k, 1.8% for AGIs $75k-100k, 2.0% for AGIs $100k-200k)
Taxes paid: $6,129 (reported on 19.5% of returns)
17224:
$6,129
State:
$9,982
(% of AGI for various income ranges: 1.9% for AGIs $25k-50k, 2.6% for AGIs $50k-75k, 2.9% for AGIs $75k-100k, 4.8% for AGIs $100k-200k)
Earned income credit: $1,729 (reported on 16.1% of returns)
Here:
$1,729
State:
$2,106
(% of AGI for various income ranges: 3.8% for AGIs below $25k, 0.9% for AGIs $25k-50k)
Percentage of individuals using paid preparers for their 2012 taxes: 59.8%
Here:
60%
State:
53%
(% for various income ranges: 50.0% for AGIs below $25k, 64.0% for AGIs $25k-50k, 61.5% for AGIs $50k-75k, 75.0% for AGIs $75k-100k, 71.4% for AGIs $100k-200k)
Averages for the 2004 tax year for zip code 17224, filed in 2005:
Average Adjusted Gross Income (AGI) in 2004: $40,784 (Individual Income Tax Returns)
Here:
$40,784
State:
$48,049
Salary/wage: $35,426 (reported on 83.5% of returns)
Here:
$35,426
State:
$42,646
(% of AGI for various income ranges: 68.7% for AGIs below $10k, 69.8% for AGIs $10k-25k, 84.6% for AGIs $25k-50k, 84.9% for AGIs $50k-75k, 82.6% for AGIs $75k-100k, 39.7% for AGIs over 100k)
Taxable interest for individuals: $877 (reported on 44.1% of returns)
This zip code:
$877
Pennsylvania:
$1,657
(% of AGI for various income ranges: 1.9% for AGIs below $10k, 1.9% for AGIs $10k-25k, 0.9% for AGIs $25k-50k, 0.8% for AGIs $50k-75k, 0.9% for AGIs $75k-100k, 0.7% for AGIs over 100k)
Taxable dividends: $1,063 (reported on 16.9% of returns)
Here:
$1,063
State:
$3,566
(% of AGI for various income ranges: 1.1% for AGIs below $10k, 0.3% for AGIs $10k-25k, 0.3% for AGIs $25k-50k, 0.4% for AGIs $50k-75k, 0.2% for AGIs $75k-100k, 0.8% for AGIs over 100k)
Net capital gain/loss: +$8,847 (reported on 11.6% of returns)
Here:
+$8,847
State:
+$9,716
(% of AGI for various income ranges: -0.2% for AGIs $10k-25k, 0.3% for AGIs $25k-50k, 0.4% for AGIs $50k-75k, -0.1% for AGIs $75k-100k, 10.7% for AGIs over 100k)
Profit/loss from business: +$8,171 (reported on 13.8% of returns)
Here:
+$8,171
State:
+$14,267
(% of AGI for various income ranges: 15.2% for AGIs below $10k, 2.8% for AGIs $10k-25k, 2.3% for AGIs $25k-50k, 5.7% for AGIs $50k-75k, 0.3% for AGIs $75k-100k)
Total itemized deductions: $13,777 (18% of AGI, reported on 20.7% of returns)
Here:
$13,777
State:
$18,804
Here:
17.6% of AGI
State:
19.5% of AGI
(% of AGI for various income ranges: 4.3% for AGIs $10k-25k, 5.1% for AGIs $25k-50k, 8.3% for AGIs $50k-75k, 11.9% for AGIs $75k-100k, 6.6% for AGIs over 100k)
Charity contributions deductions: $3,085 (4% of AGI, reported on 16.7% of returns)
Here:
$3,085
State:
$3,337
Here:
3.6% of AGI
State:
3.3% of AGI
(% of AGI for various income ranges: 0.8% for AGIs $10k-25k, 0.4% for AGIs $25k-50k, 1.4% for AGIs $50k-75k, 2.3% for AGIs $75k-100k, 1.8% for AGIs over 100k)
Total tax: $5,444 (reported on 79.7% of returns)
17224:
$5,444
State:
$8,008
(% of AGI for various income ranges: 4.2% for AGIs below $10k, 4.0% for AGIs $10k-25k, 7.1% for AGIs $25k-50k, 9.2% for AGIs $50k-75k, 10.5% for AGIs $75k-100k, 20.2% for AGIs over 100k)
Earned income credit: $1,600 (reported on 14.8% of returns)
Here:
$1,600
State:
$1,643
Percentage of individuals using paid preparers for their 2004 taxes: 65.8%
Here:
66%
State:
56%
(% for various income ranges: 56.3% for AGIs below $10k, 66.4% for AGIs $10k-25k, 64.8% for AGIs $25k-50k, 69.0% for AGIs $50k-75k, 82.4% for AGIs $75k-100k, 72.2% for AGIs over 100k)
Likely homosexual households (counted as self-reported same-sex unmarried-partner households)
Lesbian couples: 0.3% of all households
Gay men: 0.0% of all households
Household received Food Stamps/SNAP in the past 12 months: 60 Household did not receive Food Stamps/SNAP in the past 12 months: 817
Women who had a birth in the past 12 months: 10 (10 now married, 0 unmarried) Women who did not have a birth in the past 12 months: 355 (215 now married, 137 unmarried)
Housing units in zip code 17224 with a mortgage: 630 (37 second mortgage, 35 both second mortgage and home equity loan) Houses without a mortgage: 11
Median monthly owner costs for units with a mortgage: $1,983 Median monthly owner costs for units without a mortgage: $457
Residents with income below the poverty level in 2022:
This zip code:
3.7%
Whole state:
11.8%
Residents with income below 50% of the poverty level in 2022:
This zip code:
2.9%
Whole state:
6.1%
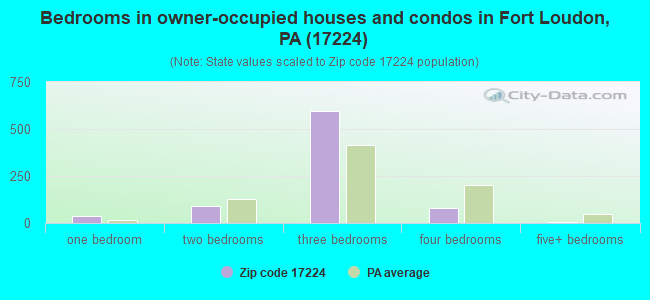
Median number of rooms in houses and condos:
Here:
5.3
State:
6.8
Median number of rooms in apartments:
Here:
5.1
State:
4.3
Notable locations in this zip code not listed on our city pages
Streams, rivers, and creeks: Broad Run (A), Township Run (B), McKeldey Run (C), Cold Spring Run (D), Bricker Run (E), Pump Run (F). Display/hide their locations on the map
Size of family households: 508 2-persons, 86 3-persons, 102 4-persons, 2 7-or-more-persons
Size of nonfamily households: 134 1-person, 50 2-persons
96 married couples with children.
24 single-parent households (8 men, 16 women).
98.1% of residents of 17224 zip code speak English at home.
0.2% of residents speak Spanish at home (100% well).
1.0% of residents speak other Indo-European language at home (100% well).
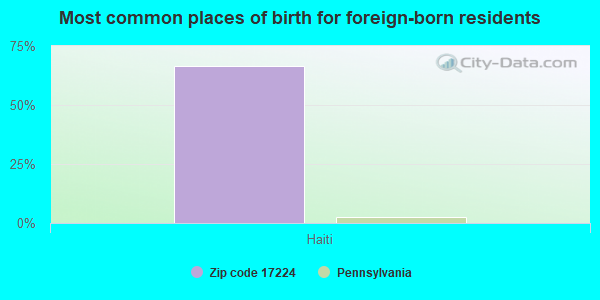
Foreign born population: 3 (0.2%) (100.0% of them are naturalized citizens)
This zip code:
0.2%
Whole state:
7.5%
67%Haiti
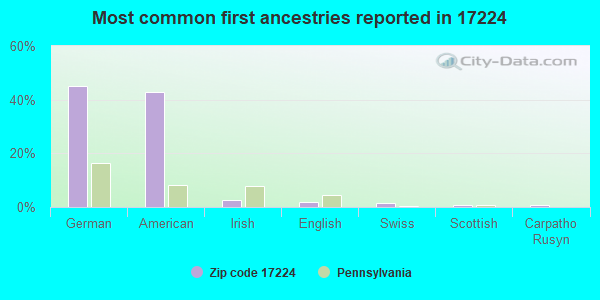
45%German
43%American
3%Irish
2%English
2%Swiss
1%Scottish
1%Carpatho Rusyn
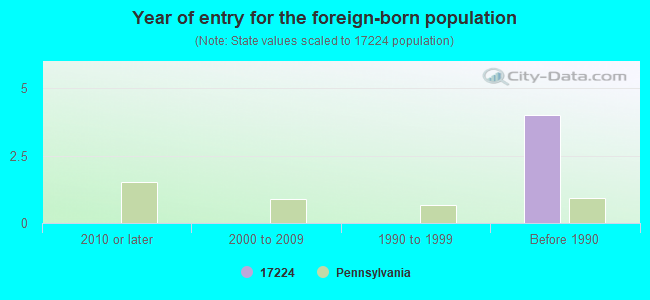
Year of entry for the foreign-born population
02010 or later
02000 to 2009
01990 to 1999
4Before 1990
Housing units lacking complete plumbing facilities: 2.0% Housing units lacking complete kitchen facilities: 6.5%
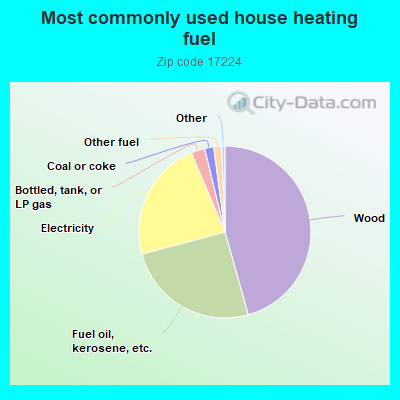
45.8%Wood
25.3%Fuel oil, kerosene, etc.
22.8%Electricity
2.6%Bottled, tank, or LP gas
1.7%Coal or coke
1.5%Other fuel
Population in 1990: 1,412. Population change in the 1990s: +235 (+16.6%).
Place of birth for U.S.-born residents:
This state: 1,454
Northeast: 12
Midwest: 28
South: 218
West: 3
59% of the 17224 zip code residents lived in the same house 5 years ago. Out of people who lived in different houses, 75% lived in this county. Out of people who lived in different counties, 50% lived in Pennsylvania.
86% of the 17224 zip code residents lived in the same house 1 year ago. Out of people who lived in different houses, 80% moved from this county. Out of people who lived in different houses, 16% moved from different county within same state.
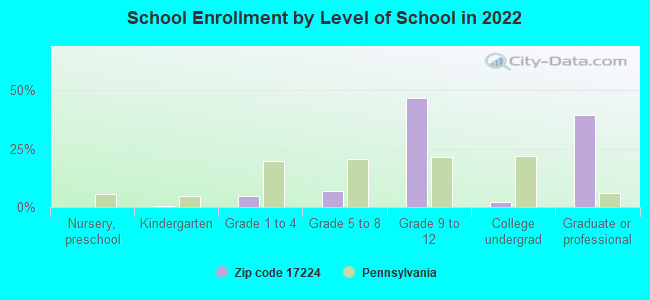
Private vs. public school enrollment:
Students in private schools in grades 1 to 8 (elementary and middle school):
Here:
0.0%
Pennsylvania:
15.7%
Students in private schools in grades 9 to 12 (high school): 40
Here:
26.6%
Pennsylvania:
13.4%
Students in private undergraduate colleges: 4
Here:
62.0%
Pennsylvania:
39.8%
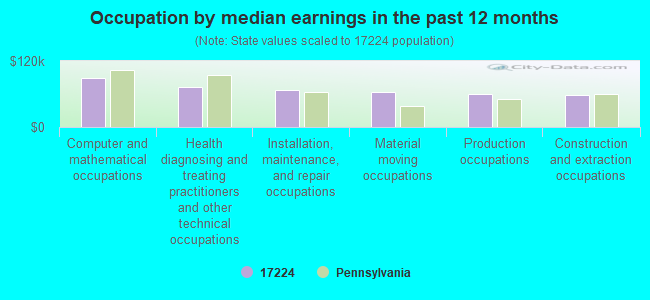
Occupation by median earnings in the past 12 months ($)
88,927Computer and mathematical occupations
73,515Health diagnosing and treating practitioners and other technical occupations
67,183Installation, maintenance, and repair occupations
63,696Material moving occupations
59,107Production occupations
58,740Construction and extraction occupations
Top industries in this zip code by the number of employees in 2005:
Accommodation and Food Services: Limited-Service Restaurants (50-99 employees: 1 establishment)
Wholesale Trade: Construction and Mining (except Oil Well) Machinery and Equipment Merchant Wholesalers (20-49: 1)
Other Services (except Public Administration): Civic and Social Organizations (10-19: 1)
Finance and Insurance: Commercial Banking (5-9: 1, 1-4: 1)
Fatal accident statistics in 2010:
Fatal accident count: 2
Vehicles involved in fatal accidents: 4
Fatal accidents caused by drunken drivers: 0
Fatalities: 2
Persons involved in fatal accidents: 6
Pedestrians involved in fatal accidents: 0
2005 - 2018 National Fire Incident Reporting System (NFIRS) incidents
Based on the data from the years 2005 - 2018 the average number of fire incidents per year is 14. The highest number of reported fire incidents - 33 took place in 2016, and the least - 4 in 2008. The data has an increasing trend.
When looking into fire subcategories, the most reports belonged to: Structure Fires (56.1%), and Outside Fires (30.6%).
Fire incident types reported to NFIRS in Zip Code 17224


 Nearest zip codes: 17233, 17252, 17215, 17223, 17221, 17265.
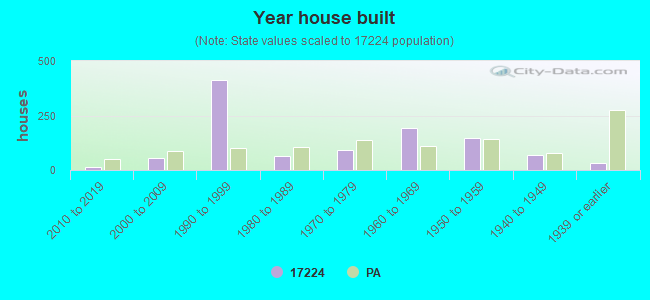


 Based on the data from the years 2005 - 2018 the average number of fire incidents per year is 14. The highest number of reported fire incidents - 33 took place in 2016, and the least - 4 in 2008. The data has an increasing trend.
 When looking into fire subcategories, the most reports belonged to: Structure Fires (56.1%), and Outside Fires (30.6%).