Estimated zip code population in 2022: 5,156 Zip code population in 2010: 5,047 Zip code population in 2000: 4,678
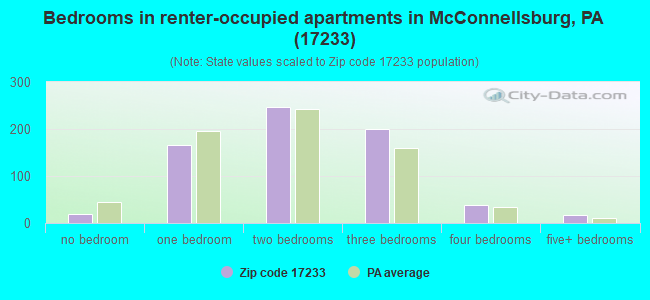
Houses and condos: 2,672 Renter-occupied apartments: 693
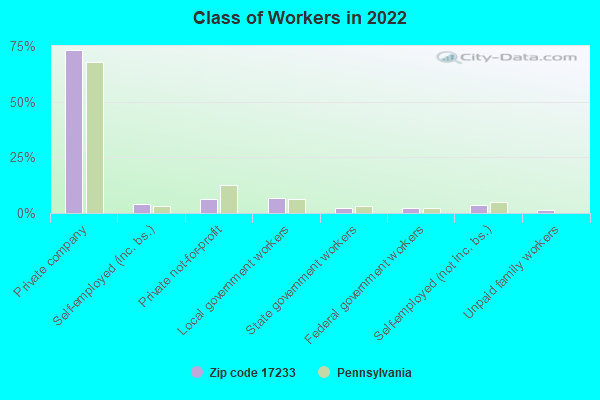
% of renters here:
30%
State:
31%
March 2022 cost of living index in zip code 17233: 91.7 (less than average, U.S. average is 100)
Land area: 79.8 sq. mi. Water area: 0.4 sq. mi.
Population density: 65 people per square mile
(very low).
OSM Map
General Map
Google Map
MSN Map
OSM Map
General Map
Google Map
MSN Map
OSM Map
General Map
Google Map
MSN Map
OSM Map
General Map
Google Map
MSN Map
Please wait while loading the map...
Real estate property taxes paid for housing units in 2022:
This zip code:
1.1% ($1,992)
Pennsylvania:
1.3% ($3,094)
Median real estate property taxes paid for housing units with mortgages in 2022: $2,080 (1.0%) Median real estate property taxes paid for housing units with no mortgage in 2022: $1,915 (1.2%)
Business Search- 14 Million verified businesses
Males: 2,610
(50.6%)
Females: 2,545
(49.4%)
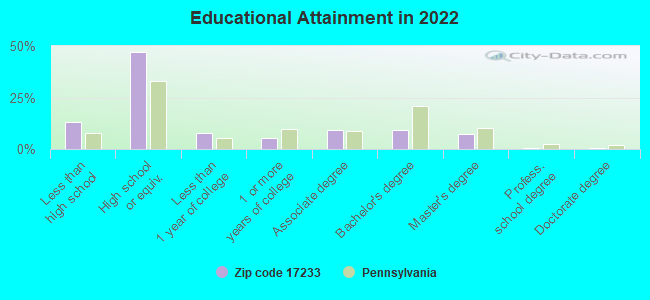
For population 25 years and over in 17233:
High school or higher: 85.9%
Bachelor's degree or higher: 17.4%
Graduate or professional degree: 8.5%
Unemployed: 4.0%
Mean travel time to work (commute): 25.4 minutes
For population 15 years and over in 17233:
Never married: 28.5%
Now married: 50.9%
Separated: 2.1%
Widowed: 7.3%
Divorced: 11.3%
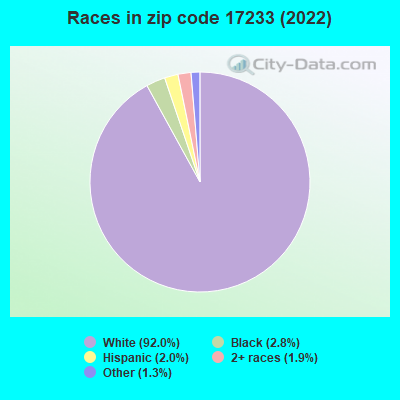
Zip code 17233 compared to state average:
Black race population percentage significantly below state average.
Hispanic race population percentage significantly below state average.
Median age above state average.
Foreign-born population percentage significantly below state average.
Length of stay since moving in significantly above state average.
Number of college students below state average.
Percentage of population with a bachelor's degree or higher below state average.
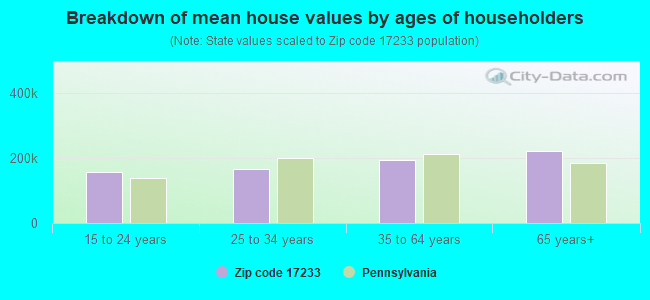
Estimated median house/condo value in 2022: $183,637
17233:
$183,637
Pennsylvania:
$245,500
According to our research of Pennsylvania and other state lists, there were 8 registered sex offenders living in 17233 zip code as of May 20, 2024. The ratio of all residents to sex offenders in zip code 17233 is 655 to 1. The ratio of registered sex offenders to all residents in this zip code is near the state average.
Median resident age:
This zip code:
47.5 years
Pennsylvania median age:
40.9 years
Average household size:
This zip code:
2.2 people
Pennsylvania:
2.4 people
Averages for the 2020 tax year for zip code 17233, filed in 2021:
Average Adjusted Gross Income (AGI) in 2020: $53,370 (Individual Income Tax Returns)
Here:
$53,370
State:
$75,707
Salary/wage: $44,436 (reported on 77.3% of returns)
Here:
$44,436
State:
$62,806
(% of AGI for various income ranges: 1014.5% for AGIs below $25k, 3318.5% for AGIs $25k-50k, 6147.9% for AGIs $50k-75k, 8621.2% for AGIs $75k-100k, 13553.2% for AGIs $100k-200k)
Taxable interest for individuals: $1,200 (reported on 30.2% of returns)
This zip code:
$1,200
Pennsylvania:
$1,633
(% of AGI for various income ranges: 21.1% for AGIs below $25k, 33.3% for AGIs $25k-50k, 44.6% for AGIs $50k-75k, 59.4% for AGIs $75k-100k, 174.7% for AGIs $100k-200k)
Ordinary dividends: $4,724 (reported on 17.6% of returns)
Here:
$4,724
State:
$7,382
(% of AGI for various income ranges: 27.0% for AGIs below $25k, 33.1% for AGIs $25k-50k, 101.1% for AGIs $50k-75k, 141.2% for AGIs $75k-100k, 522.6% for AGIs $100k-200k)
Net capital gain/loss in AGI: +$8,771 (reported on 14.9% of returns)
Here:
+$8,771
State:
+$23,522
(% of AGI for various income ranges: 16.2% for AGIs below $25k, 47.5% for AGIs $25k-50k, 110.7% for AGIs $50k-75k, 199.4% for AGIs $75k-100k, 665.8% for AGIs $100k-200k)
Profit/loss from business: +$13,993 (reported on 11.8% of returns)
Here:
+$13,993
State:
+$16,274
(% of AGI for various income ranges: 56.1% for AGIs below $25k, 124.4% for AGIs $25k-50k, 375.0% for AGIs $50k-75k, 191.2% for AGIs $75k-100k, 980.0% for AGIs $100k-200k)
Taxable individual retirement arrangement distribution: $15,303 (reported on 12.9% of returns)
17233:
$15,303
Pennsylvania:
$18,583
(% of AGI for various income ranges: 90.5% for AGIs below $25k, 162.5% for AGIs $25k-50k, 218.2% for AGIs $50k-75k, 504.7% for AGIs $75k-100k, 1173.2% for AGIs $100k-200k)
Total itemized deductions: $33,386 (reported on 2.7% of returns)
Here:
$33,386
State:
$34,850
(% of AGI for various income ranges: 306.4% for AGIs $50k-75k, 778.4% for AGIs $100k-200k)
Charity contributions: $13,317 (reported on 2.4% of returns)
Here:
$13,317
State:
$12,392
(% of AGI for various income ranges: 40.2% for AGIs $25k-50k, 310.5% for AGIs $100k-200k)
Taxes paid: $8,071 (reported on 2.7% of returns)
17233:
$8,071
State:
$8,200
(% of AGI for various income ranges: 70.4% for AGIs $50k-75k, 193.7% for AGIs $100k-200k)
Earned income credit: $2,235 (reported on 13.3% of returns)
Here:
$2,235
State:
$2,100
(% of AGI for various income ranges: 87.9% for AGIs below $25k, 51.5% for AGIs $25k-50k)
Percentage of individuals using paid preparers for their 2020 taxes: 90.6%
Here:
91%
State:
92%
(% for various income ranges: 89.3% for AGIs below $25k, 89.9% for AGIs $25k-50k, 92.7% for AGIs $50k-75k, 92.3% for AGIs $75k-100k, 93.3% for AGIs $100k-200k, 80.0% for AGIs over 200k)
Averages for the 2012 tax year for zip code 17233, filed in 2013:
Average Adjusted Gross Income (AGI) in 2012: $44,363 (Individual Income Tax Returns)
Here:
$44,363
State:
$61,346
Salary/wage: $39,308 (reported on 80.4% of returns)
Here:
$39,308
State:
$51,902
(% of AGI for various income ranges: 65.6% for AGIs below $25k, 76.7% for AGIs $25k-50k, 73.1% for AGIs $50k-75k, 73.7% for AGIs $75k-100k, 84.1% for AGIs $100k-200k)
Taxable interest for individuals: $1,242 (reported on 36.3% of returns)
This zip code:
$1,242
Pennsylvania:
$1,588
(% of AGI for various income ranges: 2.0% for AGIs below $25k, 1.1% for AGIs $25k-50k, 1.1% for AGIs $50k-75k, 0.8% for AGIs $75k-100k, 0.8% for AGIs $100k-200k)
Ordinary dividends: $3,909 (reported on 18.4% of returns)
Here:
$3,909
State:
$5,827
(% of AGI for various income ranges: 1.5% for AGIs below $25k, 1.0% for AGIs $25k-50k, 1.4% for AGIs $50k-75k, 2.0% for AGIs $75k-100k, 2.9% for AGIs $100k-200k)
Net capital gain/loss in AGI: +$4,880 (reported on 14.3% of returns)
Here:
+$4,880
State:
+$14,495
(% of AGI for various income ranges: 0.9% for AGIs below $25k, 0.5% for AGIs $25k-50k, 1.3% for AGIs $50k-75k, 1.6% for AGIs $75k-100k, 4.0% for AGIs $100k-200k)
Profit/loss from business: +$14,800 (reported on 13.5% of returns)
Here:
+$14,800
State:
+$16,268
(% of AGI for various income ranges: 6.0% for AGIs below $25k, 4.0% for AGIs $25k-50k, 2.3% for AGIs $50k-75k, 0.6% for AGIs $75k-100k, 11.4% for AGIs $100k-200k)
Taxable individual retirement arrangement distribution: $11,124 (reported on 13.5% of returns)
17233:
$11,124
Pennsylvania:
$14,550
(% of AGI for various income ranges: 5.5% for AGIs below $25k, 2.9% for AGIs $25k-50k, 3.0% for AGIs $50k-75k, 3.1% for AGIs $75k-100k, 4.5% for AGIs $100k-200k)
Total itemized deductions: $17,318 (21% of AGI, reported on 20.0% of returns)
Here:
$17,318
State:
$23,538
Here:
20.8% of AGI
State:
18.4% of AGI
(% of AGI for various income ranges: 4.1% for AGIs below $25k, 5.8% for AGIs $25k-50k, 7.7% for AGIs $50k-75k, 7.6% for AGIs $75k-100k, 14.5% for AGIs $100k-200k)
Charity contributions: $4,143 (reported on 12.2% of returns)
Here:
$4,143
State:
$4,025
(% of AGI for various income ranges: 0.5% for AGIs $25k-50k, 1.0% for AGIs $50k-75k, 1.5% for AGIs $75k-100k, 2.6% for AGIs $100k-200k)
Taxes paid: $6,138 (reported on 19.6% of returns)
17233:
$6,138
State:
$9,982
(% of AGI for various income ranges: 0.9% for AGIs below $25k, 1.5% for AGIs $25k-50k, 2.4% for AGIs $50k-75k, 2.5% for AGIs $75k-100k, 6.3% for AGIs $100k-200k)
Earned income credit: $1,975 (reported on 16.3% of returns)
Here:
$1,975
State:
$2,106
(% of AGI for various income ranges: 5.1% for AGIs below $25k, 0.9% for AGIs $25k-50k)
Percentage of individuals using paid preparers for their 2012 taxes: 62.4%
Here:
62%
State:
53%
(% for various income ranges: 52.7% for AGIs below $25k, 63.8% for AGIs $25k-50k, 73.2% for AGIs $50k-75k, 72.7% for AGIs $75k-100k, 77.8% for AGIs $100k-200k)
Averages for the 2004 tax year for zip code 17233, filed in 2005:
Average Adjusted Gross Income (AGI) in 2004: $37,438 (Individual Income Tax Returns)
Here:
$37,438
State:
$48,049
Salary/wage: $34,665 (reported on 84.2% of returns)
Here:
$34,665
State:
$42,646
(% of AGI for various income ranges: 122.3% for AGIs below $10k, 75.7% for AGIs $10k-25k, 82.1% for AGIs $25k-50k, 81.4% for AGIs $50k-75k, 82.3% for AGIs $75k-100k, 62.5% for AGIs over 100k)
Taxable interest for individuals: $1,679 (reported on 44.0% of returns)
This zip code:
$1,679
Pennsylvania:
$1,657
(% of AGI for various income ranges: 8.1% for AGIs below $10k, 3.0% for AGIs $10k-25k, 1.8% for AGIs $25k-50k, 1.8% for AGIs $50k-75k, 0.3% for AGIs $75k-100k, 2.4% for AGIs over 100k)
Taxable dividends: $2,000 (reported on 23.6% of returns)
Here:
$2,000
State:
$3,566
(% of AGI for various income ranges: 5.4% for AGIs below $10k, 1.4% for AGIs $10k-25k, 1.2% for AGIs $25k-50k, 1.3% for AGIs $50k-75k, 0.7% for AGIs $75k-100k, 1.3% for AGIs over 100k)
Net capital gain/loss: +$7,674 (reported on 16.0% of returns)
Here:
+$7,674
State:
+$9,716
(% of AGI for various income ranges: -3.6% for AGIs below $10k, 0.3% for AGIs $10k-25k, 1.2% for AGIs $25k-50k, 2.0% for AGIs $50k-75k, 3.5% for AGIs $75k-100k, 10.0% for AGIs over 100k)
Profit/loss from business: +$10,470 (reported on 13.4% of returns)
Here:
+$10,470
State:
+$14,267
(% of AGI for various income ranges: -0.1% for AGIs below $10k, 3.8% for AGIs $10k-25k, 2.1% for AGIs $25k-50k, 2.6% for AGIs $50k-75k, 0.9% for AGIs $75k-100k, 9.9% for AGIs over 100k)
IRA payment deduction: $2,699 (reported on 3.3% of returns)
17233:
$2,699
Pennsylvania:
$2,903
Self-employed pension: $9,200 (reported on 0.4% of returns)
Here:
$9,200
Pennsylvania:
$14,674
Total itemized deductions: $14,232 (19% of AGI, reported on 19.7% of returns)
Here:
$14,232
State:
$18,804
Here:
19.4% of AGI
State:
19.5% of AGI
(% of AGI for various income ranges: 4.9% for AGIs $10k-25k, 6.0% for AGIs $25k-50k, 8.2% for AGIs $50k-75k, 11.1% for AGIs $75k-100k, 8.4% for AGIs over 100k)
Charity contributions deductions: $3,008 (4% of AGI, reported on 15.6% of returns)
Here:
$3,008
State:
$3,337
Here:
3.8% of AGI
State:
3.3% of AGI
(% of AGI for various income ranges: 0.6% for AGIs $10k-25k, 0.7% for AGIs $25k-50k, 1.1% for AGIs $50k-75k, 2.2% for AGIs $75k-100k, 2.1% for AGIs over 100k)
Total tax: $4,966 (reported on 76.4% of returns)
17233:
$4,966
State:
$8,008
(% of AGI for various income ranges: 3.3% for AGIs below $10k, 4.5% for AGIs $10k-25k, 7.3% for AGIs $25k-50k, 9.0% for AGIs $50k-75k, 10.4% for AGIs $75k-100k, 19.5% for AGIs over 100k)
Earned income credit: $1,499 (reported on 14.9% of returns)
Here:
$1,499
State:
$1,643
Percentage of individuals using paid preparers for their 2004 taxes: 68.2%
Here:
68%
State:
56%
(% for various income ranges: 63.6% for AGIs below $10k, 69.4% for AGIs $10k-25k, 69.0% for AGIs $25k-50k, 69.4% for AGIs $50k-75k, 66.2% for AGIs $75k-100k, 75.5% for AGIs over 100k)
Household received Food Stamps/SNAP in the past 12 months: 480 Household did not receive Food Stamps/SNAP in the past 12 months: 1,871
Women who had a birth in the past 12 months: 55 (6 now married, 41 unmarried) Women who did not have a birth in the past 12 months: 939 (454 now married, 482 unmarried)
Housing units in zip code 17233 with a mortgage: 734 (96 second mortgage, 7 home equity loan, 79 both second mortgage and home equity loan) Houses without a mortgage: 65
Median monthly owner costs for units with a mortgage: $1,304 Median monthly owner costs for units without a mortgage: $497
Residents with income below the poverty level in 2022:
This zip code:
12.6%
Whole state:
11.8%
Residents with income below 50% of the poverty level in 2022:
This zip code:
8.7%
Whole state:
6.1%
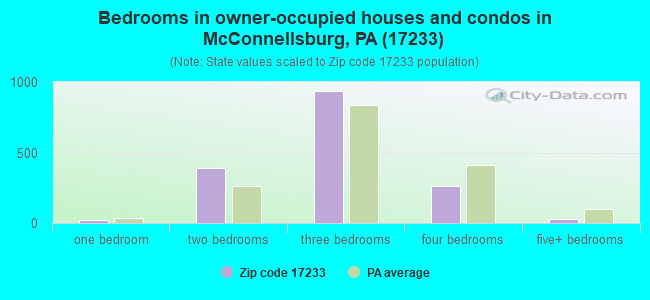
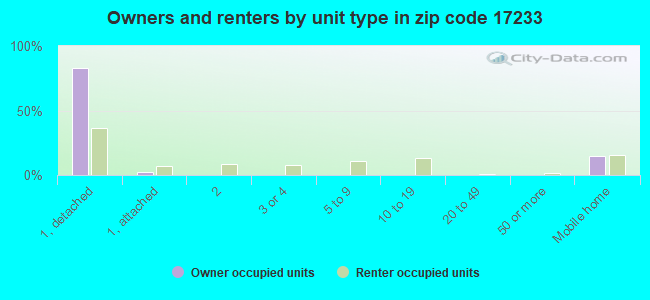
Median number of rooms in houses and condos:
Here:
6.2
State:
6.8
Median number of rooms in apartments:
Here:
4.8
State:
4.3
Notable locations in this zip code not listed on our city pages
Notable locations in zip code 17233: McConnellsburg Volunteer Fire Company (A), Pennsylvania Conservation and Natural Resources District 2 Buchanan Forest (B). Display/hide their locations on the map
Churches in zip code 17233 include: Union Church (A), Rock Hill Church (B), Cherry Lane Church (C), Siloam Church (D), The Supreme Council of the House of Jacob (E), Bethlehem Church (F). Display/hide their locations on the map
Streams, rivers, and creeks: Mellotts Run (A), Roaring Run (B), Kendall Run (C), Patterson Run (D), Back Run (E), Baby Run (F), Owl Creek (G). Display/hide their locations on the map
In group quarters: 18 (-1 institutionalized population)
Size of family households: 653 2-persons, 377 3-persons, 225 4-persons, 118 5-persons, 19 6-persons, 14 7-or-more-persons
Size of nonfamily households: 812 1-person, 118 2-persons
422 married couples with children.
323 single-parent households (36 men, 287 women).
97.9% of residents of 17233 zip code speak English at home.
0.3% of residents speak Spanish at home (100% very well).
1.4% of residents speak other Indo-European language at home (91% very well, 6% well, 3% not well).
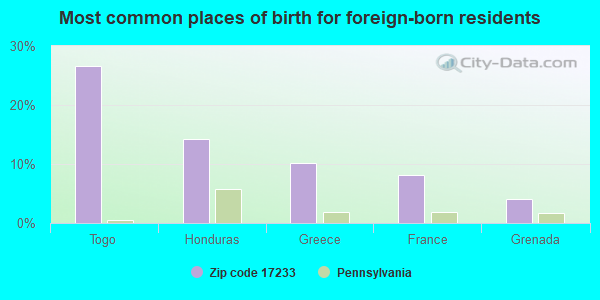
Foreign born population: 48 (0.9%) (10.8% of them are naturalized citizens)
This zip code:
0.9%
Whole state:
7.5%
27%Togo
14%Honduras
10%Greece
8%France
4%Grenada
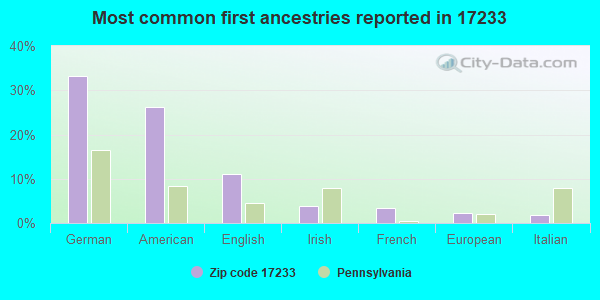
33%German
26%American
11%English
4%Irish
3%French
2%European
2%Italian
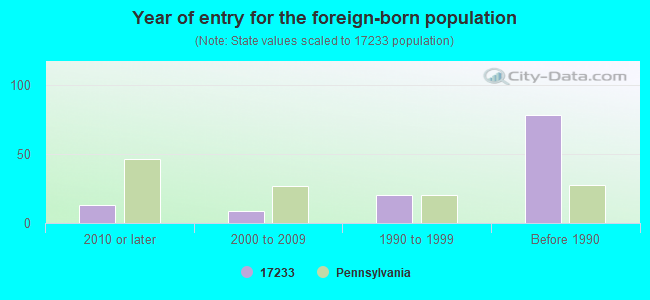
Year of entry for the foreign-born population
132010 or later
92000 to 2009
201990 to 1999
78Before 1990
Facilities with environmental interests located in this zip code:
ALLEGHENY POWER MCCONNELLSBURG SVC CTR (634 LINCOLN WAY W in MCCONNELLSBURG, PA)
STATE MASTER (Pennsylvania database) - RCRIS-PAR000508101, HAZARDOUS WASTE PROGRAM Conditionally Exempt Small Quantity Generators, less than 100 kg/month of hazardous waste (Resource Conservation and Recovery Act (tracking hazardous waste)) Business NAICS classification: ELECTRIC POWER DISTRIBUTION. Organizations: WEST PENN POWER CO DBA ALLEGHENY POWER (CONTACT/OPERATOR)
, WEST PENN POWER COMPANY (OWNER/OPERATOR)
AT & T LONG LINES EQUIP ENGR (TUSCARORA MT 5 M N RT 30 in MCCONNELLSBURG, PA)
Small Quantity Generators, between 100 kg and 1000 kg of hazardous waste/month (Resource Conservation and Recovery Act (tracking hazardous waste)) - notification Organizations: OPERNAME (CONTACT/OPERATOR)
BEDFORD VALLEY PETROLEUM CORP (522 NORTH in MCCONNELLSBURG, PA)
Small Quantity Generators, between 100 kg and 1000 kg of hazardous waste/month (Resource Conservation and Recovery Act (tracking hazardous waste)) - notification
Housing units lacking complete plumbing facilities: 1.9% Housing units lacking complete kitchen facilities: 1.9%
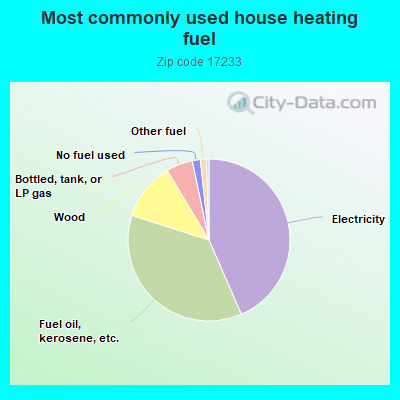
43.5%Electricity
36.5%Fuel oil, kerosene, etc.
11.5%Wood
5.3%Bottled, tank, or LP gas
1.6%No fuel used
1.2%Other fuel
Population in 1990: 2,529. Population change in the 1990s: +2,149 (+85.0%).
Place of birth for U.S.-born residents:
This state: 4,146
Northeast: 87
Midwest: 76
South: 667
West: 23
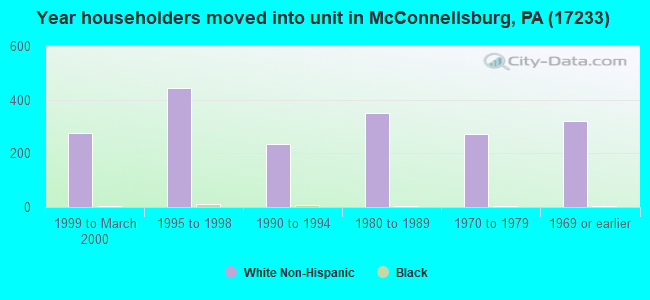
66% of the 17233 zip code residents lived in the same house 5 years ago. Out of people who lived in different houses, 66% lived in this county. Out of people who lived in different counties, 50% lived in Pennsylvania.
94% of the 17233 zip code residents lived in the same house 1 year ago. Out of people who lived in different houses, 63% moved from this county. Out of people who lived in different houses, 25% moved from different county within same state. Out of people who lived in different houses, 14% moved from different state.
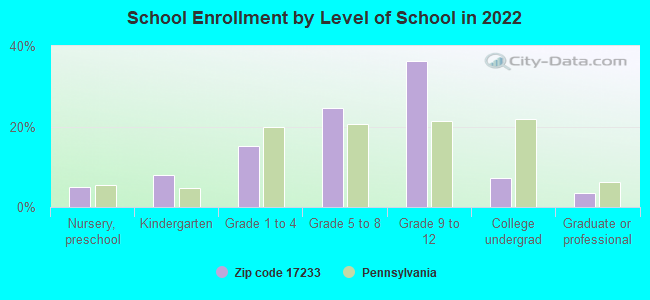
Private vs. public school enrollment:
Students in private schools in grades 1 to 8 (elementary and middle school): 17
Here:
5.2%
Pennsylvania:
15.7%
Students in private schools in grades 9 to 12 (high school): 14
Here:
4.5%
Pennsylvania:
13.4%
Students in private undergraduate colleges: 5
Here:
9.3%
Pennsylvania:
39.8%
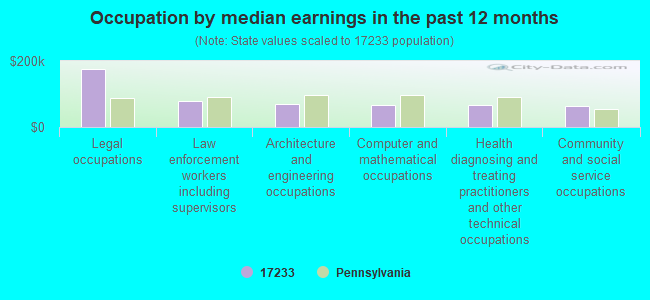
Occupation by median earnings in the past 12 months ($)
175,594Legal occupations
78,508Law enforcement workers including supervisors
69,995Architecture and engineering occupations
68,041Computer and mathematical occupations
65,551Health diagnosing and treating practitioners and other technical occupations
62,805Community and social service occupations
Companies with federal contracts located in this zip code:
SOUTHWEST MEDICAL SYSTEMS INC (503 LINCOLN WAY E in MC CONNELLSBUR, PA; small business)
$4,106 with Army for Outerwear, Men's. Signed on 2005-01-07. Completion date: 2005-01-12.
Top industries in this zip code by the number of employees in 2005:
Health Care and Social Assistance: General Medical and Surgical Hospitals (250-499 employees: 1 establishment)
2005 - 2018 National Fire Incident Reporting System (NFIRS) incidents
Based on the data from the years 2005 - 2018 the average number of fire incidents per year is 15. The highest number of reported fire incidents - 40 took place in 2009, and the least - 0 in 2008. The data has a decreasing trend.
When looking into fire subcategories, the most reports belonged to: Structure Fires (46.4%), and Outside Fires (21.1%).
Fire incident types reported to NFIRS in Zip Code 17233

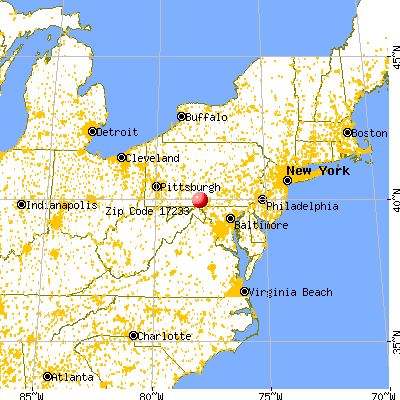


 Nearest zip codes: 17224, 17228, 17229, 17223, 17215, 17252.


 Based on the data from the years 2005 - 2018 the average number of fire incidents per year is 15. The highest number of reported fire incidents - 40 took place in 2009, and the least - 0 in 2008. The data has a decreasing trend.
 When looking into fire subcategories, the most reports belonged to: Structure Fires (46.4%), and Outside Fires (21.1%).