Estimated zip code population in 2022: 1,807 Zip code population in 2010: 1,794 Zip code population in 2000: 1,809
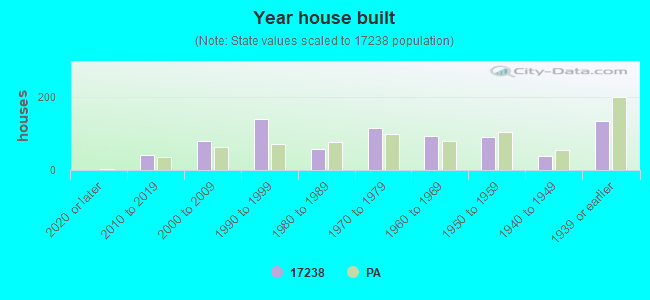
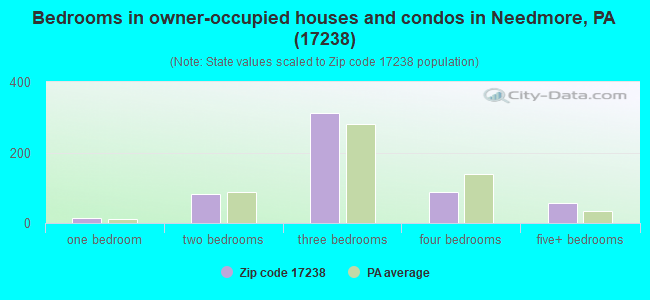
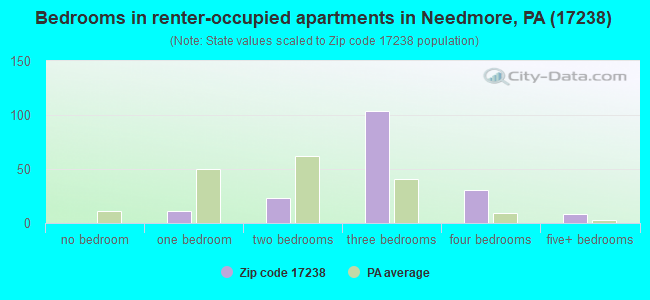
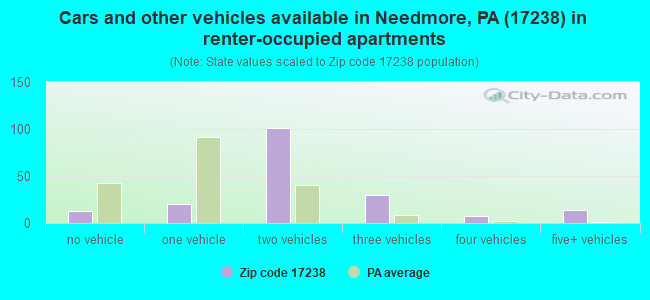
Houses and condos: 794 Renter-occupied apartments: 182
% of renters here:
25%
State:
31%
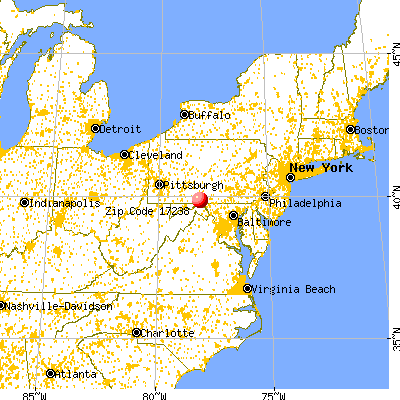
March 2022 cost of living index in zip code 17238: 92.3 (less than average, U.S. average is 100)
Land area: 54.6 sq. mi. Water area: 0.0 sq. mi.
Population density: 33 people per square mile
(very low).
OSM Map
General Map
Google Map
MSN Map
OSM Map
General Map
Google Map
MSN Map
OSM Map
General Map
Google Map
MSN Map
OSM Map
General Map
Google Map
MSN Map
Please wait while loading the map...
Real estate property taxes paid for housing units in 2022:
This zip code:
0.9% ($1,996)
Pennsylvania:
1.3% ($3,094)
Median real estate property taxes paid for housing units with mortgages in 2022: $2,202 (0.9%) Median real estate property taxes paid for housing units with no mortgage in 2022: $1,878 (0.9%)
Business Search- 14 Million verified businesses
Males: 928
(51.4%)
Females: 879
(48.6%)
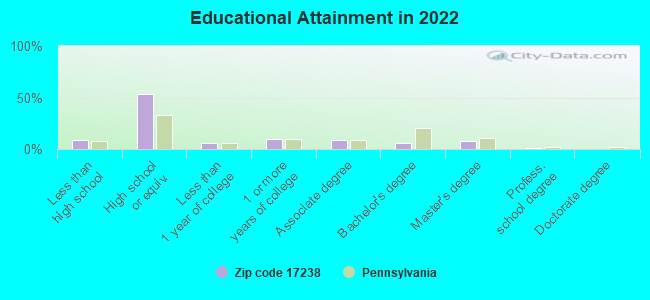
For population 25 years and over in 17238:
High school or higher: 90.0%
Bachelor's degree or higher: 13.6%
Graduate or professional degree: 8.3%
Unemployed: 1.5%
Mean travel time to work (commute): 35.8 minutes
For population 15 years and over in 17238:
Never married: 21.6%
Now married: 66.3%
Separated: 0.0%
Widowed: 6.7%
Divorced: 5.4%
Zip code 17238 compared to state average:
Unemployed percentage below state average.
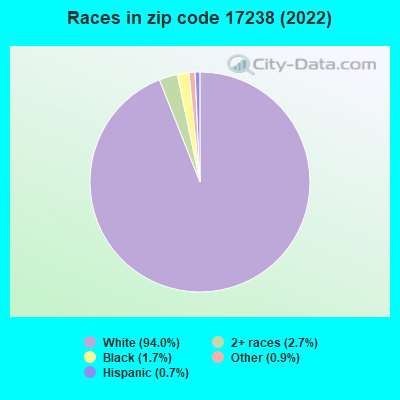
Black race population percentage significantly below state average.
Hispanic race population percentage significantly below state average.
Median age above state average.
Foreign-born population percentage significantly below state average.
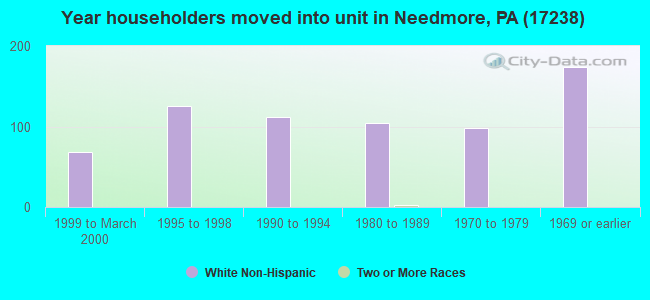
Length of stay since moving in significantly above state average.
Percentage of population with a bachelor's degree or higher significantly below state average.
Estimated median house/condo value in 2022: $217,065
17238:
$217,065
Pennsylvania:
$245,500
According to our research of Pennsylvania and other state lists, there were 2 registered sex offenders living in 17238 zip code as of May 28, 2024. The ratio of all residents to sex offenders in zip code 17238 is 781 to 1. The ratio of registered sex offenders to all residents in this zip code is lower than the state average.
Median resident age:
This zip code:
48.6 years
Pennsylvania median age:
40.9 years
Average household size:
This zip code:
2.4 people
Pennsylvania:
2.4 people
Averages for the 2020 tax year for zip code 17238, filed in 2021:
Average Adjusted Gross Income (AGI) in 2020: $57,939 (Individual Income Tax Returns)
Here:
$57,939
State:
$75,707
Salary/wage: $49,366 (reported on 78.9% of returns)
Here:
$49,366
State:
$62,806
(% of AGI for various income ranges: 1029.4% for AGIs below $25k, 3486.3% for AGIs $25k-50k, 6208.0% for AGIs $50k-75k, 8601.2% for AGIs $75k-100k, 22645.0% for AGIs $100k-200k)
Taxable interest for individuals: $643 (reported on 31.1% of returns)
This zip code:
$643
Pennsylvania:
$1,633
(% of AGI for various income ranges: 22.9% for AGIs below $25k, 15.8% for AGIs $25k-50k, 37.0% for AGIs $50k-75k, 17.5% for AGIs $75k-100k, 100.0% for AGIs $100k-200k)
Ordinary dividends: $2,775 (reported on 17.8% of returns)
Here:
$2,775
State:
$7,382
(% of AGI for various income ranges: 28.8% for AGIs below $25k, 14.2% for AGIs $25k-50k, 56.0% for AGIs $50k-75k, 520.0% for AGIs $100k-200k)
Net capital gain/loss in AGI: +$5,323 (reported on 14.4% of returns)
Here:
+$5,323
State:
+$23,522
(% of AGI for various income ranges: 8.8% for AGIs below $25k, 31.6% for AGIs $25k-50k, 91.0% for AGIs $50k-75k, 876.7% for AGIs $100k-200k)
Profit/loss from business: +$11,280 (reported on 11.1% of returns)
Here:
+$11,280
State:
+$16,274
(% of AGI for various income ranges: 160.0% for AGIs below $25k, 127.4% for AGIs $25k-50k, 265.0% for AGIs $50k-75k, 581.7% for AGIs $100k-200k)
Taxable individual retirement arrangement distribution: $15,560 (reported on 11.1% of returns)
17238:
$15,560
Pennsylvania:
$18,583
(% of AGI for various income ranges: 110.0% for AGIs below $25k, 126.3% for AGIs $25k-50k, 608.0% for AGIs $50k-75k, 868.3% for AGIs $100k-200k)
Total itemized deductions: $24,667 (reported on 3.3% of returns)
Here:
$24,667
State:
$34,850
(% of AGI for various income ranges: 740.0% for AGIs $50k-75k)
Taxes paid: $6,200 (reported on 3.3% of returns)
17238:
$6,200
State:
$8,200
(% of AGI for various income ranges: 186.0% for AGIs $50k-75k)
Earned income credit: $2,360 (reported on 11.1% of returns)
Here:
$2,360
State:
$2,100
(% of AGI for various income ranges: 84.7% for AGIs below $25k, 48.4% for AGIs $25k-50k)
Percentage of individuals using paid preparers for their 2020 taxes: 91.1%
Here:
91%
State:
92%
(% for various income ranges: 88.9% for AGIs below $25k, 92.0% for AGIs $25k-50k, 86.7% for AGIs $50k-75k, 90.0% for AGIs $75k-100k, 100.0% for AGIs $100k-200k)
Averages for the 2012 tax year for zip code 17238, filed in 2013:
Average Adjusted Gross Income (AGI) in 2012: $43,130 (Individual Income Tax Returns)
Here:
$43,130
State:
$61,346
Salary/wage: $39,772 (reported on 80.7% of returns)
Here:
$39,772
State:
$51,902
(% of AGI for various income ranges: 62.3% for AGIs below $25k, 77.7% for AGIs $25k-50k, 83.2% for AGIs $50k-75k, 80.8% for AGIs $75k-100k, 63.1% for AGIs $100k-200k)
Taxable interest for individuals: $1,238 (reported on 36.4% of returns)
This zip code:
$1,238
Pennsylvania:
$1,588
(% of AGI for various income ranges: 2.4% for AGIs below $25k, 0.6% for AGIs $25k-50k, 0.6% for AGIs $50k-75k, 0.2% for AGIs $75k-100k, 2.0% for AGIs $100k-200k)
Ordinary dividends: $2,021 (reported on 15.9% of returns)
Here:
$2,021
State:
$5,827
(% of AGI for various income ranges: 0.7% for AGIs below $25k, 0.3% for AGIs $25k-50k, 0.2% for AGIs $50k-75k, 0.3% for AGIs $75k-100k, 2.0% for AGIs $100k-200k)
Net capital gain/loss in AGI: +$1,520 (reported on 11.4% of returns)
Here:
+$1,520
State:
+$14,495
(% of AGI for various income ranges: 0.3% for AGIs $25k-50k, 1.7% for AGIs $100k-200k)
Profit/loss from business: +$7,600 (reported on 14.8% of returns)
Here:
+$7,600
State:
+$16,268
(% of AGI for various income ranges: 5.9% for AGIs below $25k, 3.8% for AGIs $25k-50k, 5.8% for AGIs $75k-100k)
Taxable individual retirement arrangement distribution: $7,664 (reported on 12.5% of returns)
17238:
$7,664
Pennsylvania:
$14,550
(% of AGI for various income ranges: 4.6% for AGIs below $25k, 3.8% for AGIs $25k-50k, 4.4% for AGIs $75k-100k)
Total itemized deductions: $16,871 (23% of AGI, reported on 23.9% of returns)
Here:
$16,871
State:
$23,538
Here:
22.7% of AGI
State:
18.4% of AGI
(% of AGI for various income ranges: 8.6% for AGIs below $25k, 6.5% for AGIs $25k-50k, 8.2% for AGIs $50k-75k, 11.3% for AGIs $75k-100k, 11.8% for AGIs $100k-200k)
Charity contributions: $4,833 (reported on 13.6% of returns)
Here:
$4,833
State:
$4,025
(% of AGI for various income ranges: 0.9% for AGIs $25k-50k, 1.0% for AGIs $50k-75k, 2.1% for AGIs $75k-100k, 2.7% for AGIs $100k-200k)
Taxes paid: $5,705 (reported on 22.7% of returns)
17238:
$5,705
State:
$9,982
(% of AGI for various income ranges: 2.2% for AGIs $25k-50k, 2.2% for AGIs $50k-75k, 3.7% for AGIs $75k-100k, 5.0% for AGIs $100k-200k)
Earned income credit: $1,877 (reported on 14.8% of returns)
Here:
$1,877
State:
$2,106
(% of AGI for various income ranges: 4.6% for AGIs below $25k, 0.9% for AGIs $25k-50k)
Percentage of individuals using paid preparers for their 2012 taxes: 54.5%
Here:
55%
State:
53%
(% for various income ranges: 51.5% for AGIs below $25k, 53.8% for AGIs $25k-50k, 61.5% for AGIs $50k-75k, 55.6% for AGIs $75k-100k, 57.1% for AGIs $100k-200k)
Averages for the 2004 tax year for zip code 17238, filed in 2005:
Average Adjusted Gross Income (AGI) in 2004: $37,490 (Individual Income Tax Returns)
Here:
$37,490
State:
$48,049
Salary/wage: $34,462 (reported on 82.6% of returns)
Here:
$34,462
State:
$42,646
(% of AGI for various income ranges: 77.4% for AGIs below $10k, 71.7% for AGIs $10k-25k, 80.4% for AGIs $25k-50k, 80.5% for AGIs $50k-75k, 83.0% for AGIs $75k-100k, 54.3% for AGIs over 100k)
Taxable interest for individuals: $1,169 (reported on 44.3% of returns)
This zip code:
$1,169
Pennsylvania:
$1,657
(% of AGI for various income ranges: 9.7% for AGIs below $10k, 3.7% for AGIs $10k-25k, 0.8% for AGIs $25k-50k, 0.9% for AGIs $50k-75k, 0.3% for AGIs $75k-100k, 1.7% for AGIs over 100k)
Taxable dividends: $1,210 (reported on 21.0% of returns)
Here:
$1,210
State:
$3,566
(% of AGI for various income ranges: 1.9% for AGIs below $10k, 1.6% for AGIs $10k-25k, 0.2% for AGIs $25k-50k, 0.2% for AGIs $50k-75k, 0.4% for AGIs $75k-100k, 1.9% for AGIs over 100k)
Net capital gain/loss: +$5,257 (reported on 17.2% of returns)
Here:
+$5,257
State:
+$9,716
(% of AGI for various income ranges: 2.3% for AGIs below $10k, -0.1% for AGIs $10k-25k, 1.1% for AGIs $25k-50k, 1.8% for AGIs $50k-75k, -0.1% for AGIs $75k-100k, 10.5% for AGIs over 100k)
Profit/loss from business: +$5,741 (reported on 16.6% of returns)
Here:
+$5,741
State:
+$14,267
(% of AGI for various income ranges: 4.0% for AGIs below $10k, 5.4% for AGIs $10k-25k, 3.1% for AGIs $25k-50k, 3.3% for AGIs $50k-75k, 0.6% for AGIs $75k-100k, -0.6% for AGIs over 100k)
IRA payment deduction: $3,318 (reported on 2.6% of returns)
17238:
$3,318
Pennsylvania:
$2,903
Total itemized deductions: $15,678 (25% of AGI, reported on 23.7% of returns)
Here:
$15,678
State:
$18,804
Here:
24.5% of AGI
State:
19.5% of AGI
(% of AGI for various income ranges: 9.0% for AGIs $10k-25k, 6.8% for AGIs $25k-50k, 13.0% for AGIs $50k-75k, 12.4% for AGIs $75k-100k, 10.7% for AGIs over 100k)
Charity contributions deductions: $3,392 (5% of AGI, reported on 18.2% of returns)
Here:
$3,392
State:
$3,337
Here:
5.1% of AGI
State:
3.3% of AGI
(% of AGI for various income ranges: 0.9% for AGIs $10k-25k, 1.1% for AGIs $25k-50k, 1.6% for AGIs $50k-75k, 2.3% for AGIs $75k-100k, 3.2% for AGIs over 100k)
Total tax: $4,216 (reported on 77.2% of returns)
17238:
$4,216
State:
$8,008
(% of AGI for various income ranges: 1.9% for AGIs below $10k, 4.5% for AGIs $10k-25k, 6.7% for AGIs $25k-50k, 8.7% for AGIs $50k-75k, 9.4% for AGIs $75k-100k, 16.3% for AGIs over 100k)
Earned income credit: $1,431 (reported on 13.0% of returns)
Here:
$1,431
State:
$1,643
Percentage of individuals using paid preparers for their 2004 taxes: 62.2%
Here:
62%
State:
56%
(% for various income ranges: 54.0% for AGIs below $10k, 60.1% for AGIs $10k-25k, 65.2% for AGIs $25k-50k, 64.8% for AGIs $50k-75k, 70.2% for AGIs $75k-100k, 64.5% for AGIs over 100k)
Household received Food Stamps/SNAP in the past 12 months: 79 Household did not receive Food Stamps/SNAP in the past 12 months: 657
Women who had a birth in the past 12 months: 8 (8 now married, 0 unmarried) Women who did not have a birth in the past 12 months: 316 (169 now married, 145 unmarried)
Housing units in zip code 17238 with a mortgage: 235 (50 second mortgage, 2 home equity loan, 45 both second mortgage and home equity loan) Houses without a mortgage: 45
Median monthly owner costs for units with a mortgage: $1,489 Median monthly owner costs for units without a mortgage: $483
Residents with income below the poverty level in 2022:
This zip code:
8.3%
Whole state:
11.8%
Residents with income below 50% of the poverty level in 2022:
This zip code:
5.2%
Whole state:
6.1%
Median number of rooms in houses and condos:
Here:
7.0
State:
6.8
Median number of rooms in apartments:
Here:
6.1
State:
4.3
Notable locations in this zip code not listed on our city pages
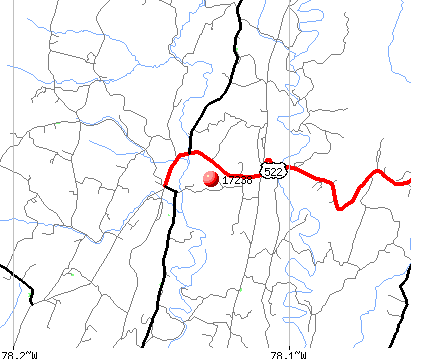
Churches in zip code 17238 include: Tonoloway Church (A), Pleasant Ridge Church (B), Oakley Church (C), Sideling Hill Church (D), Ebenezer Church (E). Display/hide their locations on the map
Streams, rivers, and creeks: Joes Run (A), Little Tonoloway Creek (B), Foster Creek (C), Cummings Run (D), Crane Run (E), Sawmill Run (F), Plum Run (G), Barnetts Run (H), Palmer Run (I). Display/hide their locations on the map
Size of family households: 288 2-persons, 101 3-persons, 103 4-persons, 57 5-persons, 3 6-persons, 8 7-or-more-persons
Size of nonfamily households: 165 1-person, 7 2-persons
230 married couples with children.
33 single-parent households (10 men, 23 women).
98.1% of residents of 17238 zip code speak English at home.
1.5% of residents speak Spanish at home (42% very well, 58% well).
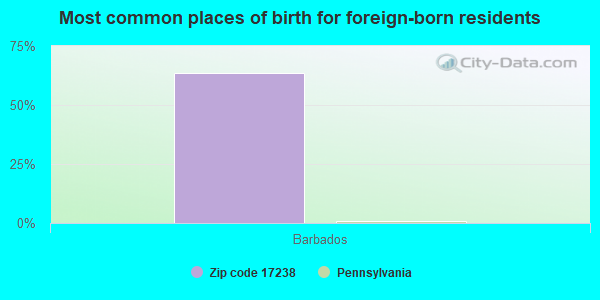
Foreign born population: 11 (0.6%) (64.6% of them are naturalized citizens)
This zip code:
0.6%
Whole state:
7.5%
64%Barbados
35%American
30%German
11%English
2%French
2%Welsh
2%Irish
1%Italian
Year of entry for the foreign-born population
02010 or later
62000 to 2009
61990 to 1999
9Before 1990
Housing units lacking complete plumbing facilities: 4.0% Housing units lacking complete kitchen facilities: 3.0%
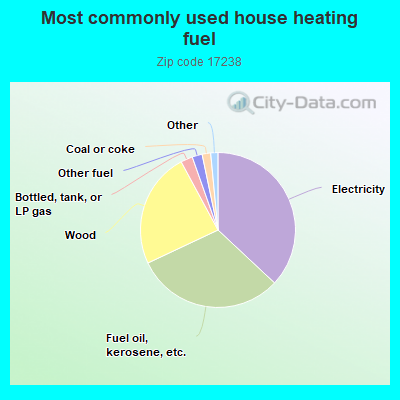
37.1%Electricity
31.1%Fuel oil, kerosene, etc.
24.2%Wood
2.5%Bottled, tank, or LP gas
2.1%Other fuel
1.8%Coal or coke
0.6%Utility gas
0.6%Solar energy
Population in 1990: 1,208. Population change in the 1990s: +601 (+49.8%).
Place of birth for U.S.-born residents:
This state: 952
Northeast: 122
Midwest: 10
South: 669
West: 39
74% of the 17238 zip code residents lived in the same house 5 years ago. Out of people who lived in different houses, 63% lived in this county. Out of people who lived in different counties, 50% lived in Pennsylvania.
97% of the 17238 zip code residents lived in the same house 1 year ago. Out of people who lived in different houses, 11% moved from this county. Out of people who lived in different houses, 43% moved from different county within same state. Out of people who lived in different houses, 52% moved from different state.
Private vs. public school enrollment:
Students in private schools in grades 1 to 8 (elementary and middle school): 26
Here:
17.8%
Pennsylvania:
15.7%
Students in private schools in grades 9 to 12 (high school): 7
Here:
13.7%
Pennsylvania:
13.4%
Students in private undergraduate colleges: 19
Here:
21.3%
Pennsylvania:
39.8%
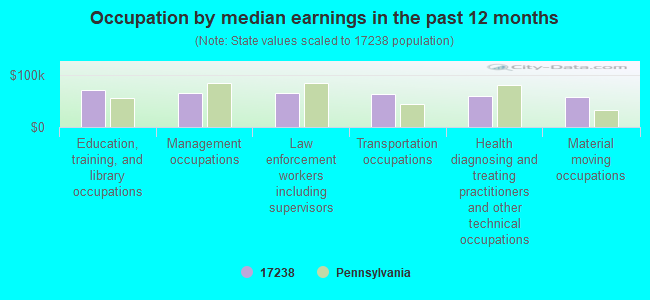
Occupation by median earnings in the past 12 months ($)
70,852Education, training, and library occupations
64,714Management occupations
64,470Law enforcement workers including supervisors
63,341Transportation occupations
60,225Health diagnosing and treating practitioners and other technical occupations
57,166Material moving occupations
Top industries in this zip code by the number of employees in 2005:
Educational Services: Elementary and Secondary Schools (10-19 employees: 1 establishment)
Other Services (except Public Administration): General Automotive Repair (5-9: 1, 1-4: 2)
Accommodation and Food Services: Bed-and-Breakfast Inns (5-9: 1)
Fatal accident statistics in 2010:
Fatal accident count: 2
Vehicles involved in fatal accidents: 3
Fatal accidents caused by drunken drivers: 1
Fatalities: 2
Persons involved in fatal accidents: 3
Pedestrians involved in fatal accidents: 0
Most common first names in zip code 17238 among deceased individuals
Name
Count
Lived (average)
Charles
10
73.4 years
James
7
63.3 years
William
6
77.0 years
John
6
62.3 years
Ruth
6
74.3 years
Ethel
5
78.8 years
Goldie
5
78.2 years
Walter
4
83.2 years
Edna
4
69.3 years
Alice
4
80.5 years
Most common last names in zip code 17238 among deceased individuals
Last name
Count
Lived (average)
Mellott
64
78.0 years
Deshong
18
80.9 years
Hann
11
70.0 years
Garland
10
77.5 years
Gordon
10
77.0 years
Truax
9
76.2 years
Swope
9
68.8 years
Miller
8
79.0 years
Hollenshead
6
70.5 years
Barnhart
6
81.0 years
Discuss Needmore, Pennsylvania (PA) on our hugely popular Pennsylvania forum.


 Nearest zip codes: 17212, 17267, 15536, 17228, 15533, 17233.