Estimated zip code population in 2022: 77
March 2022 cost of living index in zip code 17250: 91.0
(less than average, U.S. average is 100)
Land area: 0.0
sq. mi.
Water area: 0.0
sq. mi.
| Population density: 8,777 people per square mile | | (high). |
- OSM Map
- Google Map
- MSN Map
- OSM Map
- General Map
- Google Map
- MSN Map
- OSM Map
- Google Map
- MSN Map
- OSM Map
- Google Map
- MSN Map
Please wait while loading the map...
Business Search - 14 Million verified businesses
| Males: 35 |  (46.1%) (46.1%) |
| Females: 41 |  (53.9%) (53.9%) |
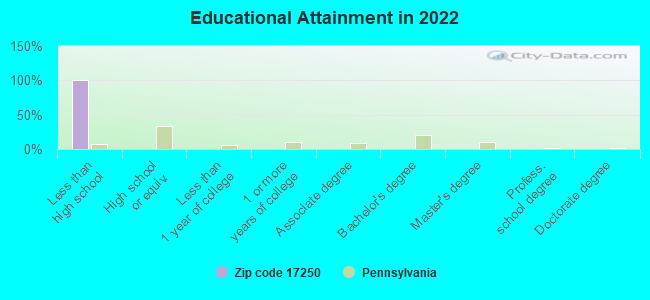
For population 25 years and over in 17250:
- High school or higher: 0.0%
- Bachelor's degree or higher: 0.0%
- Graduate or professional degree: 0.0%
For population 15 years and over in 17250:
- Never married: 0.0%
- Now married: 0.0%
- Separated: 0.0%
- Widowed: 45.8%
- Divorced: 54.2%
Zip code 17250 compared to state average:
- Median household income significantly below state average.
- Median house value significantly below state average.
- Unemployed percentage significantly below state average.
- Black race population percentage significantly below state average.
- Hispanic race population percentage significantly below state average.
- Median age significantly below state average.
- Foreign-born population percentage significantly below state average.
- Renting percentage significantly below state average.
- Length of stay since moving in significantly above state average.
- Number of rooms per house significantly below state average.
- House age significantly above state average.
- Number of college students significantly below state average.
- Percentage of population with a bachelor's degree or higher significantly below state average.
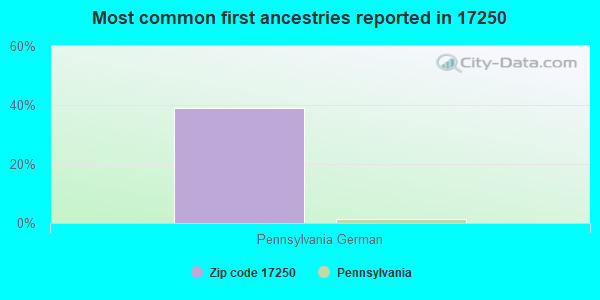
Data:
100%
urban population.
Average household size:| This zip code: | 2.1 people |
| Pennsylvania: | 2.4 people |
Averages for the 2004 tax year for zip code 17250, filed in 2005:
Average Adjusted Gross Income (AGI) in 2004: $27,817 (Individual Income Tax Returns)
| Here: | $27,817 |
| State: | $48,049 |
Salary/wage: $27,027 (reported on 83.9% of returns)
| Here: | $27,027 |
| State: | $42,646 |
(% of AGI for various income ranges: 76.6% for AGIs below $10k, 80.4% for AGIs $10k-25k, 76.6% for AGIs $25k-50k, 87.2% for AGIs $50k-75k)
Taxable interest for individuals: $305 (reported on 26.3% of returns)
| This zip code: | $305 |
| Pennsylvania: | $1,657 |
Taxable dividends: $1,471 (reported on 7.6% of returns)
Profit/loss from business: +$4,188 (reported on 7.1% of returns)
| Here: | +$4,188 |
| State: | +$14,267 |
Total itemized deductions: $11,308 (33% of AGI, reported on 5.8% of returns)
| Here: | $11,308 |
| State: | $18,804 |
| Here: | 32.9% of AGI |
| State: | 19.5% of AGI |
Total tax: $2,902 (reported on 77.2% of returns)
(% of AGI for various income ranges: 1.6% for AGIs below $10k, 4.7% for AGIs $10k-25k, 8.4% for AGIs $25k-50k, 10.2% for AGIs $50k-75k)
Earned income credit: $1,513 (reported on 17.4% of returns)
Percentage of individuals using paid preparers for their 2004 taxes: 51.8%
(% for various income ranges: 55.3% for AGIs below $10k, 58.5% for AGIs $10k-25k, 44.8% for AGIs $25k-50k, 45.9% for AGIs $50k-75k)
Nearest zip codes: 21719,
17214,
17268,
17247,
21780,
21783.
Rouzerville Zip Code Map
Percentage of family households:| This zip code: | 0.0% |
| Pennsylvania: | 42.6% |
Percentage of households with unmarried partners:| This zip code: | 0.0% |
| Pennsylvania: | 46.5% |
No gay or lesbian households reported
Household received Food Stamps/SNAP in the past 12 months: 0
Household did not receive Food Stamps/SNAP in the past 12 months: 36
Women who did not have a birth in the past 12 months: 41 (0 now married, 42 unmarried)
Housing units in zip code 17250 with a mortgage: 36

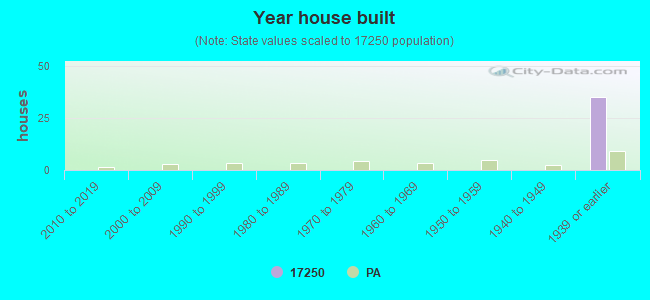
- Year house built (houses)
- 02020 or later
- 02010 to 2019
- 02000 to 2009
- 01990 to 1999
- 01980 to 1989
- 01970 to 1979
- 01960 to 1969
- 01950 to 1959
- 01940 to 1949
- 351939 or earlier
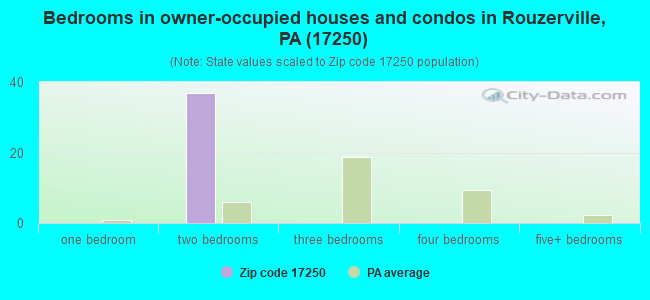
- Bedrooms in owner-occupied houses and condos in Rouzerville, PA (17250)
- 0no bedroom
- 01 bedroom
- 372 bedrooms
- 03 bedrooms
- 04 bedrooms
- 05+ bedrooms
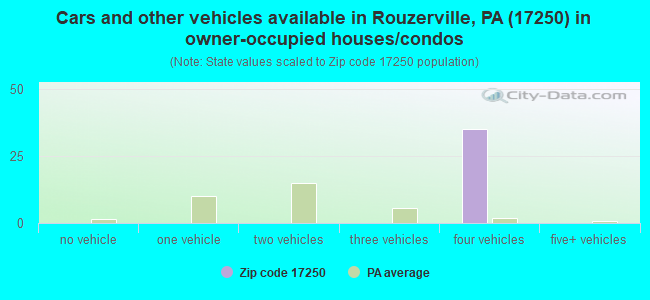
- Cars and other vehicles available in Rouzerville, PA (17250) in owner-occupied houses/condos
- 0no vehicle
- 01 vehicle
- 02 vehicles
- 03 vehicles
- 354 vehicles
- 05+ vehicles
Mean price in 2022:
Detached houses: $225,291| Here: | $225,291 |
| State: | $317,202 |
Mobile homes: $37,235| Here: | $37,235 |
| State: | $92,414 |
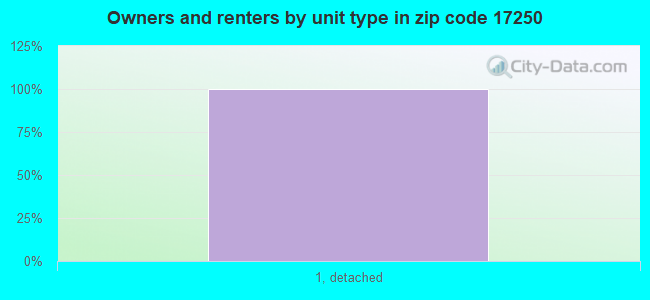
Housing units in structures:
Travel time to work (commute) in zip code 17250
![Travel time to work (commute) in zip code 17250]()
- 4030 to 34 minutes
Percentage of zip code residents living and working in this county: 0.0%
Household type by relationship:
Households: 77
- Male householders: 36 (0 living alone), Female householders: 0 (0 living alone)
0 spouses (0 opposite-sex spouses), 44 unmarried partners, (44 opposite-sex unmarried partners), 0 children (0 natural, 0 adopted, 0 stepchildren), 0 grandchildren, 0 brothers or sisters, 0 parents, 0 foster children, 0 other relatives, 0 non-relatives
Size of nonfamily households: 39 2-persons
All residents speak English at home
Foreign born population: 0 (0.0%)
Place of birth for U.S.-born residents:
100% of the 17250 zip code residents lived in the same house 1 year ago.
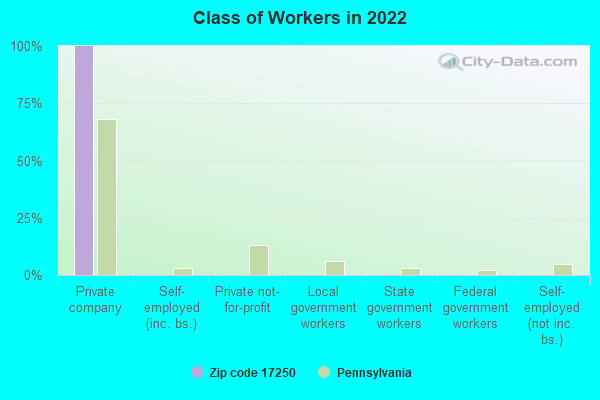
Top industries in this zip code by the number of employees in 2005:
- Finance and Insurance: Commercial Banking (5-9 employees: 1 establishment)
- Construction: Commercial and Institutional Building Construction (5-9: 1)
- Other Services (except Public Administration): Religious Organizations (1-4: 1)
- Accommodation and Food Services: Drinking Places (Alcoholic Beverages) (1-4: 1)
- Accommodation and Food Services: Full-Service Restaurants (1-4: 1)
- Real Estate and Rental and Leasing: Lessors of Nonresidential Buildings (except Miniwarehouses) (1-4: 1)
| Most common first names in zip code 17250 among deceased individuals |
| Name | Count | Lived (average) |
|---|
| Mary | 7 | 82.1 years |
| Charles | 5 | 58.6 years |
| Richard | 5 | 57.2 years |
| Melvin | 4 | 74.5 years |
| Dorothy | 4 | 70.5 years |
| John | 4 | 79.7 years |
| Clarence | 3 | 76.0 years |
| Betty | 3 | 79.6 years |
| Lloyd | 3 | 66.3 years |
| Daniel | 3 | 72.1 years |
| Most common last names in zip code 17250 among deceased individuals |
| Last name | Count | Lived (average) |
|---|
| Geesaman | 6 | 71.9 years |
| Green | 6 | 63.5 years |
| Gantz | 5 | 75.0 years |
| Smith | 5 | 75.8 years |
| Harbaugh | 4 | 77.5 years |
| Hartman | 4 | 78.0 years |
| Pryor | 3 | 76.7 years |
| Baker | 3 | 77.3 years |
| Barkdoll | 3 | 80.4 years |
| Toms | 3 | 79.3 years |