Estimated zip code population in 2022: 1,975 Zip code population in 2010: 1,625 Zip code population in 2000: 1,671
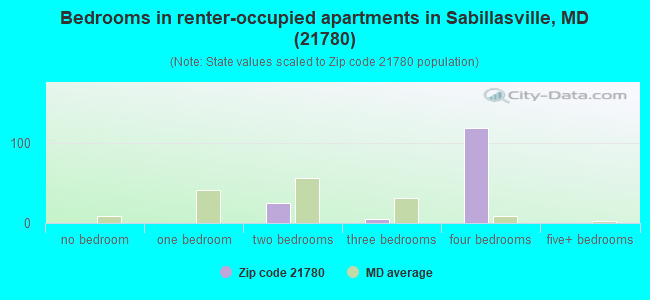
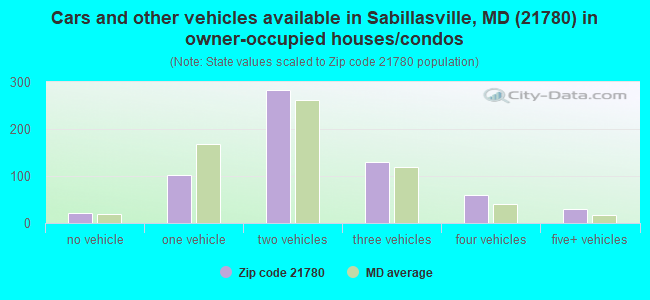
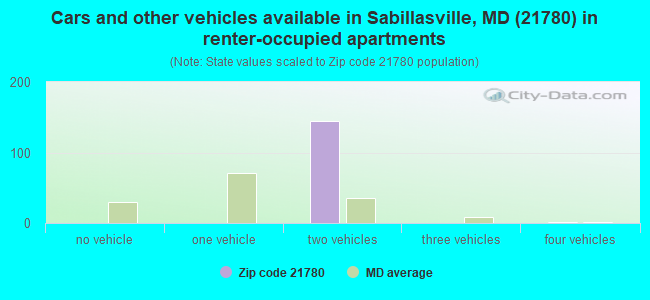
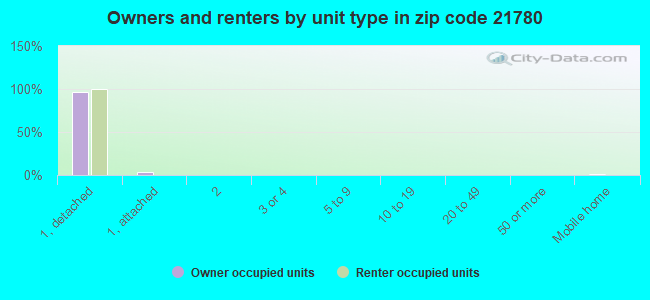
Houses and condos: 773 Renter-occupied apartments: 152
% of renters here:
19%
State:
32%
March 2022 cost of living index in zip code 21780: 140.5 (very high, U.S. average is 100)
Land area: 22.5 sq. mi. Water area: 0.0 sq. mi.
Population density: 88 people per square mile
(very low).
OSM Map
General Map
Google Map
MSN Map
OSM Map
General Map
Google Map
MSN Map
OSM Map
General Map
Google Map
MSN Map
OSM Map
General Map
Google Map
MSN Map
Please wait while loading the map...
Real estate property taxes paid for housing units in 2022:
This zip code:
0.7% ($3,034)
Maryland:
0.9% ($3,777)
Median real estate property taxes paid for housing units with mortgages in 2022: $3,286 (0.8%) Median real estate property taxes paid for housing units with no mortgage in 2022: $2,737 (0.7%)
Business Search- 14 Million verified businesses
Males: 955
(48.4%)
Females: 1,020
(51.6%)
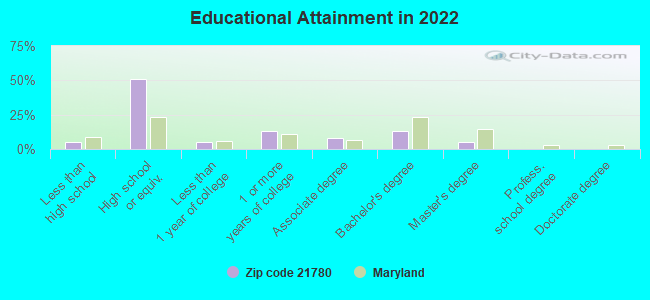
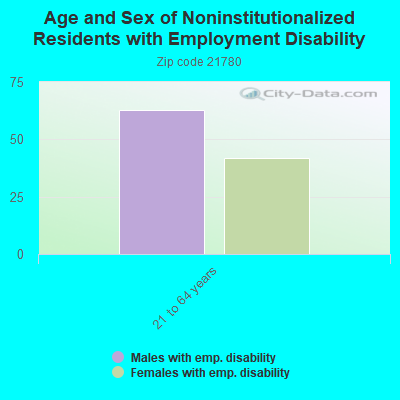
For population 25 years and over in 21780:
High school or higher: 93.4%
Bachelor's degree or higher: 18.3%
Graduate or professional degree: 5.3%
Mean travel time to work (commute): 42.3 minutes
For population 15 years and over in 21780:
Never married: 29.2%
Now married: 49.4%
Separated: 0.0%
Widowed: 13.2%
Divorced: 8.2%
Zip code 21780 compared to state average:
Median household income below state average.
Unemployed percentage significantly below state average.
Black race population percentage significantly below state average.
Hispanic race population percentage significantly below state average.
Median age significantly above state average.
Foreign-born population percentage significantly below state average.
Renting percentage below state average.
Length of stay since moving in significantly above state average.
Number of rooms per house above state average.
Number of college students significantly below state average.
Percentage of population with a bachelor's degree or higher significantly below state average.
Averages for the 2020 tax year for zip code 21780, filed in 2021:
Average Adjusted Gross Income (AGI) in 2020: $70,228 (Individual Income Tax Returns)
Here:
$70,228
State:
$86,905
Salary/wage: $64,754 (reported on 78.7% of returns)
Here:
$64,754
State:
$73,953
(% of AGI for various income ranges: 1064.2% for AGIs below $25k, 3522.0% for AGIs $25k-50k, 6301.1% for AGIs $50k-75k, 8580.0% for AGIs $75k-100k, 14101.0% for AGIs $100k-200k)
Taxable interest for individuals: $833 (reported on 36.0% of returns)
This zip code:
$833
Maryland:
$1,528
(% of AGI for various income ranges: 50.0% for AGIs below $25k, 38.7% for AGIs $25k-50k, 13.3% for AGIs $50k-75k, 46.7% for AGIs $75k-100k, 20.0% for AGIs $100k-200k)
Ordinary dividends: $2,023 (reported on 17.3% of returns)
Here:
$2,023
State:
$8,028
(% of AGI for various income ranges: 34.7% for AGIs $25k-50k, 98.9% for AGIs $50k-75k, 122.0% for AGIs $100k-200k)
Net capital gain/loss in AGI: +$6,833 (reported on 16.0% of returns)
Here:
+$6,833
State:
+$25,238
(% of AGI for various income ranges: 5.0% for AGIs below $25k, 28.9% for AGIs $50k-75k, 220.0% for AGIs $100k-200k)
Profit/loss from business: +$9,800 (reported on 17.3% of returns)
Here:
+$9,800
State:
+$11,398
(% of AGI for various income ranges: 44.2% for AGIs below $25k, 78.7% for AGIs $25k-50k, 523.3% for AGIs $50k-75k, 632.0% for AGIs $100k-200k)
Taxable individual retirement arrangement distribution: $11,600 (reported on 8.0% of returns)
21780:
$11,600
Maryland:
$20,944
(% of AGI for various income ranges: 262.7% for AGIs $25k-50k, 503.3% for AGIs $75k-100k)
Total itemized deductions: $25,300 (reported on 13.3% of returns)
Here:
$25,300
State:
$30,672
(% of AGI for various income ranges: 1093.3% for AGIs $50k-75k, 1546.0% for AGIs $100k-200k)
Charity contributions: $4,486 (reported on 9.3% of returns)
Here:
$4,486
State:
$9,065
(% of AGI for various income ranges: 118.9% for AGIs $50k-75k, 207.0% for AGIs $100k-200k)
Taxes paid: $7,900 (reported on 13.3% of returns)
21780:
$7,900
State:
$8,475
(% of AGI for various income ranges: 318.9% for AGIs $50k-75k, 503.0% for AGIs $100k-200k)
Earned income credit: $2,129 (reported on 9.3% of returns)
Here:
$2,129
State:
$2,151
(% of AGI for various income ranges: 63.3% for AGIs below $25k, 48.7% for AGIs $25k-50k)
Percentage of individuals using paid preparers for their 2020 taxes: 89.3%
Here:
89%
State:
90%
(% for various income ranges: 88.9% for AGIs below $25k, 89.5% for AGIs $25k-50k, 92.3% for AGIs $50k-75k, 87.5% for AGIs $75k-100k, 92.3% for AGIs $100k-200k, 75.0% for AGIs over 200k)
Averages for the 2012 tax year for zip code 21780, filed in 2013:
Average Adjusted Gross Income (AGI) in 2012: $55,299 (Individual Income Tax Returns)
Here:
$55,299
State:
$72,703
Salary/wage: $48,466 (reported on 85.9% of returns)
Here:
$48,466
State:
$62,228
(% of AGI for various income ranges: 68.7% for AGIs below $25k, 74.0% for AGIs $25k-50k, 79.0% for AGIs $50k-75k, 78.8% for AGIs $75k-100k, 74.0% for AGIs $100k-200k)
Taxable interest for individuals: $857 (reported on 42.3% of returns)
This zip code:
$857
Maryland:
$1,413
(% of AGI for various income ranges: 1.0% for AGIs below $25k, 1.5% for AGIs $25k-50k, 0.3% for AGIs $50k-75k, 0.2% for AGIs $75k-100k, 0.6% for AGIs $100k-200k)
Ordinary dividends: $913 (reported on 21.1% of returns)
Here:
$913
State:
$6,933
(% of AGI for various income ranges: 0.9% for AGIs below $25k, 0.4% for AGIs $25k-50k, 0.4% for AGIs $50k-75k, 0.2% for AGIs $75k-100k, 0.3% for AGIs $100k-200k)
Net capital gain/loss in AGI: +$2,333 (reported on 12.7% of returns)
Here:
+$2,333
State:
+$14,830
(% of AGI for various income ranges: 0.3% for AGIs below $25k, 1.3% for AGIs $100k-200k)
Profit/loss from business: +$9,891 (reported on 15.5% of returns)
Here:
+$9,891
State:
+$12,606
(% of AGI for various income ranges: 7.3% for AGIs below $25k, 3.4% for AGIs $25k-50k, 1.0% for AGIs $75k-100k, 3.7% for AGIs $100k-200k)
Taxable individual retirement arrangement distribution: $8,929 (reported on 9.9% of returns)
21780:
$8,929
Maryland:
$17,065
(% of AGI for various income ranges: 2.6% for AGIs below $25k, 3.7% for AGIs $25k-50k, 4.6% for AGIs $75k-100k)
Total itemized deductions: $21,364 (23% of AGI, reported on 39.4% of returns)
Here:
$21,364
State:
$27,886
Here:
23.3% of AGI
State:
22.8% of AGI
(% of AGI for various income ranges: 13.1% for AGIs below $25k, 10.3% for AGIs $25k-50k, 13.5% for AGIs $50k-75k, 16.4% for AGIs $75k-100k, 18.1% for AGIs $100k-200k)
Charity contributions: $2,744 (reported on 25.4% of returns)
Here:
$2,744
State:
$4,452
(% of AGI for various income ranges: 0.8% for AGIs $25k-50k, 1.4% for AGIs $50k-75k, 1.3% for AGIs $75k-100k, 1.6% for AGIs $100k-200k)
Taxes paid: $9,036 (reported on 39.4% of returns)
21780:
$9,036
State:
$11,690
(% of AGI for various income ranges: 3.2% for AGIs below $25k, 2.8% for AGIs $25k-50k, 5.6% for AGIs $50k-75k, 6.4% for AGIs $75k-100k, 9.0% for AGIs $100k-200k)
Earned income credit: $2,011 (reported on 12.7% of returns)
Here:
$2,011
State:
$2,199
(% of AGI for various income ranges: 4.2% for AGIs below $25k, 0.9% for AGIs $25k-50k)
Percentage of individuals using paid preparers for their 2012 taxes: 54.9%
Here:
55%
State:
52%
(% for various income ranges: 43.5% for AGIs below $25k, 57.9% for AGIs $25k-50k, 50.0% for AGIs $50k-75k, 71.4% for AGIs $75k-100k, 70.0% for AGIs $100k-200k)
Averages for the 2004 tax year for zip code 21780, filed in 2005:
Average Adjusted Gross Income (AGI) in 2004: $46,773 (Individual Income Tax Returns)
Here:
$46,773
State:
$60,339
Salary/wage: $43,310 (reported on 87.5% of returns)
Here:
$43,310
State:
$52,211
(% of AGI for various income ranges: 79.5% for AGIs below $10k, 80.7% for AGIs $10k-25k, 85.9% for AGIs $25k-50k, 88.9% for AGIs $50k-75k, 87.9% for AGIs $75k-100k, 64.9% for AGIs over 100k)
Taxable interest for individuals: $880 (reported on 51.9% of returns)
This zip code:
$880
Maryland:
$1,701
(% of AGI for various income ranges: 9.3% for AGIs below $10k, 2.1% for AGIs $10k-25k, 0.6% for AGIs $25k-50k, 0.6% for AGIs $50k-75k, 0.7% for AGIs $75k-100k, 1.1% for AGIs over 100k)
Taxable dividends: $1,262 (reported on 20.6% of returns)
Here:
$1,262
State:
$4,235
(% of AGI for various income ranges: 1.7% for AGIs below $10k, 0.8% for AGIs $10k-25k, 0.9% for AGIs $25k-50k, 0.1% for AGIs $50k-75k, 0.1% for AGIs $75k-100k, 0.9% for AGIs over 100k)
Net capital gain/loss: +$7,628 (reported on 13.0% of returns)
Here:
+$7,628
State:
+$15,888
(% of AGI for various income ranges: 0.2% for AGIs below $10k, 0.3% for AGIs $25k-50k, 0.4% for AGIs $50k-75k, -0.0% for AGIs $75k-100k, 7.6% for AGIs over 100k)
Profit/loss from business: +$3,779 (reported on 11.9% of returns)
Here:
+$3,779
State:
+$12,221
(% of AGI for various income ranges: 0.5% for AGIs $10k-25k, 2.3% for AGIs $25k-50k, -0.6% for AGIs $50k-75k, 2.8% for AGIs $75k-100k)
IRA payment deduction: $2,462 (reported on 1.8% of returns)
21780:
$2,462
Maryland:
$2,968
Total itemized deductions: $17,833 (24% of AGI, reported on 38.1% of returns)
Here:
$17,833
State:
$22,960
Here:
23.6% of AGI
State:
23.3% of AGI
(% of AGI for various income ranges: 10.1% for AGIs $10k-25k, 12.7% for AGIs $25k-50k, 15.8% for AGIs $50k-75k, 16.9% for AGIs $75k-100k, 15.4% for AGIs over 100k)
Charity contributions deductions: $2,295 (3% of AGI, reported on 30.5% of returns)
Here:
$2,295
State:
$4,031
Here:
2.8% of AGI
State:
3.9% of AGI
(% of AGI for various income ranges: 0.6% for AGIs $10k-25k, 0.7% for AGIs $25k-50k, 1.5% for AGIs $50k-75k, 1.6% for AGIs $75k-100k, 2.5% for AGIs over 100k)
Total tax: $5,950 (reported on 79.9% of returns)
21780:
$5,950
State:
$10,167
(% of AGI for various income ranges: 4.2% for AGIs below $10k, 4.0% for AGIs $10k-25k, 6.3% for AGIs $25k-50k, 8.3% for AGIs $50k-75k, 10.3% for AGIs $75k-100k, 17.2% for AGIs over 100k)
Earned income credit: $1,333 (reported on 11.2% of returns)
Here:
$1,333
State:
$1,700
Percentage of individuals using paid preparers for their 2004 taxes: 59.4%
Here:
59%
State:
55%
(% for various income ranges: 48.2% for AGIs below $10k, 51.4% for AGIs $10k-25k, 63.8% for AGIs $25k-50k, 64.6% for AGIs $50k-75k, 64.0% for AGIs $75k-100k, 67.3% for AGIs over 100k)
Household received Food Stamps/SNAP in the past 12 months: 8 Household did not receive Food Stamps/SNAP in the past 12 months: 766
Women who did not have a birth in the past 12 months: 401 (191 now married, 210 unmarried)
Housing units in zip code 21780 with a mortgage: 381 (58 second mortgage, 60 both second mortgage and home equity loan) Median monthly owner costs for units with a mortgage: $2,115 Median monthly owner costs for units without a mortgage: $497
Residents with income below the poverty level in 2022:
This zip code:
7.8%
Whole state:
9.6%
Residents with income below 50% of the poverty level in 2022:
This zip code:
3.8%
Whole state:
4.7%
Median number of rooms in houses and condos:
Here:
7.0
State:
7.3
Median number of rooms in apartments:
Here:
7.7
State:
4.2
Notable locations in this zip code not listed on our city pages
Notable locations in zip code 21780: Camp Airy (A), Scenic View Orchards (B), Lantz (C), Round Meadow Camp Number 4 (D), Owens Creek Camp (E), Foxville Ranger Station (F), Camp 3 (G), Camp 2 (H). Display/hide their locations on the map
Churches in zip code 21780 include: Deerfield United Methodist Church (A), Saint John United Methodist Church (B), Saint Mark Lutheran Church (C), Germantown Church (D), Mount Maria Church (E). Display/hide their locations on the map
Cemeteries: Browns Cemetery (1), United Brethren Cemetery (2), Saint Johns Cemetery (3), Otterbein Chapel Cemetery (4), Mount Moriah Cemetery (5), Germantown Bethel Cemetery (6). Display/hide their locations on the map
In group quarters: 49 (-1 institutionalized population)
Size of family households: 327 2-persons, 136 3-persons, 61 4-persons, 26 5-persons, 50 6-persons
Size of nonfamily households: 155 1-person, 22 2-persons
293 married couples with children.
47 single-parent households (47 women).
97.6% of residents of 21780 zip code speak English at home.
0.7% of residents speak Spanish at home (100% well).
0.7% of residents speak other Indo-European language at home (100% very well).
Foreign born population: 14 (0.8%) (0.0% of them are naturalized citizens)
:
0.8%
Whole state:
16.7%
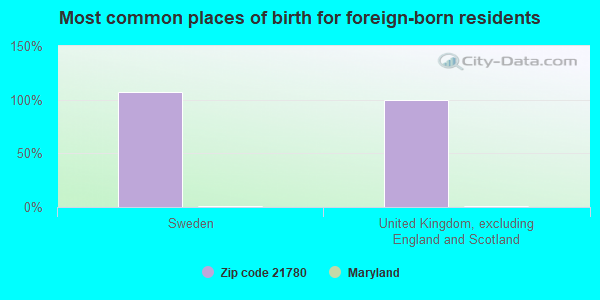
107%Sweden
100%United Kingdom, excluding England and Scotland
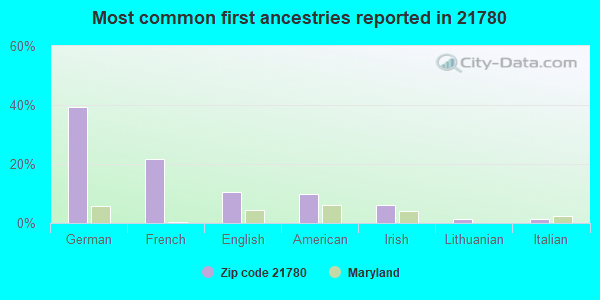
39%German
22%French
11%English
10%American
6%Irish
1%Lithuanian
1%Italian
Year of entry for the foreign-born population
352010 or later
02000 to 2009
01990 to 1999
4Before 1990
Facilities with environmental interests located in this zip code:
CAMP WEST MAR (14509 BROWN ROAD in SABILLASVILLE, MD)
STATE MASTER (Maryland Permits tracking) - National Pollutant Discharge Elimination System Permit National Pollutant Discharge Elimination System NON-MAJOR (Tracking pollutant discharge elimination systems) - permit Business SIC classification: SPORTING AND RECREATIONAL CAMPS; RECREATIONAL VEHICLE PARKS AND CAMPSITES Alternative names: CAMP WEST MAR AMERICAN LEGION
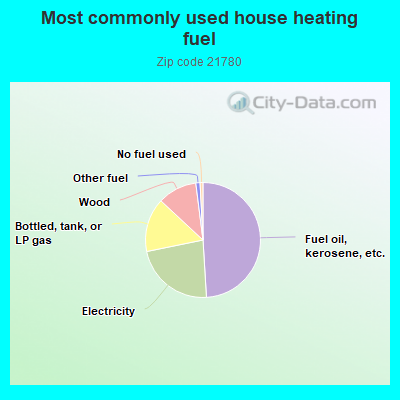
49.2%Fuel oil, kerosene, etc.
22.8%Electricity
15.2%Bottled, tank, or LP gas
11.1%Wood
1.2%Other fuel
0.8%No fuel used
Population in 1990: 1,605. Population change in the 1990s: +66 (+4.1%).
Place of birth for U.S.-born residents:
This state: 1,245
Northeast: 458
Midwest: 56
South: 134
West: 27
52% of the 21780 zip code residents lived in the same house 5 years ago. Out of people who lived in different houses, 52% lived in this county. Out of people who lived in different counties, 50% lived in Maryland.
93% of the 21780 zip code residents lived in the same house 1 year ago. Out of people who lived in different houses, 26% moved from this county. Out of people who lived in different houses, 43% moved from different county within same state. Out of people who lived in different houses, 34% moved from different state.
Private vs. public school enrollment:
Students in private schools in grades 1 to 8 (elementary and middle school): 31
Here:
14.8%
Maryland:
15.2%
Students in private schools in grades 9 to 12 (high school): 48
Here:
49.9%
Maryland:
14.4%
Students in private undergraduate colleges:
Here:
0.0%
Maryland:
20.2%
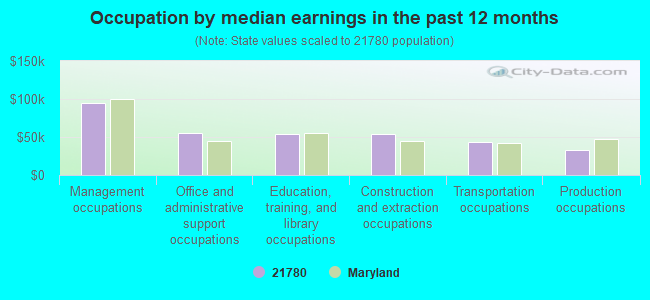
Occupation by median earnings in the past 12 months ($)
94,873Management occupations
55,331Office and administrative support occupations
54,409Education, training, and library occupations
53,892Construction and extraction occupations
42,940Transportation occupations
32,262Production occupations
Top industries in this zip code by the number of employees in 2005:
Construction: New Single-Family Housing Construction (except Operative Builders) (10-19 employees: 1 establishment, 5-9 employees: 2 establishments)
Construction: Residential Remodelers (1-4: 2)
Construction: Electrical Contractors (1-4: 1)
Other Services (except Public Administration): Automotive Transmission Repair (1-4: 1)
Professional, Scientific, and Technical Services: Offices of Certified Public Accountants (1-4: 1)
Construction: Plumbing, Heating, and Air-Conditioning Contractors (1-4: 1)
Construction: Masonry Contractors (1-4: 1)
Health Care and Social Assistance: Offices of Mental Health Practitioners (except Physicians) (1-4: 1)
Administrative and Support and Waste Management and Remediation Services: Landscaping Services (1-4: 1)
Accommodation and Food Services: Recreational and Vacation Camps (except Campgrounds) (1-4: 1)
People in group quarters in 2010:
90 people in military barracks and dormitories (nondisciplinary)
54 people in correctional facilities intended for juveniles
8 people in workers' group living quarters and job corps centers
People in group quarters in 2000:
211 people in training schools for juvenile delinquents
10 people in agriculture workers' dormitories on farms
Fatal accident statistics in 2013:
Fatal accident count: 1
Vehicles involved in fatal accidents: 1
Fatal accidents caused by drunken drivers: 0
Fatalities: 1
Persons involved in fatal accidents: 2
Pedestrians involved in fatal accidents: 0
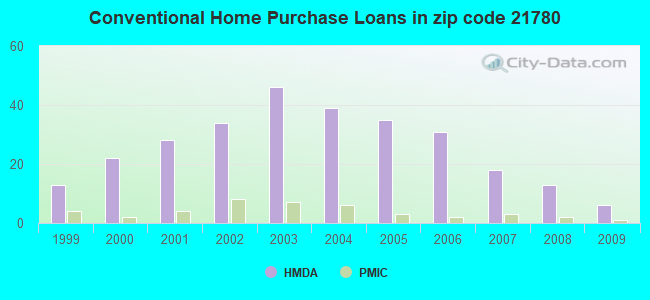
Home Mortgage Disclosure Act Aggregated Statistics For Year 2009 (Based on 2 partial tracts)
A) FHA, FSA/RHS & VA Home Purchase Loans
B) Conventional Home Purchase Loans
C) Refinancings
D) Home Improvement Loans
F) Non-occupant Loans on < 5 Family Dwellings (A B C & D)
G) Loans On Manufactured Home Dwelling (A B C & D)
Number
Average Value
Number
Average Value
Number
Average Value
Number
Average Value
Number
Average Value
Number
Average Value
LOANS ORIGINATED
3
$190,823
6
$273,225
66
$224,705
2
$130,105
4
$164,312
0
$0
APPLICATIONS APPROVED, NOT ACCEPTED
1
$196,420
0
$0
3
$209,570
2
$45,745
0
$0
0
$0
APPLICATIONS DENIED
0
$0
1
$16,790
28
$243,696
2
$2,520
2
$207,750
3
$162,843
APPLICATIONS WITHDRAWN
1
$160,330
0
$0
14
$286,955
0
$0
0
$0
0
$0
FILES CLOSED FOR INCOMPLETENESS
0
$0
0
$0
2
$101,565
0
$0
0
$0
0
$0
Aggregated Statistics For Year 2008 (Based on 2 partial tracts)
A) FHA, FSA/RHS & VA Home Purchase Loans
B) Conventional Home Purchase Loans
C) Refinancings
D) Home Improvement Loans
F) Non-occupant Loans on < 5 Family Dwellings (A B C & D)
G) Loans On Manufactured Home Dwelling (A B C & D)
Number
Average Value
Number
Average Value
Number
Average Value
Number
Average Value
Number
Average Value
Number
Average Value
LOANS ORIGINATED
3
$122,553
13
$239,229
30
$212,172
7
$42,330
4
$244,265
0
$0
APPLICATIONS APPROVED, NOT ACCEPTED
0
$0
4
$246,992
4
$264,410
1
$18,470
0
$0
0
$0
APPLICATIONS DENIED
0
$0
2
$294,210
21
$315,654
9
$133,744
1
$339,960
0
$0
APPLICATIONS WITHDRAWN
1
$110,800
4
$410,048
13
$204,943
2
$66,315
2
$160,745
1
$125,070
FILES CLOSED FOR INCOMPLETENESS
0
$0
1
$352,550
2
$215,305
1
$293,790
2
$323,170
0
$0
Aggregated Statistics For Year 2007 (Based on 2 partial tracts)
A) FHA, FSA/RHS & VA Home Purchase Loans
B) Conventional Home Purchase Loans
C) Refinancings
D) Home Improvement Loans
F) Non-occupant Loans on < 5 Family Dwellings (A B C & D)
G) Loans On Manufactured Home Dwelling (A B C & D)
Number
Average Value
Number
Average Value
Number
Average Value
Number
Average Value
Number
Average Value
Number
Average Value
LOANS ORIGINATED
3
$182,990
18
$274,111
73
$233,100
12
$93,523
3
$261,613
1
$119,190
APPLICATIONS APPROVED, NOT ACCEPTED
0
$0
1
$203,130
8
$249,092
1
$24,340
0
$0
0
$0
APPLICATIONS DENIED
0
$0
3
$278,960
29
$255,641
8
$96,636
3
$228,877
1
$20,980
APPLICATIONS WITHDRAWN
0
$0
4
$388,642
14
$184,668
2
$54,560
1
$226,640
0
$0
FILES CLOSED FOR INCOMPLETENESS
0
$0
2
$351,290
0
$0
0
$0
0
$0
0
$0
Aggregated Statistics For Year 2006 (Based on 2 partial tracts)
A) FHA, FSA/RHS & VA Home Purchase Loans
B) Conventional Home Purchase Loans
C) Refinancings
D) Home Improvement Loans
F) Non-occupant Loans on < 5 Family Dwellings (A B C & D)
G) Loans On Manufactured Home Dwelling (A B C & D)
Number
Average Value
Number
Average Value
Number
Average Value
Number
Average Value
Number
Average Value
Number
Average Value
LOANS ORIGINATED
2
$172,915
31
$239,662
72
$228,958
15
$85,339
8
$112,480
1
$60,440
APPLICATIONS APPROVED, NOT ACCEPTED
0
$0
2
$162,005
8
$221,706
2
$88,975
1
$161,160
0
$0
APPLICATIONS DENIED
3
$186,347
3
$150,533
25
$253,768
6
$96,532
2
$156,130
1
$8,390
APPLICATIONS WITHDRAWN
0
$0
3
$261,613
32
$203,791
4
$99,678
1
$196,420
1
$125,910
FILES CLOSED FOR INCOMPLETENESS
0
$0
2
$208,170
5
$166,034
1
$98,210
0
$0
0
$0
Aggregated Statistics For Year 2005 (Based on 2 partial tracts)
B) Conventional Home Purchase Loans
C) Refinancings
D) Home Improvement Loans
F) Non-occupant Loans on < 5 Family Dwellings (A B C & D)
G) Loans On Manufactured Home Dwelling (A B C & D)
Number
Average Value
Number
Average Value
Number
Average Value
Number
Average Value
Number
Average Value
LOANS ORIGINATED
35
$247,959
69
$199,558
13
$112,802
5
$173,924
1
$83,940
APPLICATIONS APPROVED, NOT ACCEPTED
3
$245,663
9
$216,752
3
$42,530
1
$90,660
1
$8,390
APPLICATIONS DENIED
11
$337,896
28
$218,844
5
$107,778
3
$81,143
0
$0
APPLICATIONS WITHDRAWN
8
$306,591
27
$169,807
1
$243,430
3
$262,173
1
$170,400
FILES CLOSED FOR INCOMPLETENESS
1
$120,870
6
$185,367
0
$0
0
$0
0
$0
Aggregated Statistics For Year 2004 (Based on 2 partial tracts)
A) FHA, FSA/RHS & VA Home Purchase Loans
B) Conventional Home Purchase Loans
C) Refinancings
D) Home Improvement Loans
F) Non-occupant Loans on < 5 Family Dwellings (A B C & D)
G) Loans On Manufactured Home Dwelling (A B C & D)
Number
Average Value
Number
Average Value
Number
Average Value
Number
Average Value
Number
Average Value
Number
Average Value
LOANS ORIGINATED
3
$187,187
39
$215,683
89
$179,405
12
$41,341
8
$213,418
4
$47,425
APPLICATIONS APPROVED, NOT ACCEPTED
0
$0
5
$231,506
15
$234,025
1
$25,180
1
$157,810
0
$0
APPLICATIONS DENIED
1
$162,000
3
$36,653
29
$152,076
6
$55,820
3
$148,293
2
$61,275
APPLICATIONS WITHDRAWN
0
$0
4
$260,005
23
$166,457
2
$155,710
0
$0
0
$0
FILES CLOSED FOR INCOMPLETENESS
0
$0
3
$167,600
8
$187,921
1
$26,860
0
$0
0
$0
Aggregated Statistics For Year 2003 (Based on 2 partial tracts)
A) FHA, FSA/RHS & VA Home Purchase Loans
B) Conventional Home Purchase Loans
C) Refinancings
D) Home Improvement Loans
F) Non-occupant Loans on < 5 Family Dwellings (A B C & D)
Number
Average Value
Number
Average Value
Number
Average Value
Number
Average Value
Number
Average Value
LOANS ORIGINATED
3
$191,103
46
$174,924
153
$155,871
5
$124,400
4
$167,250
APPLICATIONS APPROVED, NOT ACCEPTED
0
$0
2
$39,450
18
$146,942
0
$0
1
$55,400
APPLICATIONS DENIED
0
$0
6
$166,202
36
$137,102
6
$38,892
4
$71,350
APPLICATIONS WITHDRAWN
2
$247,205
12
$192,992
35
$161,692
0
$0
0
$0
FILES CLOSED FOR INCOMPLETENESS
0
$0
0
$0
3
$156,407
0
$0
0
$0
Aggregated Statistics For Year 2002 (Based on 2 partial tracts)
A) FHA, FSA/RHS & VA Home Purchase Loans
B) Conventional Home Purchase Loans
C) Refinancings
D) Home Improvement Loans
F) Non-occupant Loans on < 5 Family Dwellings (A B C & D)
Number
Average Value
Number
Average Value
Number
Average Value
Number
Average Value
Number
Average Value
LOANS ORIGINATED
5
$138,668
34
$138,353
96
$148,320
8
$53,198
3
$117,237
APPLICATIONS APPROVED, NOT ACCEPTED
0
$0
2
$189,285
3
$100,170
3
$47,287
0
$0
APPLICATIONS DENIED
0
$0
3
$81,143
31
$127,724
2
$14,690
1
$107,440
APPLICATIONS WITHDRAWN
0
$0
10
$184,752
27
$140,988
2
$18,885
0
$0
FILES CLOSED FOR INCOMPLETENESS
0
$0
1
$130,110
3
$140,460
0
$0
0
$0
Aggregated Statistics For Year 2001 (Based on 2 partial tracts)
A) FHA, FSA/RHS & VA Home Purchase Loans
B) Conventional Home Purchase Loans
C) Refinancings
D) Home Improvement Loans
F) Non-occupant Loans on < 5 Family Dwellings (A B C & D)
Number
Average Value
Number
Average Value
Number
Average Value
Number
Average Value
Number
Average Value
LOANS ORIGINATED
3
$128,987
28
$110,951
62
$126,790
11
$27,624
6
$116,397
APPLICATIONS APPROVED, NOT ACCEPTED
0
$0
3
$97,090
7
$140,300
1
$6,720
0
$0
APPLICATIONS DENIED
2
$88,555
5
$105,764
23
$101,166
4
$32,737
0
$0
APPLICATIONS WITHDRAWN
1
$173,760
3
$94,013
18
$122,599
3
$19,307
0
$0
FILES CLOSED FOR INCOMPLETENESS
0
$0
0
$0
4
$111,640
0
$0
0
$0
Aggregated Statistics For Year 2000 (Based on 2 partial tracts)
A) FHA, FSA/RHS & VA Home Purchase Loans
B) Conventional Home Purchase Loans
C) Refinancings
D) Home Improvement Loans
F) Non-occupant Loans on < 5 Family Dwellings (A B C & D)
Number
Average Value
Number
Average Value
Number
Average Value
Number
Average Value
Number
Average Value
LOANS ORIGINATED
7
$117,516
22
$114,273
24
$114,368
8
$40,291
2
$45,330
APPLICATIONS APPROVED, NOT ACCEPTED
1
$100,730
4
$85,828
7
$70,390
1
$16,790
0
$0
APPLICATIONS DENIED
0
$0
3
$25,463
19
$79,611
9
$32,923
0
$0
APPLICATIONS WITHDRAWN
0
$0
1
$16,790
11
$84,855
0
$0
0
$0
FILES CLOSED FOR INCOMPLETENESS
0
$0
1
$27,700
3
$106,883
0
$0
0
$0
Aggregated Statistics For Year 1999 (Based on 1 partial tract)
A) FHA, FSA/RHS & VA Home Purchase Loans
B) Conventional Home Purchase Loans
C) Refinancings
D) Home Improvement Loans
F) Non-occupant Loans on < 5 Family Dwellings (A B C & D)
Detailed PMIC statistics for the following Tracts:7529.00
2002 - 2018 National Fire Incident Reporting System (NFIRS) incidents
According to the data from the years 2002 - 2018 the average number of fires per year is 8. The highest number of reported fires - 22 took place in 2009, and the least - 2 in 2002. The data has a rising trend.
When looking into fire subcategories, the most incidents belonged to: Structure Fires (64.5%), and Outside Fires (26.2%).
Fire incident types reported to NFIRS in Zip Code 21780


 Nearest zip codes: 21719, 17214, 17250, 21783, 21788, 17320.


 According to the data from the years 2002 - 2018 the average number of fires per year is 8. The highest number of reported fires - 22 took place in 2009, and the least - 2 in 2002. The data has a rising trend.
 When looking into fire subcategories, the most incidents belonged to: Structure Fires (64.5%), and Outside Fires (26.2%).