Estimated zip code population in 2022: 8,195 Zip code population in 2010: 7,823 Zip code population in 2000: 6,938
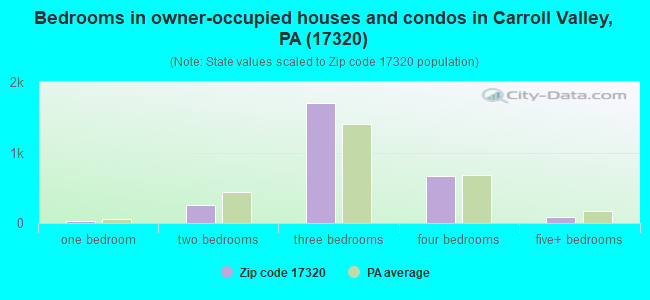
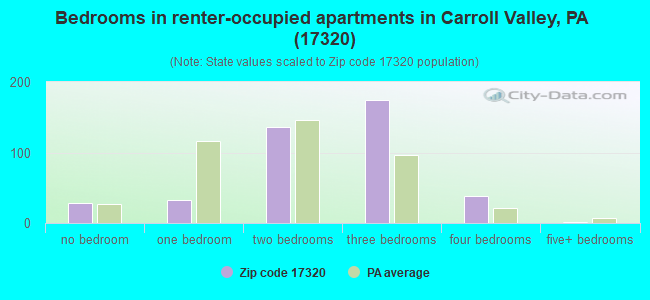
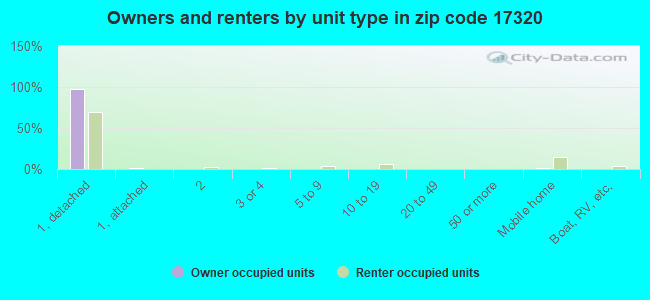
Houses and condos: 3,466 Renter-occupied apartments: 419
% of renters here:
13%
State:
31%
March 2022 cost of living index in zip code 17320: 94.2 (less than average, U.S. average is 100)
Land area: 55.6 sq. mi. Water area: 0.2 sq. mi.
Population density: 147 people per square mile
(very low).
OSM Map
General Map
Google Map
MSN Map
OSM Map
General Map
Google Map
MSN Map
OSM Map
General Map
Google Map
MSN Map
OSM Map
General Map
Google Map
MSN Map
Please wait while loading the map...
Real estate property taxes paid for housing units in 2022:
This zip code:
1.1% ($3,262)
Pennsylvania:
1.3% ($3,094)
Median real estate property taxes paid for housing units with mortgages in 2022: $3,291 (1.1%) Median real estate property taxes paid for housing units with no mortgage in 2022: $3,213 (1.2%)
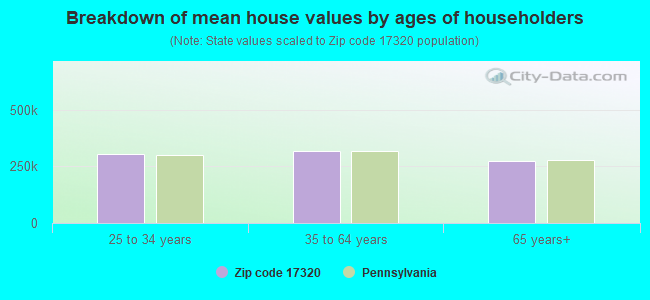
Estimated median house/condo value in 2022: $299,115
17320:
$299,115
Pennsylvania:
$245,500
According to our research of Pennsylvania and other state lists, there were 9 registered sex offenders living in 17320 zip code as of May 20, 2024. The ratio of all residents to sex offenders in zip code 17320 is 873 to 1. The ratio of registered sex offenders to all residents in this zip code is lower than the state average.
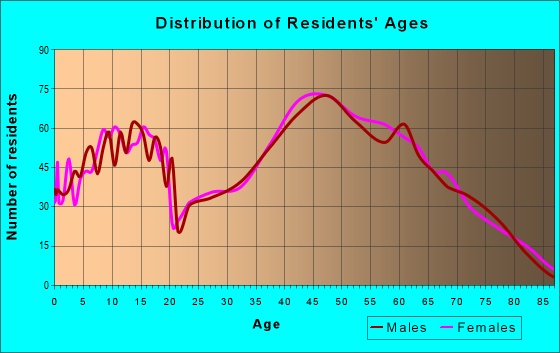
Median resident age:
This zip code:
45.4 years
Pennsylvania median age:
40.9 years
Average household size:
This zip code:
2.6 people
Pennsylvania:
2.4 people
Averages for the 2020 tax year for zip code 17320, filed in 2021:
Average Adjusted Gross Income (AGI) in 2020: $74,383 (Individual Income Tax Returns)
Here:
$74,383
State:
$75,707
Salary/wage: $62,606 (reported on 81.1% of returns)
Here:
$62,606
State:
$62,806
(% of AGI for various income ranges: 1029.9% for AGIs below $25k, 3429.4% for AGIs $25k-50k, 5934.6% for AGIs $50k-75k, 9049.4% for AGIs $75k-100k, 17516.8% for AGIs $100k-200k, 54876.7% for AGIs over 200k)
Taxable interest for individuals: $1,196 (reported on 34.0% of returns)
This zip code:
$1,196
Pennsylvania:
$1,633
(% of AGI for various income ranges: 25.1% for AGIs below $25k, 21.9% for AGIs $25k-50k, 41.8% for AGIs $50k-75k, 62.9% for AGIs $75k-100k, 108.2% for AGIs $100k-200k, 661.7% for AGIs over 200k)
Ordinary dividends: $3,260 (reported on 20.1% of returns)
Here:
$3,260
State:
$7,382
(% of AGI for various income ranges: 29.2% for AGIs below $25k, 35.5% for AGIs $25k-50k, 39.2% for AGIs $50k-75k, 114.1% for AGIs $75k-100k, 164.0% for AGIs $100k-200k, 1455.0% for AGIs over 200k)
Net capital gain/loss in AGI: +$15,162 (reported on 17.5% of returns)
Here:
+$15,162
State:
+$23,522
(% of AGI for various income ranges: 11.8% for AGIs below $25k, 38.8% for AGIs $25k-50k, 87.0% for AGIs $50k-75k, 124.4% for AGIs $75k-100k, 520.2% for AGIs $100k-200k, 12090.0% for AGIs over 200k)
Profit/loss from business: +$12,945 (reported on 12.7% of returns)
Here:
+$12,945
State:
+$16,274
(% of AGI for various income ranges: 70.7% for AGIs below $25k, 130.6% for AGIs $25k-50k, 162.6% for AGIs $50k-75k, 160.6% for AGIs $75k-100k, 483.8% for AGIs $100k-200k, 2765.0% for AGIs over 200k)
Taxable individual retirement arrangement distribution: $17,527 (reported on 12.4% of returns)
17320:
$17,527
Pennsylvania:
$18,583
(% of AGI for various income ranges: 97.3% for AGIs below $25k, 127.8% for AGIs $25k-50k, 227.2% for AGIs $50k-75k, 306.8% for AGIs $75k-100k, 635.6% for AGIs $100k-200k, 3591.7% for AGIs over 200k)
Self-employed (Keogh) retirement plans: $16,450 (reported on 0.5% of returns)
17320:
$16,450
Pennsylvania:
$25,407
(% of AGI for various income ranges: 65.8% for AGIs $50k-75k)
Total itemized deductions: $29,012 (reported on 9.6% of returns)
Here:
$29,012
State:
$34,850
(% of AGI for various income ranges: 192.6% for AGIs $25k-50k, 361.6% for AGIs $50k-75k, 453.2% for AGIs $75k-100k, 778.8% for AGIs $100k-200k, 5055.0% for AGIs over 200k)
Charity contributions: $7,411 (reported on 6.7% of returns)
Here:
$7,411
State:
$12,392
(% of AGI for various income ranges: 14.8% for AGIs $25k-50k, 43.4% for AGIs $50k-75k, 50.0% for AGIs $75k-100k, 175.8% for AGIs $100k-200k, 1178.3% for AGIs over 200k)
Taxes paid: $7,548 (reported on 9.6% of returns)
17320:
$7,548
State:
$8,200
(% of AGI for various income ranges: 42.9% for AGIs $25k-50k, 100.4% for AGIs $50k-75k, 142.1% for AGIs $75k-100k, 226.6% for AGIs $100k-200k, 1008.3% for AGIs over 200k)
Earned income credit: $1,989 (reported on 8.4% of returns)
Here:
$1,989
State:
$2,100
(% of AGI for various income ranges: 48.2% for AGIs below $25k, 49.1% for AGIs $25k-50k)
Percentage of individuals using paid preparers for their 2020 taxes: 92.1%
Here:
92%
State:
92%
(% for various income ranges: 90.0% for AGIs below $25k, 93.3% for AGIs $25k-50k, 94.1% for AGIs $50k-75k, 93.9% for AGIs $75k-100k, 90.6% for AGIs $100k-200k, 94.1% for AGIs over 200k)
Averages for the 2012 tax year for zip code 17320, filed in 2013:
Average Adjusted Gross Income (AGI) in 2012: $62,529 (Individual Income Tax Returns)
Here:
$62,529
State:
$61,346
Salary/wage: $50,610 (reported on 84.2% of returns)
Here:
$50,610
State:
$51,902
(% of AGI for various income ranges: 70.5% for AGIs below $25k, 74.4% for AGIs $25k-50k, 75.2% for AGIs $50k-75k, 76.4% for AGIs $75k-100k, 79.8% for AGIs $100k-200k, 25.8% for AGIs over 200k)
Taxable interest for individuals: $1,103 (reported on 35.9% of returns)
This zip code:
$1,103
Pennsylvania:
$1,588
(% of AGI for various income ranges: 1.8% for AGIs below $25k, 0.8% for AGIs $25k-50k, 0.3% for AGIs $50k-75k, 0.8% for AGIs $75k-100k, 0.5% for AGIs $100k-200k, 0.6% for AGIs over 200k)
Ordinary dividends: $5,968 (reported on 20.9% of returns)
Here:
$5,968
State:
$5,827
(% of AGI for various income ranges: 1.5% for AGIs below $25k, 0.9% for AGIs $25k-50k, 0.5% for AGIs $50k-75k, 0.7% for AGIs $75k-100k, 0.9% for AGIs $100k-200k, 7.7% for AGIs over 200k)
Net capital gain/loss in AGI: +$3,619 (reported on 13.5% of returns)
Here:
+$3,619
State:
+$14,495
(% of AGI for various income ranges: 0.2% for AGIs $50k-75k, 1.9% for AGIs $100k-200k, 1.3% for AGIs over 200k)
Profit/loss from business: +$12,674 (reported on 13.5% of returns)
Here:
+$12,674
State:
+$16,268
(% of AGI for various income ranges: 7.2% for AGIs below $25k, 3.1% for AGIs $25k-50k, 2.7% for AGIs $50k-75k, 2.1% for AGIs $75k-100k, 3.7% for AGIs $100k-200k)
Taxable individual retirement arrangement distribution: $10,096 (reported on 12.0% of returns)
17320:
$10,096
Pennsylvania:
$14,550
(% of AGI for various income ranges: 4.8% for AGIs below $25k, 2.4% for AGIs $25k-50k, 2.3% for AGIs $50k-75k, 1.9% for AGIs $75k-100k, 2.1% for AGIs $100k-200k)
Total itemized deductions: $21,348 (21% of AGI, reported on 42.2% of returns)
Here:
$21,348
State:
$23,538
Here:
20.9% of AGI
State:
18.4% of AGI
(% of AGI for various income ranges: 14.1% for AGIs below $25k, 13.1% for AGIs $25k-50k, 14.8% for AGIs $50k-75k, 16.9% for AGIs $75k-100k, 15.3% for AGIs $100k-200k, 11.1% for AGIs over 200k)
Charity contributions: $2,760 (reported on 30.8% of returns)
Here:
$2,760
State:
$4,025
(% of AGI for various income ranges: 0.9% for AGIs below $25k, 1.2% for AGIs $25k-50k, 1.2% for AGIs $50k-75k, 1.9% for AGIs $75k-100k, 1.6% for AGIs $100k-200k, 0.7% for AGIs over 200k)
Taxes paid: $8,119 (reported on 42.2% of returns)
17320:
$8,119
State:
$9,982
(% of AGI for various income ranges: 3.2% for AGIs below $25k, 3.8% for AGIs $25k-50k, 5.1% for AGIs $50k-75k, 6.0% for AGIs $75k-100k, 6.6% for AGIs $100k-200k, 5.5% for AGIs over 200k)
Earned income credit: $1,868 (reported on 9.7% of returns)
Here:
$1,868
State:
$2,106
(% of AGI for various income ranges: 3.4% for AGIs below $25k, 0.7% for AGIs $25k-50k)
Percentage of individuals using paid preparers for their 2012 taxes: 50.9%
Here:
51%
State:
53%
(% for various income ranges: 44.8% for AGIs below $25k, 50.6% for AGIs $25k-50k, 55.9% for AGIs $50k-75k, 55.1% for AGIs $75k-100k, 51.7% for AGIs $100k-200k, 83.3% for AGIs over 200k)
Averages for the 2004 tax year for zip code 17320, filed in 2005:
Average Adjusted Gross Income (AGI) in 2004: $46,522 (Individual Income Tax Returns)
Here:
$46,522
State:
$48,049
Salary/wage: $43,136 (reported on 85.1% of returns)
Here:
$43,136
State:
$42,646
(% of AGI for various income ranges: 115.3% for AGIs below $10k, 70.9% for AGIs $10k-25k, 77.2% for AGIs $25k-50k, 81.2% for AGIs $50k-75k, 84.6% for AGIs $75k-100k, 74.1% for AGIs over 100k)
Taxable interest for individuals: $1,146 (reported on 53.7% of returns)
This zip code:
$1,146
Pennsylvania:
$1,657
(% of AGI for various income ranges: 8.2% for AGIs below $10k, 2.5% for AGIs $10k-25k, 1.3% for AGIs $25k-50k, 1.2% for AGIs $50k-75k, 0.5% for AGIs $75k-100k, 1.4% for AGIs over 100k)
Taxable dividends: $1,806 (reported on 24.4% of returns)
Here:
$1,806
State:
$3,566
(% of AGI for various income ranges: 6.0% for AGIs below $10k, 1.6% for AGIs $10k-25k, 1.0% for AGIs $25k-50k, 0.7% for AGIs $50k-75k, 0.5% for AGIs $75k-100k, 1.2% for AGIs over 100k)
Net capital gain/loss: +$5,954 (reported on 17.3% of returns)
Here:
+$5,954
State:
+$9,716
(% of AGI for various income ranges: -2.5% for AGIs below $10k, -0.3% for AGIs $10k-25k, 0.9% for AGIs $25k-50k, 0.7% for AGIs $50k-75k, 1.1% for AGIs $75k-100k, 6.6% for AGIs over 100k)
Profit/loss from business: +$9,171 (reported on 17.0% of returns)
Here:
+$9,171
State:
+$14,267
(% of AGI for various income ranges: 8.2% for AGIs below $10k, 7.0% for AGIs $10k-25k, 4.6% for AGIs $25k-50k, 2.5% for AGIs $50k-75k, 1.6% for AGIs $75k-100k, 3.4% for AGIs over 100k)
IRA payment deduction: $3,079 (reported on 3.7% of returns)
17320:
$3,079
Pennsylvania:
$2,903
(% of AGI for various income ranges: 0.2% for AGIs $10k-25k, 0.5% for AGIs $25k-50k, 0.2% for AGIs $50k-75k, 0.1% for AGIs $75k-100k, 0.2% for AGIs over 100k)
Self-employed pension: $5,261 (reported on 0.6% of returns)
Here:
$5,261
Pennsylvania:
$14,674
Total itemized deductions: $15,955 (22% of AGI, reported on 44.6% of returns)
Here:
$15,955
State:
$18,804
Here:
22.5% of AGI
State:
19.5% of AGI
(% of AGI for various income ranges: 12.9% for AGIs below $10k, 12.1% for AGIs $10k-25k, 15.4% for AGIs $25k-50k, 15.7% for AGIs $50k-75k, 16.1% for AGIs $75k-100k, 15.2% for AGIs over 100k)
Charity contributions deductions: $2,189 (3% of AGI, reported on 37.4% of returns)
Here:
$2,189
State:
$3,337
Here:
3.0% of AGI
State:
3.3% of AGI
(% of AGI for various income ranges: 0.8% for AGIs below $10k, 1.3% for AGIs $10k-25k, 1.7% for AGIs $25k-50k, 1.6% for AGIs $50k-75k, 1.6% for AGIs $75k-100k, 2.3% for AGIs over 100k)
Total tax: $5,706 (reported on 80.7% of returns)
17320:
$5,706
State:
$8,008
(% of AGI for various income ranges: 3.7% for AGIs below $10k, 4.9% for AGIs $10k-25k, 7.1% for AGIs $25k-50k, 8.5% for AGIs $50k-75k, 10.3% for AGIs $75k-100k, 14.9% for AGIs over 100k)
Earned income credit: $1,481 (reported on 8.4% of returns)
Here:
$1,481
State:
$1,643
Percentage of individuals using paid preparers for their 2004 taxes: 55.6%
Here:
56%
State:
56%
(% for various income ranges: 46.2% for AGIs below $10k, 55.2% for AGIs $10k-25k, 59.6% for AGIs $25k-50k, 60.0% for AGIs $50k-75k, 55.6% for AGIs $75k-100k, 53.2% for AGIs over 100k)
Likely homosexual households (counted as self-reported same-sex unmarried-partner households)
Lesbian couples: 0.2% of all households
Gay men: 0.0% of all households
Household received Food Stamps/SNAP in the past 12 months: 174 Household did not receive Food Stamps/SNAP in the past 12 months: 2,985
Women who had a birth in the past 12 months: 80 (86 now married, 0 unmarried) Women who did not have a birth in the past 12 months: 1,498 (887 now married, 600 unmarried)
Housing units in zip code 17320 with a mortgage: 2,085 (386 second mortgage, 338 both second mortgage and home equity loan) Houses without a mortgage: 146
Median monthly owner costs for units with a mortgage: $1,679 Median monthly owner costs for units without a mortgage: $595
Residents with income below the poverty level in 2022:
This zip code:
8.9%
Whole state:
11.8%
Residents with income below 50% of the poverty level in 2022:
This zip code:
2.8%
Whole state:
6.1%
Median number of rooms in houses and condos:
Here:
7.3
State:
6.8
Median number of rooms in apartments:
Here:
5.6
State:
4.3
Notable locations in this zip code not listed on our city pages
Notable locations in zip code 17320: Carroll Valley Resort Golf Course (A), Ski Liberty Ski Area (B), Fairfield Station (C), Fairfield Library (D), Fairfield Fire and Emergency Medical Services (E), Fountaindale Volunteer Fire Department (F), Fountaindale Volunteer Fire Company (G). Display/hide their locations on the map
Streams, rivers, and creeks: Swamp Creek (A), Hayes Run (B), Miney Branch (C), Friends Creek (D), Spring Run (E), Copper Run (F). Display/hide their locations on the map
In group quarters: 54 (-1 institutionalized population)
Size of family households: 1,031 2-persons, 484 3-persons, 413 4-persons, 223 5-persons, 81 6-persons, 18 7-or-more-persons
Size of nonfamily households: 754 1-person, 136 2-persons, 18 4-persons
1,139 married couples with children.
219 single-parent households (150 men, 69 women).
96.5% of residents of 17320 zip code speak English at home.
1.9% of residents speak Spanish at home (50% very well, 33% well, 15% not well, 1% not at all).
0.8% of residents speak other Indo-European language at home (85% very well, 3% well, 11% not at all).
0.4% of residents speak Asian or Pacific Island language at home (100% very well).
0.1% of residents speak other language at home (100% very well).
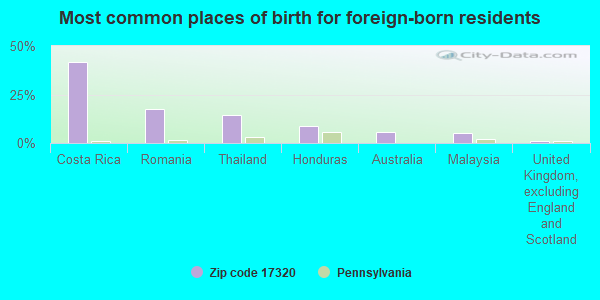
Foreign born population: 160 (2.0%) (65.2% of them are naturalized citizens)
This zip code:
2.0%
Whole state:
7.5%
42%Costa Rica
18%Romania
14%Thailand
9%Honduras
6%Australia
5%Malaysia
1%United Kingdom, excluding England and Scotland
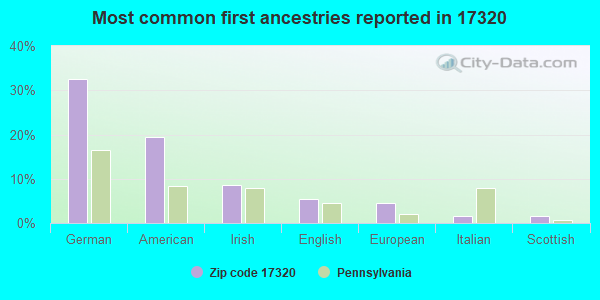
33%German
19%American
9%Irish
6%English
4%European
2%Italian
2%Scottish
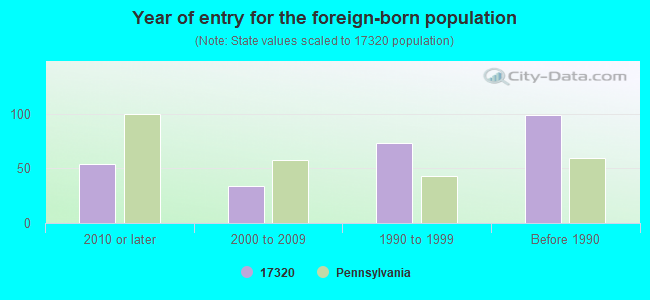
Year of entry for the foreign-born population
542010 or later
342000 to 2009
731990 to 1999
99Before 1990
Facilities with environmental interests located in this zip code:
BLUE RIDGE SPORTSMENS CLUB (3009 WAYNESBORO PIKE in FAIRFIELD, PA)
STATE MASTER (Pennsylvania database) - PCS-PA0086444, National Pollutant Discharge Elimination System Permit, PWSID-7010902, DRINKING WATER PROGRAM National Pollutant Discharge Elimination System NON-MAJOR (Tracking pollutant discharge elimination systems) - permit Business SIC classification: MEMBERSHIP SPORTS AND RECREATION CLUBS Alternative names: BLUE RIDGE SPORTMAN ASSOCIATIO, BLUE RIDGE SPORTSMAN ASSOC
ANDREW AND DAWN SNYDER (164 CRUM ROAD in FAIRFIELD, PA)
National Pollutant Discharge Elimination System NON-MAJOR (Tracking pollutant discharge elimination systems) - permit Business SIC classification: OPERATORS OF DWELLINGS OTHER THAN APARTMENT BUILDINGS Alternative names: SNYDER, ANDREW & DAWN
Housing units lacking complete plumbing facilities: 0.8% Housing units lacking complete kitchen facilities: 2.2%
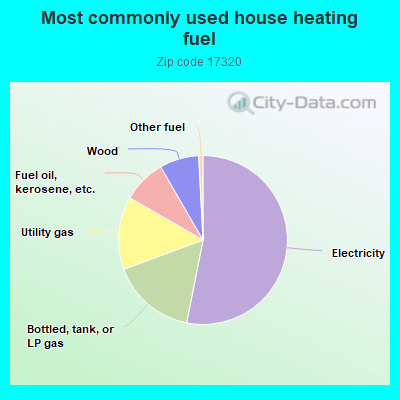
52.9%Electricity
16.2%Bottled, tank, or LP gas
13.9%Utility gas
8.3%Fuel oil, kerosene, etc.
7.5%Wood
0.8%Other fuel
Population in 1990: 4,709. Population change in the 1990s: +2,229 (+47.3%).
Place of birth for U.S.-born residents:
This state: 3,930
Northeast: 572
Midwest: 259
South: 3,120
West: 104
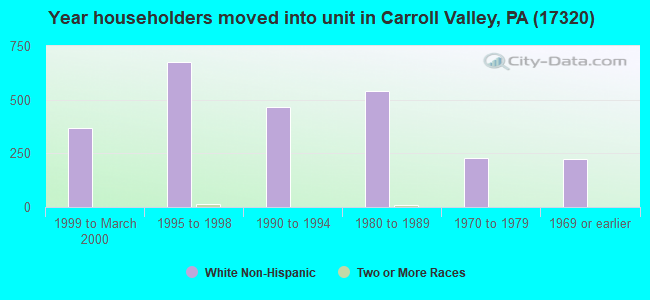
63% of the 17320 zip code residents lived in the same house 5 years ago. Out of people who lived in different houses, 34% lived in this county. Out of people who lived in different counties, 50% lived in Pennsylvania.
95% of the 17320 zip code residents lived in the same house 1 year ago. Out of people who lived in different houses, 44% moved from this county. Out of people who lived in different houses, 6% moved from different county within same state. Out of people who lived in different houses, 55% moved from different state. Out of people who lived in different houses, 1% moved from abroad.
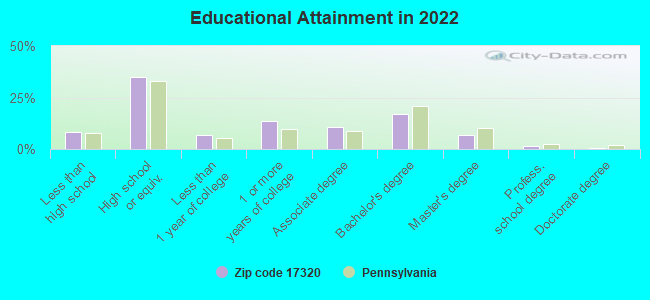
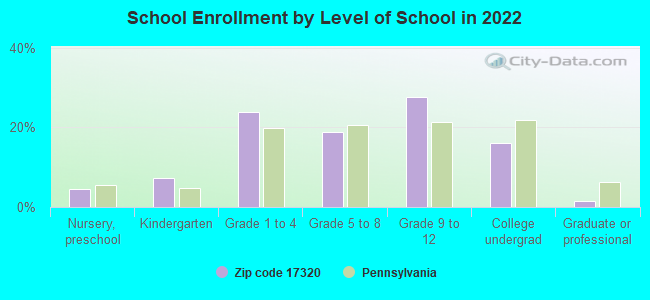
Private vs. public school enrollment:
Students in private schools in grades 1 to 8 (elementary and middle school): 112
Here:
19.3%
Pennsylvania:
15.7%
Students in private schools in grades 9 to 12 (high school): 45
Here:
12.1%
Pennsylvania:
13.4%
Students in private undergraduate colleges: 67
Here:
30.8%
Pennsylvania:
39.8%
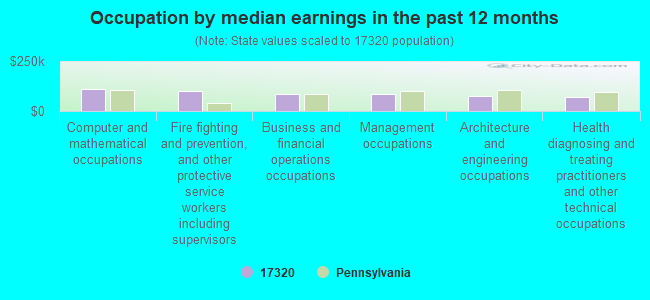
Occupation by median earnings in the past 12 months ($)
111,621Computer and mathematical occupations
99,761Fire fighting and prevention, and other protective service workers including supervisors
86,353Business and financial operations occupations
83,869Management occupations
75,163Architecture and engineering occupations
72,516Health diagnosing and treating practitioners and other technical occupations
Companies with federal contracts located in this zip code:
FAIRFIELD CONSULTANT ASSOC (2 SNOW TRL in FAIRFIELD, PA; small business) : $28,000 in 2 contractsin 2000
$28,000 with Army for Other Medical Services. Taking place in MD. Signed on 2000-05-30. Completion date: 2000-05-31.
$0, same as above.Signed on 2000-05-30. Completion date: 2000-05-31.
A SCOTT CHESNICK (8 CHAMPION TRAIL in FAIRFIELD, PA; small business) : $11,200 in 4 contractsfrom 2004 to 2006
$5,600 with Army for Other Medical Services. Signed on 2004-05-20. Completion date: 2005-04-24.
$2,800, same as above.Signed on 2006-04-14. Completion date: 2005-04-24.
$2,800, same as above.Signed on 2005-05-04. Completion date: 2005-04-24.
$0, same as above.Signed on 2004-05-20. Completion date: 2005-04-24.
Top industries in this zip code by the number of employees in 2005:
Accommodation and Food Services: Hotels (except Casino Hotels) and Motels (500-999 employees: 1 establishment, 10-19 employees: 1 establishment)
Accommodation and Food Services: Full-Service Restaurants (20-49: 3, 10-19: 2)
Other Services (except Public Administration): Civic and Social Organizations (20-49: 1, 5-9: 1)
Arts, Entertainment, and Recreation: Golf Courses and Country Clubs (20-49: 1, 5-9: 1)
Professional, Scientific, and Technical Services: All Other Professional, Scientific, and Technical Services (20-49: 1, 1-4: 1)
Construction: Drywall and Insulation Contractors (20-49: 1)
Construction: New Single-Family Housing Construction (except Operative Builders) (5-9: 3, 1-4: 2)
People in group quarters in 2010:
36 people in group homes intended for adults
11 people in workers' group living quarters and job corps centers
People in group quarters in 2000:
59 people in other noninstitutional group quarters
3 people in agriculture workers' dormitories on farms
Fatal accident statistics in 2014:
Fatal accident count: 1
Vehicles involved in fatal accidents: 1
Fatal accidents caused by drunken drivers: 0
Fatalities: 1
Persons involved in fatal accidents: 1
Pedestrians involved in fatal accidents: 0
Fatal accident statistics in 2013:
Fatal accident count: 1
Vehicles involved in fatal accidents: 2
Fatal accidents caused by drunken drivers: 1
Fatalities: 1
Persons involved in fatal accidents: 1
Pedestrians involved in fatal accidents: 1
2004 - 2018 National Fire Incident Reporting System (NFIRS) incidents
Based on the data from the years 2004 - 2018 the average number of fires per year is 20. The highest number of fires - 36 took place in 2011, and the least - 3 in 2014. The data has a rising trend.
When looking into fire subcategories, the most incidents belonged to: Structure Fires (61.3%), and Outside Fires (26.9%).
Fire incident types reported to NFIRS in Zip Code 17320
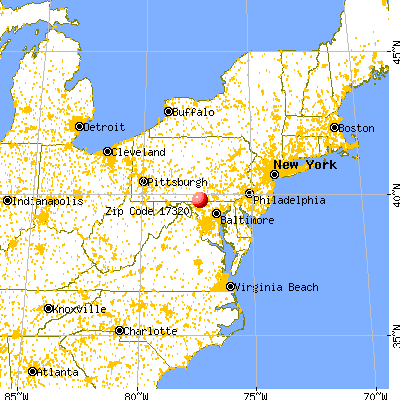


 Nearest zip codes: 17214, 21727, 17343, 17353, 21780, 21719.


 Based on the data from the years 2004 - 2018 the average number of fires per year is 20. The highest number of fires - 36 took place in 2011, and the least - 3 in 2014. The data has a rising trend.
 When looking into fire subcategories, the most incidents belonged to: Structure Fires (61.3%), and Outside Fires (26.9%).