Estimated zip code population in 2022: 1,968 Zip code population in 2010: 1,947 Zip code population in 2000: 2,079
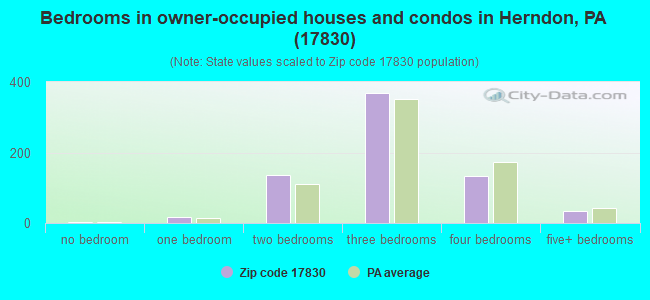
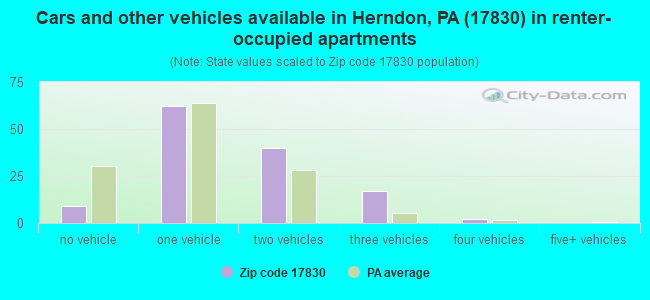
Houses and condos: 1,035 Renter-occupied apartments: 129
% of renters here:
16%
State:
31%
March 2022 cost of living index in zip code 17830: 90.9 (less than average, U.S. average is 100)
Land area: 30.6 sq. mi. Water area: 2.6 sq. mi.
Population density: 64 people per square mile
(very low).
OSM Map
General Map
Google Map
MSN Map
OSM Map
General Map
Google Map
MSN Map
OSM Map
General Map
Google Map
MSN Map
OSM Map
General Map
Google Map
MSN Map
Please wait while loading the map...
Real estate property taxes paid for housing units in 2022:
This zip code:
1.2% ($2,232)
Pennsylvania:
1.3% ($3,094)
Median real estate property taxes paid for housing units with mortgages in 2022: $2,044 (1.0%) Median real estate property taxes paid for housing units with no mortgage in 2022: $2,364 (1.4%)
Business Search- 14 Million verified businesses
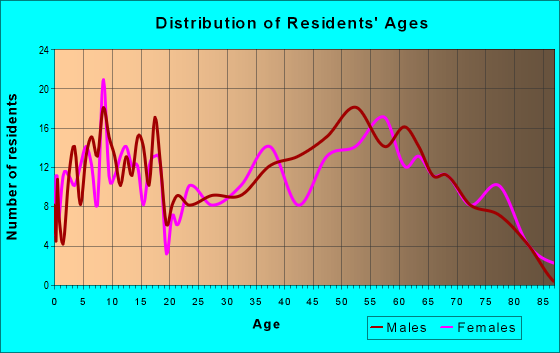
Males: 1,001
(50.9%)
Females: 967
(49.1%)
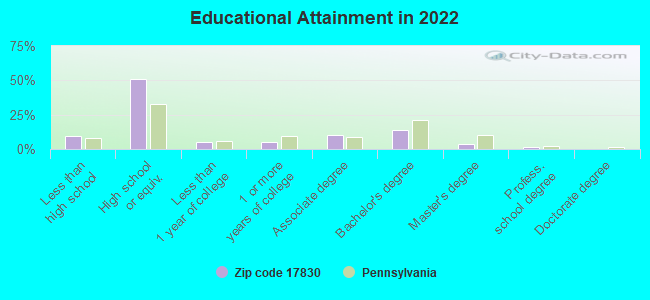
For population 25 years and over in 17830:
High school or higher: 89.5%
Bachelor's degree or higher: 19.4%
Graduate or professional degree: 5.5%
Unemployed: 1.5%
Mean travel time to work (commute): 28.6 minutes
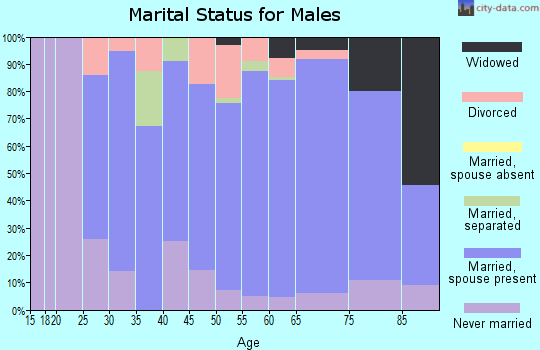
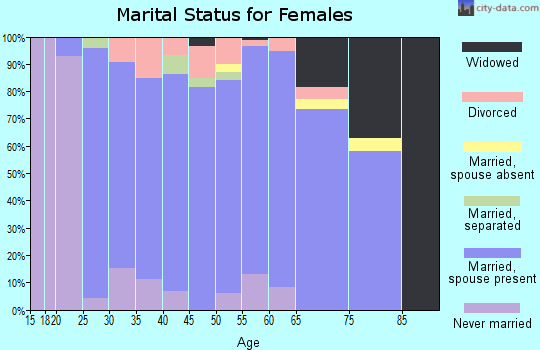
For population 15 years and over in 17830:
Never married: 24.1%
Now married: 63.3%
Separated: 0.6%
Widowed: 4.8%
Divorced: 7.1%
Zip code 17830 compared to state average:
Unemployed percentage below state average.
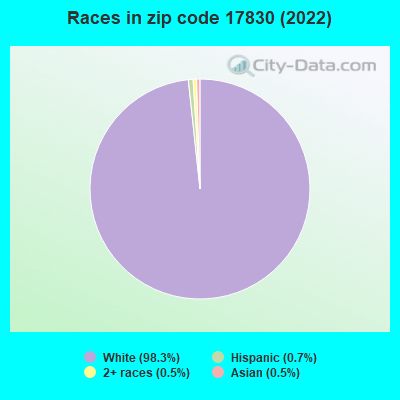
Black race population percentage significantly below state average.
Hispanic race population percentage significantly below state average.
Median age above state average.
Foreign-born population percentage significantly below state average.
Renting percentage below state average.
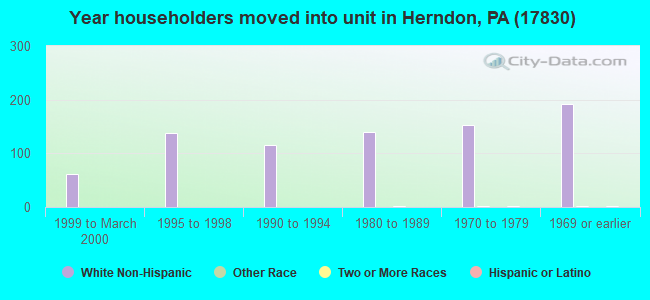
Length of stay since moving in significantly above state average.
Percentage of population with a bachelor's degree or higher below state average.
Averages for the 2020 tax year for zip code 17830, filed in 2021:
Average Adjusted Gross Income (AGI) in 2020: $56,466 (Individual Income Tax Returns)
Here:
$56,466
State:
$75,707
Salary/wage: $47,765 (reported on 78.3% of returns)
Here:
$47,765
State:
$62,806
(% of AGI for various income ranges: 1133.2% for AGIs below $25k, 4009.0% for AGIs $25k-50k, 6895.8% for AGIs $50k-75k, 9351.4% for AGIs $75k-100k, 13922.5% for AGIs $100k-200k)
Taxable interest for individuals: $1,630 (reported on 34.9% of returns)
This zip code:
$1,630
Pennsylvania:
$1,633
(% of AGI for various income ranges: 36.8% for AGIs below $25k, 33.0% for AGIs $25k-50k, 67.5% for AGIs $50k-75k, 34.3% for AGIs $75k-100k, 70.0% for AGIs $100k-200k)
Ordinary dividends: $5,680 (reported on 18.9% of returns)
Here:
$5,680
State:
$7,382
(% of AGI for various income ranges: 27.4% for AGIs below $25k, 45.5% for AGIs $25k-50k, 145.8% for AGIs $50k-75k, 34.3% for AGIs $75k-100k, 37.5% for AGIs $100k-200k)
Net capital gain/loss in AGI: +$12,053 (reported on 14.2% of returns)
Here:
+$12,053
State:
+$23,522
(% of AGI for various income ranges: 32.6% for AGIs below $25k, 221.7% for AGIs $50k-75k, 287.5% for AGIs $100k-200k)
Profit/loss from business: +$21,113 (reported on 14.2% of returns)
Here:
+$21,113
State:
+$16,274
(% of AGI for various income ranges: 176.8% for AGIs below $25k, 109.0% for AGIs $25k-50k, 613.3% for AGIs $50k-75k, 2346.2% for AGIs $100k-200k)
Taxable individual retirement arrangement distribution: $11,123 (reported on 12.3% of returns)
17830:
$11,123
Pennsylvania:
$18,583
(% of AGI for various income ranges: 118.9% for AGIs below $25k, 122.5% for AGIs $25k-50k, 244.2% for AGIs $50k-75k, 974.3% for AGIs $75k-100k)
Total itemized deductions: $28,925 (reported on 3.8% of returns)
Here:
$28,925
State:
$34,850
(% of AGI for various income ranges: 1446.2% for AGIs $100k-200k)
Charity contributions: $9,333 (reported on 2.8% of returns)
Here:
$9,333
State:
$12,392
(% of AGI for various income ranges: 400.0% for AGIs $75k-100k)
Taxes paid: $6,825 (reported on 3.8% of returns)
17830:
$6,825
State:
$8,200
(% of AGI for various income ranges: 341.2% for AGIs $100k-200k)
Earned income credit: $2,109 (reported on 10.4% of returns)
Here:
$2,109
State:
$2,100
(% of AGI for various income ranges: 65.3% for AGIs below $25k, 54.0% for AGIs $25k-50k)
Percentage of individuals using paid preparers for their 2020 taxes: 91.5%
Here:
92%
State:
92%
(% for various income ranges: 91.4% for AGIs below $25k, 92.6% for AGIs $25k-50k, 94.4% for AGIs $50k-75k, 90.9% for AGIs $75k-100k, 91.7% for AGIs $100k-200k, 66.7% for AGIs over 200k)
Averages for the 2012 tax year for zip code 17830, filed in 2013:
Average Adjusted Gross Income (AGI) in 2012: $47,962 (Individual Income Tax Returns)
Here:
$47,962
State:
$61,346
Salary/wage: $40,849 (reported on 81.1% of returns)
Here:
$40,849
State:
$51,902
(% of AGI for various income ranges: 62.5% for AGIs below $25k, 75.5% for AGIs $25k-50k, 77.1% for AGIs $50k-75k, 75.5% for AGIs $75k-100k, 54.5% for AGIs $100k-200k)
Taxable interest for individuals: $982 (reported on 42.1% of returns)
This zip code:
$982
Pennsylvania:
$1,588
(% of AGI for various income ranges: 2.7% for AGIs below $25k, 0.8% for AGIs $25k-50k, 0.4% for AGIs $50k-75k, 0.3% for AGIs $75k-100k, 1.0% for AGIs $100k-200k)
Ordinary dividends: $2,330 (reported on 21.1% of returns)
Here:
$2,330
State:
$5,827
(% of AGI for various income ranges: 3.0% for AGIs below $25k, 1.4% for AGIs $25k-50k, 0.3% for AGIs $50k-75k, 1.2% for AGIs $75k-100k, 0.6% for AGIs $100k-200k)
Net capital gain/loss in AGI: +$2,273 (reported on 11.6% of returns)
Here:
+$2,273
State:
+$14,495
(% of AGI for various income ranges: 0.2% for AGIs below $25k, 0.2% for AGIs $25k-50k, 1.9% for AGIs $100k-200k)
Profit/loss from business: +$12,256 (reported on 16.8% of returns)
Here:
+$12,256
State:
+$16,268
(% of AGI for various income ranges: 6.3% for AGIs below $25k, 4.8% for AGIs $25k-50k, 5.1% for AGIs $50k-75k, 8.3% for AGIs $75k-100k)
Taxable individual retirement arrangement distribution: $7,683 (reported on 12.6% of returns)
17830:
$7,683
Pennsylvania:
$14,550
(% of AGI for various income ranges: 5.8% for AGIs below $25k, 3.8% for AGIs $25k-50k, 2.8% for AGIs $50k-75k)
Total itemized deductions: $16,790 (19% of AGI, reported on 22.1% of returns)
Here:
$16,790
State:
$23,538
Here:
18.5% of AGI
State:
18.4% of AGI
(% of AGI for various income ranges: 8.3% for AGIs $25k-50k, 7.6% for AGIs $50k-75k, 8.9% for AGIs $75k-100k, 9.3% for AGIs $100k-200k)
Charity contributions: $3,085 (reported on 13.7% of returns)
Here:
$3,085
State:
$4,025
(% of AGI for various income ranges: 0.6% for AGIs $25k-50k, 0.8% for AGIs $50k-75k, 0.8% for AGIs $75k-100k, 1.5% for AGIs $100k-200k)
Taxes paid: $6,162 (reported on 22.1% of returns)
17830:
$6,162
State:
$9,982
(% of AGI for various income ranges: 2.0% for AGIs $25k-50k, 2.4% for AGIs $50k-75k, 3.1% for AGIs $75k-100k, 4.7% for AGIs $100k-200k)
Earned income credit: $1,950 (reported on 12.6% of returns)
Here:
$1,950
State:
$2,106
(% of AGI for various income ranges: 4.0% for AGIs below $25k, 0.7% for AGIs $25k-50k)
Percentage of individuals using paid preparers for their 2012 taxes: 66.3%
Here:
66%
State:
53%
(% for various income ranges: 61.8% for AGIs below $25k, 65.4% for AGIs $25k-50k, 68.4% for AGIs $50k-75k, 77.8% for AGIs $75k-100k, 71.4% for AGIs $100k-200k)
Averages for the 2004 tax year for zip code 17830, filed in 2005:
Average Adjusted Gross Income (AGI) in 2004: $37,450 (Individual Income Tax Returns)
Here:
$37,450
State:
$48,049
Salary/wage: $34,586 (reported on 85.2% of returns)
Here:
$34,586
State:
$42,646
(% of AGI for various income ranges: 103.2% for AGIs below $10k, 73.5% for AGIs $10k-25k, 80.4% for AGIs $25k-50k, 87.4% for AGIs $50k-75k, 88.7% for AGIs $75k-100k, 44.9% for AGIs over 100k)
Taxable interest for individuals: $1,351 (reported on 50.9% of returns)
This zip code:
$1,351
Pennsylvania:
$1,657
(% of AGI for various income ranges: 10.7% for AGIs below $10k, 3.6% for AGIs $10k-25k, 1.7% for AGIs $25k-50k, 0.4% for AGIs $50k-75k, 0.3% for AGIs $75k-100k, 4.6% for AGIs over 100k)
Taxable dividends: $3,655 (reported on 25.0% of returns)
Here:
$3,655
State:
$3,566
(% of AGI for various income ranges: 8.1% for AGIs below $10k, 3.8% for AGIs $10k-25k, 1.2% for AGIs $25k-50k, 0.1% for AGIs $50k-75k, 0.4% for AGIs $75k-100k, 11.1% for AGIs over 100k)
Net capital gain/loss: +$4,494 (reported on 16.4% of returns)
Here:
+$4,494
State:
+$9,716
(% of AGI for various income ranges: 1.5% for AGIs below $10k, -0.1% for AGIs $10k-25k, 0.2% for AGIs $25k-50k, 0.0% for AGIs $50k-75k, 0.3% for AGIs $75k-100k, 14.2% for AGIs over 100k)
Profit/loss from business: +$9,382 (reported on 17.4% of returns)
Here:
+$9,382
State:
+$14,267
(% of AGI for various income ranges: 10.2% for AGIs below $10k, 5.4% for AGIs $10k-25k, 6.4% for AGIs $25k-50k, 3.4% for AGIs $50k-75k, 4.7% for AGIs $75k-100k)
IRA payment deduction: $2,436 (reported on 4.1% of returns)
17830:
$2,436
Pennsylvania:
$2,903
Total itemized deductions: $13,872 (22% of AGI, reported on 20.6% of returns)
Here:
$13,872
State:
$18,804
Here:
21.9% of AGI
State:
19.5% of AGI
(% of AGI for various income ranges: 6.4% for AGIs $10k-25k, 6.8% for AGIs $25k-50k, 8.3% for AGIs $50k-75k, 11.3% for AGIs $75k-100k, 6.3% for AGIs over 100k)
Charity contributions deductions: $2,329 (4% of AGI, reported on 15.7% of returns)
Here:
$2,329
State:
$3,337
Here:
3.5% of AGI
State:
3.3% of AGI
(% of AGI for various income ranges: 1.1% for AGIs below $10k, 0.9% for AGIs $25k-50k, 1.0% for AGIs $50k-75k, 1.3% for AGIs $75k-100k, 1.6% for AGIs over 100k)
Total tax: $4,281 (reported on 80.0% of returns)
17830:
$4,281
State:
$8,008
(% of AGI for various income ranges: 5.5% for AGIs below $10k, 4.6% for AGIs $10k-25k, 7.3% for AGIs $25k-50k, 8.6% for AGIs $50k-75k, 10.7% for AGIs $75k-100k, 17.3% for AGIs over 100k)
Earned income credit: $1,261 (reported on 9.3% of returns)
Here:
$1,261
State:
$1,643
Percentage of individuals using paid preparers for their 2004 taxes: 63.9%
Here:
64%
State:
56%
(% for various income ranges: 58.0% for AGIs below $10k, 61.1% for AGIs $10k-25k, 67.7% for AGIs $25k-50k, 65.6% for AGIs $50k-75k, 67.9% for AGIs $75k-100k, 65.4% for AGIs over 100k)
Household received Food Stamps/SNAP in the past 12 months: 56 Household did not receive Food Stamps/SNAP in the past 12 months: 763
Women who had a birth in the past 12 months: 28 (21 now married, 6 unmarried) Women who did not have a birth in the past 12 months: 394 (197 now married, 195 unmarried)
Housing units in zip code 17830 with a mortgage: 337 (33 second mortgage, 23 both second mortgage and home equity loan) Houses without a mortgage: 14
Median monthly owner costs for units with a mortgage: $1,162 Median monthly owner costs for units without a mortgage: $494
Residents with income below the poverty level in 2022:
This zip code:
8.4%
Whole state:
11.8%
Residents with income below 50% of the poverty level in 2022:
This zip code:
4.1%
Whole state:
6.1%
Median number of rooms in houses and condos:
Here:
6.7
State:
6.8
Median number of rooms in apartments:
Here:
5.5
State:
4.3
Notable locations in this zip code not listed on our city pages
Notable locations in zip code 17830: Camp Meeting Grove (A), Burd-Roger Memorial Home (B), Herndon Fire Company 1 Station 63 (C). Display/hide their locations on the map
Churches in zip code 17830 include: Grace Community Church (A), Saint Pauls Church (B), Peifers Church (C), Seibert Church (D), Emmanuel Church (E), Zion Church (F). Display/hide their locations on the map
Size of family households: 330 2-persons, 108 3-persons, 82 4-persons, 25 5-persons, 15 6-persons, 16 7-or-more-persons
Size of nonfamily households: 193 1-person, 50 2-persons
290 married couples with children.
25 single-parent households (1 men, 24 women).
94.1% of residents of 17830 zip code speak English at home.
0.7% of residents speak Spanish at home (92% very well, 8% not well).
4.9% of residents speak other Indo-European language at home (88% very well, 9% well, 3% not at all).
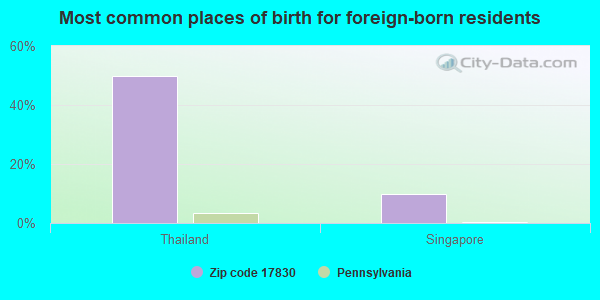
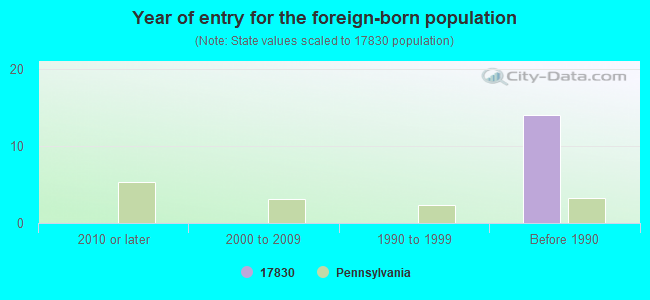
Foreign born population: 10 (0.5%) (70.8% of them are naturalized citizens)
This zip code:
0.5%
Whole state:
7.5%
50%Thailand
10%Singapore
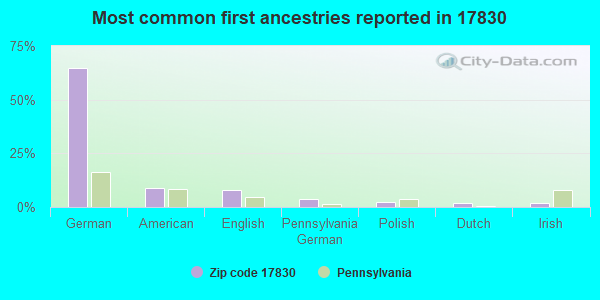
65%German
9%American
8%English
4%Pennsylvania German
2%Polish
2%Dutch
2%Irish
Year of entry for the foreign-born population
02010 or later
02000 to 2009
01990 to 1999
14Before 1990
Housing units lacking complete plumbing facilities: 6.6% Housing units lacking complete kitchen facilities: 4.8%
46.6%Fuel oil, kerosene, etc.
24.7%Electricity
10.1%Bottled, tank, or LP gas
9.4%Coal or coke
7.1%Wood
1.7%Other fuel
Population in 1990: 2,089.
Place of birth for U.S.-born residents:
This state: 1,782
Northeast: 52
Midwest: 22
South: 59
West: 19
73% of the 17830 zip code residents lived in the same house 5 years ago. Out of people who lived in different houses, 62% lived in this county. Out of people who lived in different counties, 50% lived in Pennsylvania.
94% of the 17830 zip code residents lived in the same house 1 year ago. Out of people who lived in different houses, 67% moved from this county. Out of people who lived in different houses, 25% moved from different county within same state. Out of people who lived in different houses, 9% moved from different state.
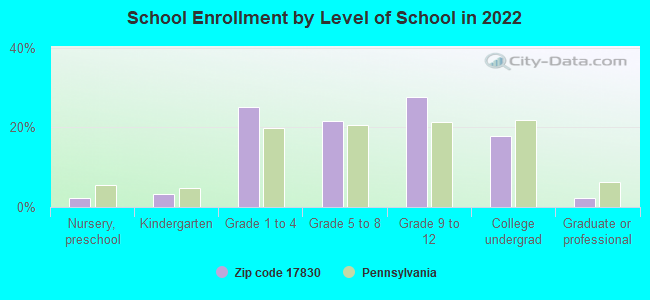
Private vs. public school enrollment:
Students in private schools in grades 1 to 8 (elementary and middle school): 63
Here:
40.8%
Pennsylvania:
15.7%
Students in private schools in grades 9 to 12 (high school): 13
Here:
14.5%
Pennsylvania:
13.4%
Students in private undergraduate colleges: 2
Here:
3.4%
Pennsylvania:
39.8%
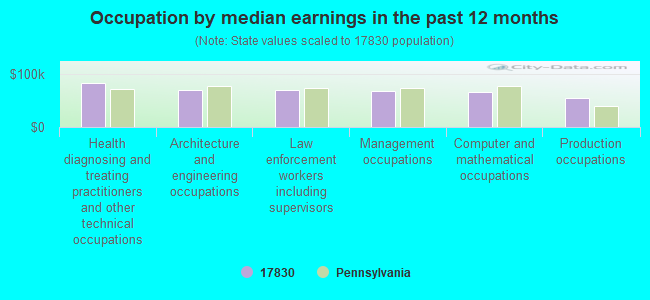
Occupation by median earnings in the past 12 months ($)
83,578Health diagnosing and treating practitioners and other technical occupations
71,082Architecture and engineering occupations
70,622Law enforcement workers including supervisors
68,074Management occupations
65,781Computer and mathematical occupations
55,916Production occupations
Top industries in this zip code by the number of employees in 2005:
Mining: Crushed and Broken Limestone Mining and Quarrying (50-99 employees: 1 establishment, 1-4 employees: 1 establishment)
Accommodation and Food Services: Full-Service Restaurants (20-49: 1, 1-4: 1)
Accommodation and Food Services: Limited-Service Restaurants (10-19: 1, 1-4: 1)
Construction: Plumbing, Heating, and Air-Conditioning Contractors (10-19: 1, 1-4: 1)
Finance and Insurance: Commercial Banking (10-19: 1)
Professional, Scientific, and Technical Services: Veterinary Services (10-19: 1)
2004 - 2018 National Fire Incident Reporting System (NFIRS) incidents
Based on the data from the years 2004 - 2018 the average number of fire incidents per year is 9. The highest number of reported fires - 23 took place in 2015, and the least - 0 in 2010. The data has an increasing trend.
When looking into fire subcategories, the most reports belonged to: Structure Fires (68.0%), and Outside Fires (18.8%).
Fire incident types reported to NFIRS in Zip Code 17830
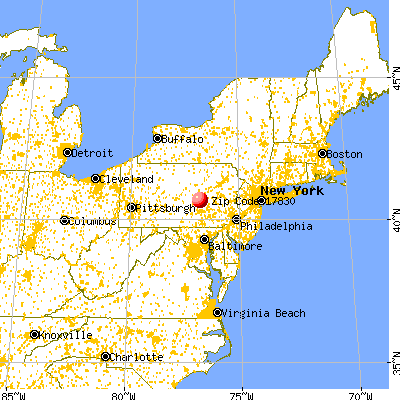


 Nearest zip codes: 17080, 17823, 17005, 17017, 17864, 17023.


 Based on the data from the years 2004 - 2018 the average number of fire incidents per year is 9. The highest number of reported fires - 23 took place in 2015, and the least - 0 in 2010. The data has an increasing trend.
 When looking into fire subcategories, the most reports belonged to: Structure Fires (68.0%), and Outside Fires (18.8%).