Estimated zip code population in 2022: 2,398 Zip code population in 2010: 2,445 Zip code population in 2000: 2,506
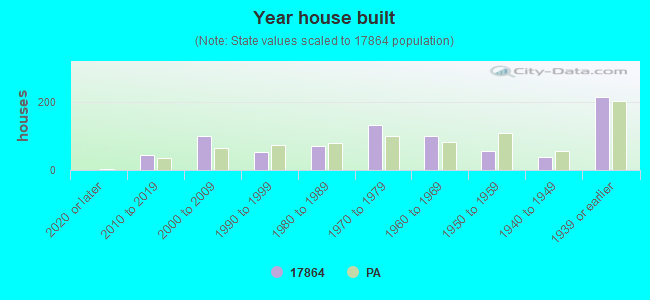
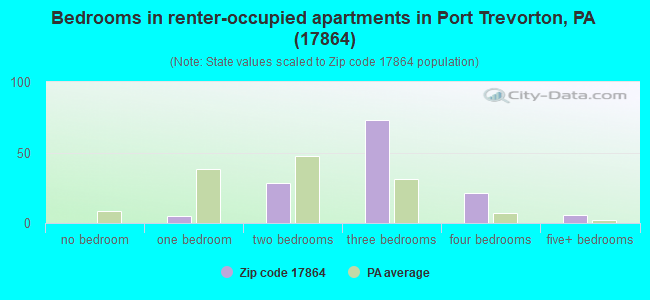
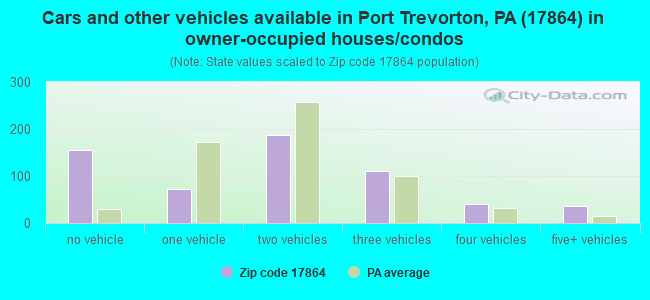
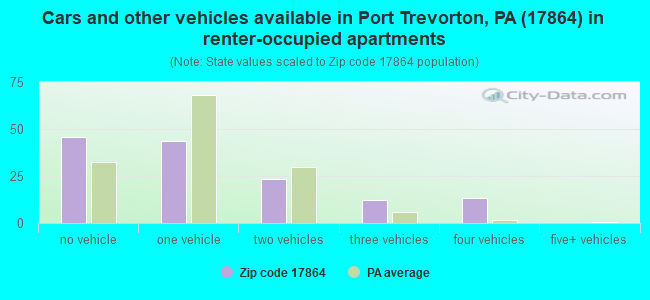
Houses and condos: 803 Renter-occupied apartments: 139
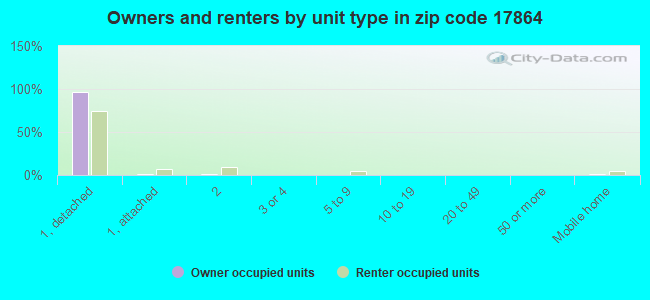
% of renters here:
19%
State:
31%
March 2022 cost of living index in zip code 17864: 92.0 (less than average, U.S. average is 100)
Land area: 20.0 sq. mi. Water area: 0.0 sq. mi.
Population density: 120 people per square mile
(very low).
OSM Map
General Map
Google Map
MSN Map
OSM Map
General Map
Google Map
MSN Map
OSM Map
General Map
Google Map
MSN Map
OSM Map
General Map
Google Map
MSN Map
Please wait while loading the map...
Real estate property taxes paid for housing units in 2022:
This zip code:
0.9% ($2,076)
Pennsylvania:
1.3% ($3,094)
Median real estate property taxes paid for housing units with mortgages in 2022: $1,733 (0.8%) Median real estate property taxes paid for housing units with no mortgage in 2022: $2,345 (1.0%)
Business Search- 14 Million verified businesses
Males: 1,288
(53.7%)
Females: 1,109
(46.3%)
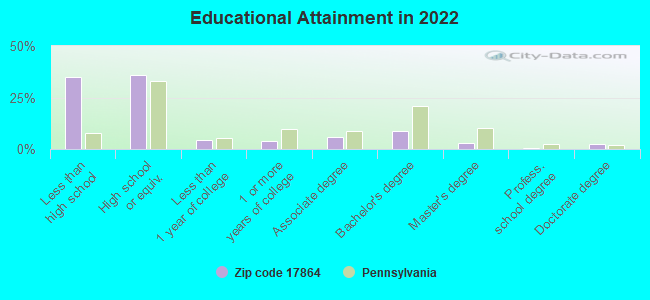
For population 25 years and over in 17864:
High school or higher: 61.8%
Bachelor's degree or higher: 13.9%
Graduate or professional degree: 5.3%
Unemployed: 1.5%
Mean travel time to work (commute): 26.7 minutes
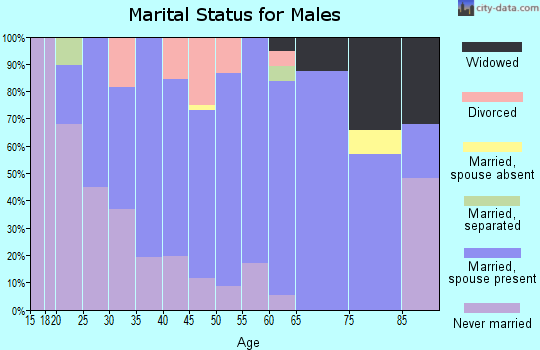
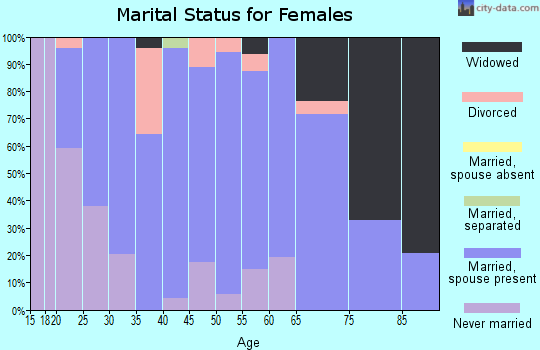
For population 15 years and over in 17864:
Never married: 31.9%
Now married: 58.5%
Separated: 0.5%
Widowed: 5.0%
Divorced: 4.1%
Zip code 17864 compared to state average:
Unemployed percentage significantly below state average.
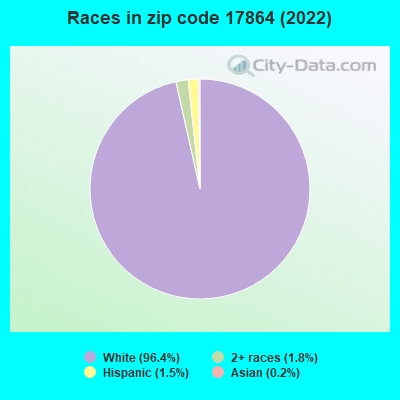
Black race population percentage significantly below state average.
Hispanic race population percentage significantly below state average.
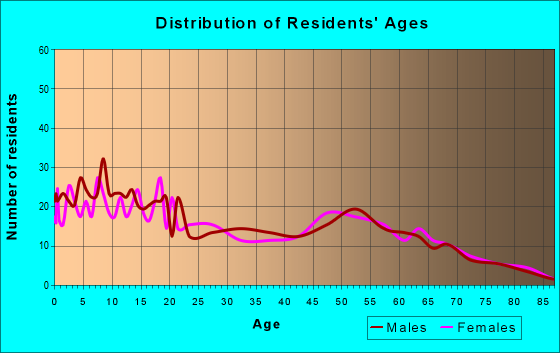
Median age significantly below state average.
Foreign-born population percentage significantly below state average.
Renting percentage below state average.
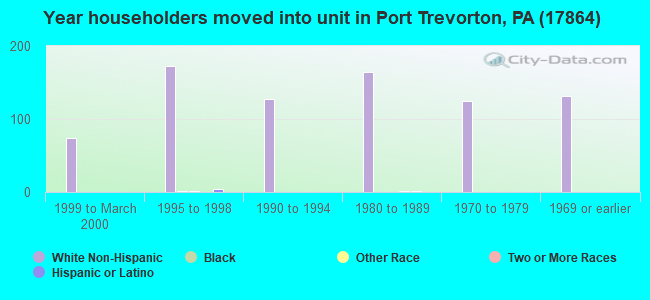
Length of stay since moving in significantly above state average.
Number of college students significantly below state average.
Percentage of population with a bachelor's degree or higher significantly below state average.
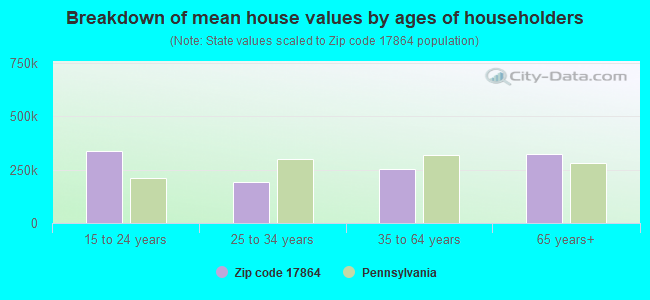
Estimated median house/condo value in 2022: $220,972
17864:
$220,972
Pennsylvania:
$245,500
According to our research of Pennsylvania and other state lists, there was 1 registered sex offender living in 17864 zip code as of May 20, 2024. The ratio of all residents to sex offenders in zip code 17864 is 2,368 to 1. The ratio of registered sex offenders to all residents in this zip code is much lower than the state average.
Median resident age:
This zip code:
32.1 years
Pennsylvania median age:
40.9 years
Average household size:
This zip code:
3.2 people
Pennsylvania:
2.4 people
Averages for the 2020 tax year for zip code 17864, filed in 2021:
Average Adjusted Gross Income (AGI) in 2020: $55,755 (Individual Income Tax Returns)
Here:
$55,755
State:
$75,707
Salary/wage: $42,226 (reported on 66.4% of returns)
Here:
$42,226
State:
$62,806
(% of AGI for various income ranges: 1640.0% for AGIs below $25k, 4147.9% for AGIs $25k-50k, 8241.4% for AGIs $50k-75k, 10888.0% for AGIs $75k-100k, 17088.0% for AGIs $100k-200k)
Taxable interest for individuals: $1,754 (reported on 35.5% of returns)
This zip code:
$1,754
Pennsylvania:
$1,633
(% of AGI for various income ranges: 75.0% for AGIs below $25k, 54.3% for AGIs $25k-50k, 204.3% for AGIs $50k-75k, 176.0% for AGIs $75k-100k, 144.0% for AGIs $100k-200k)
Ordinary dividends: $2,681 (reported on 14.5% of returns)
Here:
$2,681
State:
$7,382
(% of AGI for various income ranges: 17.1% for AGIs below $25k, 32.9% for AGIs $25k-50k, 45.7% for AGIs $50k-75k, 60.0% for AGIs $75k-100k, 594.0% for AGIs $100k-200k)
Net capital gain/loss in AGI: +$6,506 (reported on 15.5% of returns)
Here:
+$6,506
State:
+$23,522
(% of AGI for various income ranges: 31.4% for AGIs below $25k, 155.0% for AGIs $25k-50k, 215.7% for AGIs $50k-75k, 140.0% for AGIs $75k-100k, 1248.0% for AGIs $100k-200k)
Profit/loss from business: +$17,600 (reported on 24.5% of returns)
Here:
+$17,600
State:
+$16,274
(% of AGI for various income ranges: 502.9% for AGIs below $25k, 482.1% for AGIs $25k-50k, 1590.0% for AGIs $50k-75k, 476.0% for AGIs $75k-100k, 4044.0% for AGIs $100k-200k)
Taxable individual retirement arrangement distribution: $11,956 (reported on 8.2% of returns)
17864:
$11,956
Pennsylvania:
$18,583
(% of AGI for various income ranges: 213.6% for AGIs below $25k, 244.3% for AGIs $50k-75k, 1212.0% for AGIs $75k-100k)
Total itemized deductions: $29,225 (reported on 3.6% of returns)
Here:
$29,225
State:
$34,850
(% of AGI for various income ranges: 2338.0% for AGIs $100k-200k)
Charity contributions: $18,533 (reported on 2.7% of returns)
Here:
$18,533
State:
$12,392
(% of AGI for various income ranges: 1112.0% for AGIs $100k-200k)
Taxes paid: $6,650 (reported on 3.6% of returns)
17864:
$6,650
State:
$8,200
(% of AGI for various income ranges: 532.0% for AGIs $100k-200k)
Earned income credit: $2,070 (reported on 9.1% of returns)
Here:
$2,070
State:
$2,100
(% of AGI for various income ranges: 83.6% for AGIs below $25k, 64.3% for AGIs $25k-50k)
Percentage of individuals using paid preparers for their 2020 taxes: 91.8%
Here:
92%
State:
92%
(% for various income ranges: 89.2% for AGIs below $25k, 92.6% for AGIs $25k-50k, 94.7% for AGIs $50k-75k, 90.9% for AGIs $75k-100k, 92.3% for AGIs $100k-200k, 100.0% for AGIs over 200k)
Averages for the 2012 tax year for zip code 17864, filed in 2013:
Average Adjusted Gross Income (AGI) in 2012: $38,792 (Individual Income Tax Returns)
Here:
$38,792
State:
$61,346
Salary/wage: $33,115 (reported on 64.8% of returns)
Here:
$33,115
State:
$51,902
(% of AGI for various income ranges: 52.8% for AGIs below $25k, 55.3% for AGIs $25k-50k, 61.5% for AGIs $50k-75k, 66.6% for AGIs $75k-100k, 43.3% for AGIs $100k-200k)
Taxable interest for individuals: $1,633 (reported on 40.0% of returns)
This zip code:
$1,633
Pennsylvania:
$1,588
(% of AGI for various income ranges: 2.0% for AGIs below $25k, 0.9% for AGIs $25k-50k, 1.2% for AGIs $50k-75k, 0.9% for AGIs $75k-100k, 3.6% for AGIs $100k-200k)
Ordinary dividends: $2,319 (reported on 15.2% of returns)
Here:
$2,319
State:
$5,827
(% of AGI for various income ranges: 0.8% for AGIs below $25k, 0.6% for AGIs $25k-50k, 0.9% for AGIs $50k-75k, 0.3% for AGIs $75k-100k, 1.8% for AGIs $100k-200k)
Net capital gain/loss in AGI: +$2,209 (reported on 10.5% of returns)
Here:
+$2,209
State:
+$14,495
(% of AGI for various income ranges: 0.3% for AGIs $25k-50k, 0.7% for AGIs $50k-75k, 2.6% for AGIs $75k-100k)
Profit/loss from business: +$12,476 (reported on 23.8% of returns)
Here:
+$12,476
State:
+$16,268
(% of AGI for various income ranges: 14.1% for AGIs below $25k, 9.3% for AGIs $25k-50k, 6.7% for AGIs $50k-75k, 12.2% for AGIs $75k-100k)
Taxable individual retirement arrangement distribution: $7,800 (reported on 9.5% of returns)
17864:
$7,800
Pennsylvania:
$14,550
Total itemized deductions: $18,562 (21% of AGI, reported on 15.2% of returns)
Here:
$18,562
State:
$23,538
Here:
21.3% of AGI
State:
18.4% of AGI
(% of AGI for various income ranges: 5.2% for AGIs $25k-50k, 7.5% for AGIs $50k-75k, 7.8% for AGIs $75k-100k, 13.5% for AGIs $100k-200k)
Charity contributions: $5,492 (reported on 11.4% of returns)
Here:
$5,492
State:
$4,025
(% of AGI for various income ranges: 1.4% for AGIs below $25k, 1.1% for AGIs $50k-75k, 2.0% for AGIs $75k-100k, 4.0% for AGIs $100k-200k)
Taxes paid: $6,525 (reported on 15.2% of returns)
17864:
$6,525
State:
$9,982
(% of AGI for various income ranges: 1.2% for AGIs $25k-50k, 2.3% for AGIs $50k-75k, 3.2% for AGIs $75k-100k, 5.6% for AGIs $100k-200k)
Earned income credit: $2,245 (reported on 10.5% of returns)
Here:
$2,245
State:
$2,106
(% of AGI for various income ranges: 2.6% for AGIs below $25k, 1.0% for AGIs $25k-50k)
Percentage of individuals using paid preparers for their 2012 taxes: 72.4%
Here:
72%
State:
53%
(% for various income ranges: 68.9% for AGIs below $25k, 75.0% for AGIs $25k-50k, 73.3% for AGIs $50k-75k, 71.4% for AGIs $75k-100k, 83.3% for AGIs $100k-200k)
Averages for the 2004 tax year for zip code 17864, filed in 2005:
Average Adjusted Gross Income (AGI) in 2004: $35,605 (Individual Income Tax Returns)
Here:
$35,605
State:
$48,049
Salary/wage: $32,210 (reported on 72.2% of returns)
Here:
$32,210
State:
$42,646
(% of AGI for various income ranges: 71.8% for AGIs below $10k, 56.2% for AGIs $10k-25k, 71.4% for AGIs $25k-50k, 72.9% for AGIs $50k-75k, 62.1% for AGIs $75k-100k, 50.4% for AGIs over 100k)
Taxable interest for individuals: $1,470 (reported on 49.2% of returns)
This zip code:
$1,470
Pennsylvania:
$1,657
(% of AGI for various income ranges: 4.4% for AGIs below $10k, 3.0% for AGIs $10k-25k, 1.2% for AGIs $25k-50k, 1.8% for AGIs $50k-75k, 1.7% for AGIs $75k-100k, 3.3% for AGIs over 100k)
Taxable dividends: $1,727 (reported on 19.0% of returns)
Here:
$1,727
State:
$3,566
(% of AGI for various income ranges: 2.4% for AGIs below $10k, 1.7% for AGIs $10k-25k, 0.3% for AGIs $25k-50k, 0.3% for AGIs $50k-75k, 0.4% for AGIs $75k-100k, 2.5% for AGIs over 100k)
Net capital gain/loss: +$5,052 (reported on 13.6% of returns)
Here:
+$5,052
State:
+$9,716
(% of AGI for various income ranges: 1.5% for AGIs below $10k, 0.5% for AGIs $10k-25k, 1.0% for AGIs $25k-50k, 1.5% for AGIs $50k-75k, 1.2% for AGIs $75k-100k, 6.2% for AGIs over 100k)
Profit/loss from business: +$11,814 (reported on 23.5% of returns)
Here:
+$11,814
State:
+$14,267
(% of AGI for various income ranges: 22.7% for AGIs below $10k, 13.9% for AGIs $10k-25k, 10.1% for AGIs $25k-50k, 5.6% for AGIs $50k-75k, 3.5% for AGIs $75k-100k, 3.2% for AGIs over 100k)
Profit/loss from farming: +$9,568 (reported on 8.2% of returns)
Here:
+$9,568
State:
+$274
IRA payment deduction: $2,839 (reported on 3.1% of returns)
17864:
$2,839
Pennsylvania:
$2,903
Total itemized deductions: $15,012 (21% of AGI, reported on 16.8% of returns)
Here:
$15,012
State:
$18,804
Here:
20.8% of AGI
State:
19.5% of AGI
(% of AGI for various income ranges: 3.1% for AGIs $10k-25k, 5.9% for AGIs $25k-50k, 7.0% for AGIs $50k-75k, 10.5% for AGIs $75k-100k, 11.1% for AGIs over 100k)
Charity contributions deductions: $3,701 (5% of AGI, reported on 13.6% of returns)
Here:
$3,701
State:
$3,337
Here:
4.7% of AGI
State:
3.3% of AGI
(% of AGI for various income ranges: 0.6% for AGIs $10k-25k, 0.6% for AGIs $25k-50k, 1.1% for AGIs $50k-75k, 1.6% for AGIs $75k-100k, 4.3% for AGIs over 100k)
Total tax: $4,292 (reported on 73.0% of returns)
17864:
$4,292
State:
$8,008
(% of AGI for various income ranges: 2.2% for AGIs below $10k, 5.1% for AGIs $10k-25k, 6.3% for AGIs $25k-50k, 8.4% for AGIs $50k-75k, 10.3% for AGIs $75k-100k, 16.9% for AGIs over 100k)
Earned income credit: $1,526 (reported on 9.8% of returns)
Here:
$1,526
State:
$1,643
Percentage of individuals using paid preparers for their 2004 taxes: 69.4%
Here:
69%
State:
56%
(% for various income ranges: 58.9% for AGIs below $10k, 75.2% for AGIs $10k-25k, 71.5% for AGIs $25k-50k, 66.4% for AGIs $50k-75k, 62.5% for AGIs $75k-100k, 83.3% for AGIs over 100k)
Household received Food Stamps/SNAP in the past 12 months: 76 Household did not receive Food Stamps/SNAP in the past 12 months: 664
Women who had a birth in the past 12 months: 43 (45 now married, 0 unmarried) Women who did not have a birth in the past 12 months: 385 (191 now married, 193 unmarried)
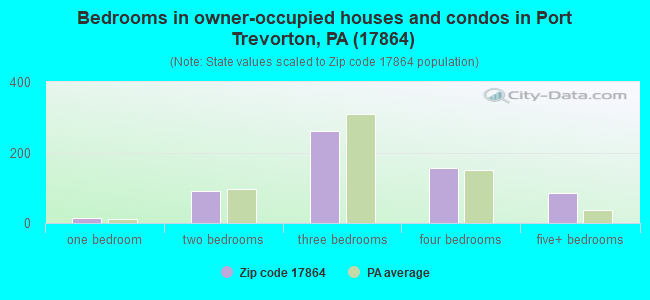
Housing units in zip code 17864 with a mortgage: 300 (60 second mortgage, 54 both second mortgage and home equity loan) Houses without a mortgage: 32
Median monthly owner costs for units with a mortgage: $1,286 Median monthly owner costs for units without a mortgage: $462
Residents with income below the poverty level in 2022:
This zip code:
9.9%
Whole state:
11.8%
Residents with income below 50% of the poverty level in 2022:
This zip code:
8.2%
Whole state:
6.1%
Median number of rooms in houses and condos:
Here:
7.0
State:
6.8
Median number of rooms in apartments:
Here:
5.6
State:
4.3
Notable locations in this zip code not listed on our city pages
Churches in zip code 17864 include: Saint Johns Church (A), Chapman Church (B), Saint Pauls Church (C), Paradise Church (D), Stauffer Church (E), Susquehanna Church (F). Display/hide their locations on the map
Size of family households: 282 2-persons, 100 3-persons, 68 4-persons, 24 5-persons, 54 6-persons, 75 7-or-more-persons
Size of nonfamily households: 119 1-person, 13 2-persons, 4 3-persons
590 married couples with children.
59 single-parent households (6 men, 53 women).
64.8% of residents of 17864 zip code speak English at home.
0.7% of residents speak Spanish at home (100% very well).
35.0% of residents speak other Indo-European language at home (56% very well, 36% well, 5% not well, 3% not at all).
0.1% of residents speak Asian or Pacific Island language at home (100% very well).
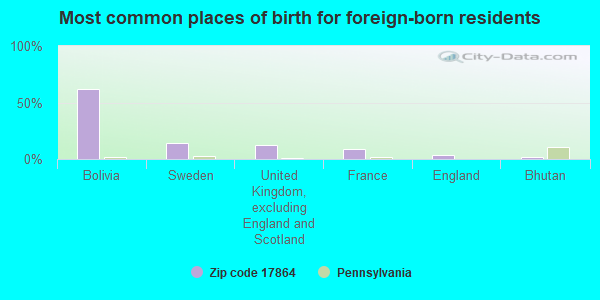
Foreign born population: 57 (2.4%) (18.5% of them are naturalized citizens)
This zip code:
2.4%
Whole state:
7.5%
62%Bolivia
14%Sweden
12%United Kingdom, excluding England and Scotland
9%France
3%England
2%Bhutan
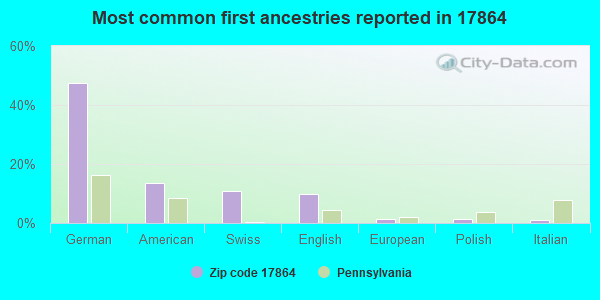
48%German
13%American
11%Swiss
10%English
1%European
1%Polish
1%Italian
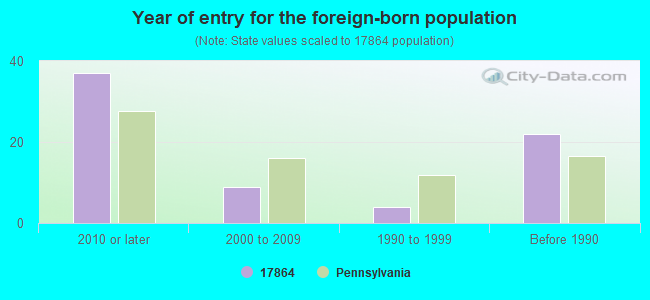
Year of entry for the foreign-born population
372010 or later
92000 to 2009
41990 to 1999
22Before 1990
Facilities with environmental interests located in this zip code:
ARBOGAST RESIDENCE (RD 2 BOX 645 in PORT TREVORTON, PA)
National Pollutant Discharge Elimination System NON-MAJOR (Tracking pollutant discharge elimination systems) - permit Business SIC classification: OPERATORS OF DWELLINGS OTHER THAN APARTMENT BUILDINGS Alternative names: ARBOGAST, PAUL, ARBOGAST, PAUL & BETH
Housing units lacking complete plumbing facilities: 4.0% Housing units lacking complete kitchen facilities: 4.2%
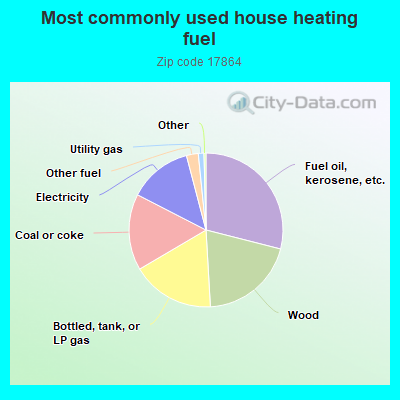
29.1%Fuel oil, kerosene, etc.
20.2%Wood
17.5%Bottled, tank, or LP gas
16.1%Coal or coke
13.4%Electricity
2.5%Other fuel
1.2%Utility gas
Population in 1990: 2,911.
Place of birth for U.S.-born residents:
This state: 2,140
Northeast: 66
Midwest: 24
South: 60
West: 16
75% of the 17864 zip code residents lived in the same house 5 years ago. Out of people who lived in different houses, 55% lived in this county. Out of people who lived in different counties, 50% lived in Pennsylvania.
95% of the 17864 zip code residents lived in the same house 1 year ago. Out of people who lived in different houses, 60% moved from this county. Out of people who lived in different houses, 37% moved from different county within same state. Out of people who lived in different houses, 5% moved from abroad.
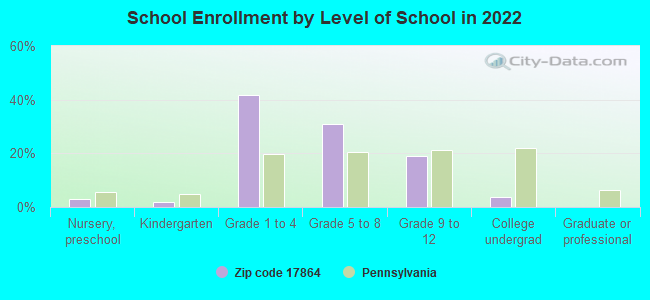
Private vs. public school enrollment:
Students in private schools in grades 1 to 8 (elementary and middle school): 208
Here:
66.5%
Pennsylvania:
15.7%
Students in private schools in grades 9 to 12 (high school): 24
Here:
30.6%
Pennsylvania:
13.4%
Students in private undergraduate colleges: 1
Here:
11.6%
Pennsylvania:
39.8%
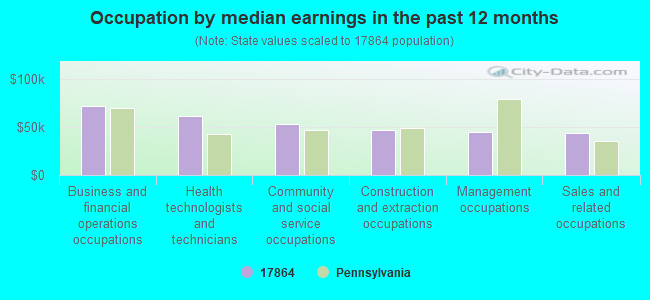
Occupation by median earnings in the past 12 months ($)
72,097Business and financial operations occupations
61,253Health technologists and technicians
52,478Community and social service occupations
46,773Construction and extraction occupations
45,176Management occupations
43,138Sales and related occupations
Top industries in this zip code by the number of employees in 2005:
Wholesale Trade: Sporting and Recreational Goods and Supplies Merchant Wholesalers (50-99 employees: 1 establishment)
Construction: Site Preparation Contractors (10-19: 1)
Administrative and Support and Waste Management and Remediation Services: Temporary Help Services (10-19: 1)
Construction: New Single-Family Housing Construction (except Operative Builders) (5-9: 1)
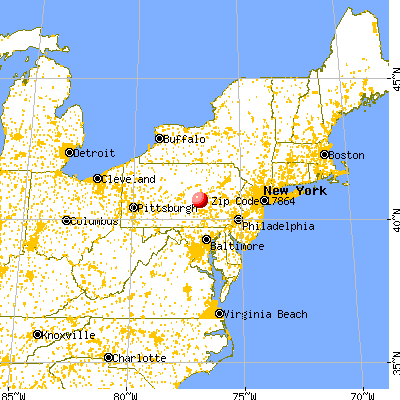


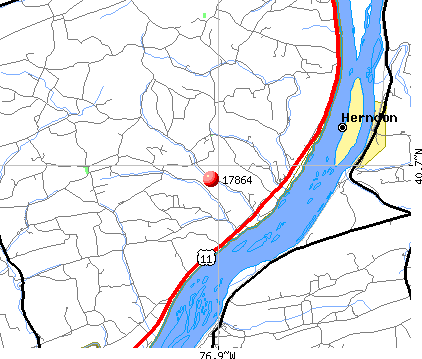 Nearest zip codes: 17017, 17827, 17853, 17830, 17870, 17080.